June 19, 2026
The European Union's carbon border adjustment mechanism ammonia regulations are fundamentally transforming how international fertiliser trade operates, creating unprecedented compliance requirements for importers while driving significant shifts in global production patterns. This comprehensive policy framework targets carbon-intensive industries to prevent carbon leakage and maintain industrial competitiveness, with ammonia facing particularly severe exposure due to its energy-intensive production processes and critical role in agricultural supply chains.
The decarbonisation benefits of transitioning to cleaner production methods are becoming increasingly apparent as carbon pricing mechanisms reshape global commodity markets. Furthermore, the industry evolution trends indicate that organisations must adapt quickly to maintain competitiveness in carbon-constrained environments.
Understanding the EU Carbon Border Adjustment Mechanism for Ammonia Trade
Regulatory Framework and Implementation Timeline
The carbon border adjustment mechanism operates through a carefully structured two-phase implementation approach designed to allow market adaptation while ensuring regulatory compliance. The transition phase, which commenced on October 1, 2023, establishes reporting requirements without immediate financial penalties, enabling importers to familiarise themselves with documentation procedures and emission calculation methodologies.
Beginning January 1, 2026, the definitive phase introduces mandatory certificate purchase and surrender obligations that create direct financial implications for ammonia importers. This timeline provides approximately two years for supply chain preparation, allowing both EU importers and international producers to establish necessary verification systems and documentation protocols.
Recent regulatory updates confirm that all country-specific default emission values will increase by 1% in 2026, reflecting administrative markup considerations in the final implementation phase. This adjustment affects the baseline calculations for carbon content assessments across all covered ammonia-producing regions.
The legislative foundation rests on EU Regulation 2023/956, supplemented by implementing delegated regulations that specify technical calculation methodologies, verification requirements, and default emission factors. These secondary regulations provide the detailed operational framework necessary for practical implementation across member state customs authorities.
Ammonia's Classification Under CBAM Coverage
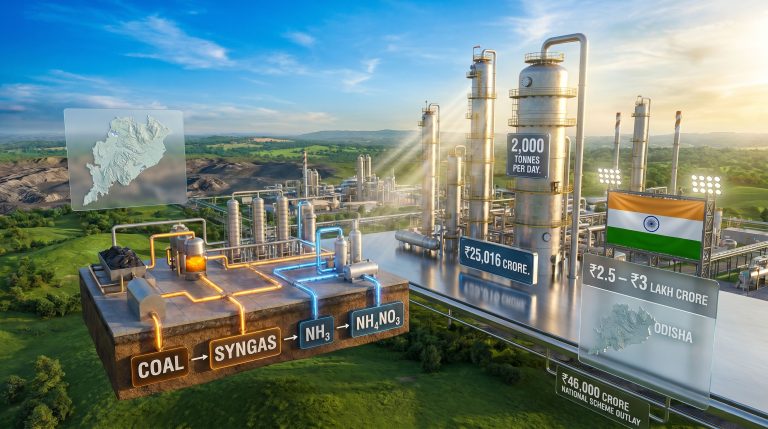
Ammonia falls within the fertiliser sector designation under the carbon border adjustment mechanism's scope, which covers six energy-intensive industry categories: cement, steel, aluminium, fertilisers, electricity, and organic chemicals. This classification encompasses both direct ammonia imports and certain downstream fertiliser products containing ammonia as a primary input.
The regulatory approach distinguishes between anhydrous ammonia as a standalone chemical commodity and ammonia-derived fertiliser products such as urea, ammonium nitrate, and diammonium phosphate. Each category requires specific emission factor calculations and verification procedures, though the underlying carbon content assessment principles remain consistent.
Product classification follows harmonised customs codes, with specific tariff headings determining CBAM applicability. Importers must accurately identify their products within these classifications to ensure proper compliance procedures and avoid potential penalties for misclassification.
When big ASX news breaks, our subscribers know first
How Does CBAM Calculate Carbon Content for Ammonia Imports?
Emissions Measurement Methodologies
The carbon content calculation methodology employs a hierarchical approach that prioritises facility-specific verified data over country-specific default values. When ammonia producers provide independently verified emissions data covering both direct (Scope 1) and indirect (Scope 2) emissions, importers can utilise these facility-specific measurements for CBAM compliance calculations.
Direct emissions (Scope 1) encompass all greenhouse gas releases occurring within the ammonia production facility boundaries, including:
- Hydrogen production through steam methane reforming or alternative processes
- Process emissions from the Haber-Bosch nitrogen fixation reaction
- Combustion of fossil fuels for heat and steam generation
- Fugitive emissions from equipment and storage systems
Indirect emissions (Scope 2) cover greenhouse gas emissions associated with purchased electricity consumed during ammonia production, calculated based on the carbon intensity of the local electricity grid or specific power purchase agreements.
The verification process requires independent third-party verification bodies accredited under ISO 14064-3 standards to validate emissions data. These verifiers must assess production processes, measurement systems, and calculation methodologies to ensure accuracy and completeness of reported emissions factors.
Default Values vs. Facility-Specific Data
When facility-specific verified emissions data remains unavailable, the carbon border adjustment mechanism applies country-specific default emission values calculated as weighted averages of representative production facilities within each exporting region. Recent regulatory documentation reveals significant variations in these default values across major ammonia-supplying countries.
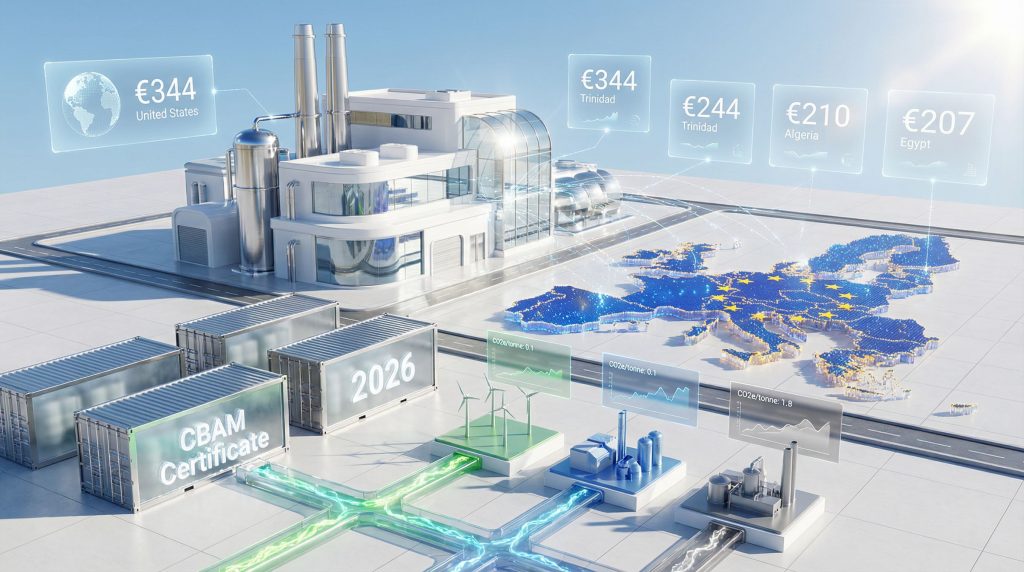
CBAM Default Emission Values for Ammonia (2026 Implementation)
| Country | CO2e per Tonne | Production Route | Theoretical Cost at €100/tonne ETS |
|---|---|---|---|
| United States | 3.44t | Petroleum coke gasification | €344 |
| Trinidad | 2.44t | Natural gas reforming | €244 |
| Algeria | 2.10t | Natural gas reforming | €210 |
| Egypt | 2.07t | Natural gas reforming | €207 |
The substantial variation in default emission values reflects fundamental differences in production technologies and feedstock sources. The United States default value of 3.44t CO2e per tonne represents a significant increase from preliminary estimates, driven by a shift in the representative production pathway from natural gas-based steam methane reforming to petroleum coke-based gasification processes.
This production route change carries profound implications for US ammonia competitiveness in EU markets. At current ETS prices around €100.35 per tonne CO2e, US ammonia faces theoretical CBAM costs of approximately €344 per tonne, compared to €207 for Egyptian supply – a differential of €137 per tonne that fundamentally alters trade economics.
Facility-specific data reporting provides potential advantages for producers with lower-than-average carbon intensities within their respective countries. Efficient production facilities utilising renewable electricity, advanced process optimisation, or carbon capture technologies can demonstrate emission factors below country default values, reducing CBAM exposure for their export customers.
The ammonia free allocations benchmark establishes the reference point for EU domestic producers, revised to 1.522t CO2e per tonne in 2026, declining to 1.484t CO2e in subsequent years through a 2.5% annual reduction factor. This benchmark represents the carbon intensity threshold below which EU producers receive free emission allowances under the domestic ETS system.
What Are the Compliance Requirements for Ammonia Importers?
Authorisation and Registration Processes
The carbon border adjustment mechanism establishes a 50-tonne annual threshold that determines mandatory compliance obligations for ammonia importers. Organisations importing more than 50 tonnes of ammonia annually into the EU must obtain CBAM importer authorisation through their respective national competent authorities, typically customs or environment ministries within member states.
The authorisation process requires submission of comprehensive company documentation including:
- Legal entity identification and corporate registration details
- Contact information for responsible compliance personnel
- Estimated annual import volumes for covered products
- Supply chain information identifying upstream producers
- Financial guarantees or bonding arrangements as required by national authorities
Once authorised, importers receive unique CBAM identification numbers that facilitate tracking through the centralised EU CBAM Registry system. This digital platform manages all aspects of compliance monitoring, certificate trading, and reporting obligations across the European Union.
Registration timing proves critical for import planning, as authorities require adequate processing periods for authorisation applications. Importers approaching the 50-tonne threshold during mid-year periods must proactively seek authorisation to avoid compliance violations.
Certificate Purchase and Surrender Obligations
CBAM certificate pricing directly correlates with EU Emissions Trading System allowance prices through weekly average calculations published by the European Commission. This pricing mechanism ensures equivalent carbon costs between domestic EU production (covered by ETS) and imported products (covered by CBAM).
Current market conditions indicate ETS prices around €100.35 per tonne CO2e, establishing the baseline for CBAM certificate costs. These prices fluctuate with European carbon market dynamics, creating both hedging opportunities and pricing uncertainty for importers managing supply chain costs.
Quarterly reporting and surrender schedules create continuous compliance obligations:
- Q1 2026: Certificate surrender deadline June 30, 2026
- Q2 2026: Certificate surrender deadline September 30, 2026
- Q3 2026: Certificate surrender deadline December 31, 2026
- Q4 2026: Certificate surrender deadline March 31, 2027
Practical CBAM cost calculation example:
Importing 1,000 tonnes of US ammonia in Q1 2026:
- Emission factor: 3.44t CO2e per tonne ammonia
- Total emissions: 1,000 × 3.44 = 3,440t CO2e
- Certificate cost: 3,440 × €100.35 = €345,203
- Quarterly compliance burden: €345,203 per quarter
Penalty structures for non-compliance include:
- €100 penalty per missing certificate plus requirement to surrender double the missing quantity in subsequent periods
- Administrative fines up to €10,000 for false emissions data reporting
- Potential criminal liability for intentional misrepresentation of import quantities or emissions factors
Supply Chain Documentation Requirements
Cross-border emissions verification creates complex documentation requirements linking non-EU ammonia producers with EU importers through internationally recognised verification protocols. This supply chain integration represents one of the most challenging aspects of CBAM implementation.
Required documentation elements for each ammonia shipment include:
- Producer facility identification and location details
- Accredited verifier certification and verification report
- Product-specific emission factors (Scope 1 + Scope 2)
- Production period and methodology documentation
- Third-country carbon pricing payment evidence (if applicable)
- Transportation logistics and interim storage records
Record retention obligations mandate importers maintain comprehensive documentation for minimum five-year periods, creating substantial administrative burdens for companies managing multiple supply sources. Digital record-keeping systems become essential for managing the volume and complexity of required documentation.
The verification chain requires non-EU producers to engage ISO 14064-3 accredited verification bodies that can issue internationally recognised emissions verification reports. These reports must meet EU technical standards while operating within the regulatory frameworks of origin countries, creating potential coordination challenges across different legal systems.
Which Production Routes Minimise CBAM Exposure?
Green Ammonia Competitive Advantages
Green ammonia production through renewable hydrogen pathways offers the most significant opportunity for minimising carbon border adjustment mechanism exposure. This production route utilises renewable electricity for hydrogen generation via electrolysis, combined with atmospheric nitrogen separation to produce ammonia with dramatically reduced carbon intensity.
Theoretical green ammonia carbon intensity ranges from 0.2-0.5t CO2e per tonne, compared to the ammonia free allocations benchmark of 1.522t CO2e per tonne established for EU domestic production. This represents potential carbon intensity reductions of 67-87% relative to the EU benchmark and 85-94% compared to US conventional production at 3.44t CO2e per tonne.
Green ammonia production pathway components:
- Renewable electricity generation (solar, wind, hydroelectric)
- Water electrolysis for hydrogen production (30-40% efficiency losses)
- Air separation for nitrogen extraction via cryogenic or PSA processes
- Haber-Bosch synthesis requiring 10-20 MWh per tonne ammonia
- Product purification and liquefaction for transportation
Economic advantages under CBAM implementation:
- Near-zero CBAM certificate requirements for verified green ammonia
- Competitive cost advantages estimated at €300+ per tonne versus US conventional supply
- Premium pricing opportunities in EU markets for verified low-carbon products
- Future-proofed production against strengthening carbon pricing mechanisms
Investment incentives supporting green ammonia development include the EU Innovation Fund providing €10 billion for first-mover clean technology projects, alongside member state national funding programs targeting renewable hydrogen infrastructure development.
Blue Ammonia with Carbon Capture
Blue ammonia represents an intermediate decarbonisation pathway utilising conventional steam methane reforming or partial oxidation processes combined with carbon capture, utilisation, and storage (CCUS) technologies. This approach can achieve significant emission reductions while leveraging existing natural gas infrastructure and industrial expertise.
Blue ammonia carbon intensity typically ranges from 1.0-2.5t CO2e per tonne, depending on capture efficiency rates and methane leakage factors throughout the production process. High-efficiency CCUS systems achieving 90-95% CO2 capture rates can approach emission factors comparable to the EU ammonia benchmark.
Technology deployment considerations:
- Capital investment requirements of $100-200 million for retrofit applications
- Geological storage availability varies significantly across producing regions
- Operational complexity increases with CCUS integration requirements
- Energy penalties from capture processes reduce overall production efficiency by 10-15%
Regional CCUS deployment status:
- Middle East: Advanced projects in UAE, Saudi Arabia, and Qatar
- North America: Pilot projects across US Gulf Coast and Canadian Alberta
- Africa: Limited geological storage characterisation and infrastructure development
- Asia-Pacific: Technology development programs in Australia and Malaysia
The economics of blue ammonia depend critically on the spread between conventional production costs plus CBAM obligations versus the incremental investment required for carbon capture integration. At current CBAM certificate prices around €100 per tonne CO2e, capture technologies become economically viable for emission reduction levels exceeding 50%.
Moreover, this technological transition is affecting various sectors, particularly as highlighted in the Canada energy transition challenges, where similar carbon-intensive industries must navigate regulatory complexities while maintaining competitiveness.
Traditional Grey Ammonia Challenges
Conventional grey ammonia production utilising steam methane reforming without carbon capture faces the most severe CBAM exposure due to inherently high carbon intensity from fossil fuel feedstock consumption and process emissions. The recent revision of US default emissions to 3.44t CO2e per tonne reflects the carbon intensity challenges facing traditional production routes.
Production efficiency variations across grey ammonia facilities create opportunities for optimisation within existing technology frameworks:
- Best-in-class natural gas facilities: 2.0-2.5t CO2e per tonne
- Average global efficiency: 2.5-3.0t CO2e per tonne
- Lower efficiency operations: 3.0-4.0t CO2e per tonne
- Coal-based production: 4.0-6.0t CO2e per tonne
Retrofit opportunities for existing grey ammonia facilities include:
- Heat integration optimisation reducing natural gas consumption by 5-10%
- Catalyst technology upgrades improving conversion efficiency
- Process automation minimising operational variations and energy waste
- Renewable electricity integration for auxiliary power requirements
Regional competitiveness analysis reveals significant variations in CBAM exposure:
- Trinidad natural gas advantage: Low feedstock costs and efficient facilities
- Middle East competitive position: Abundant natural gas supplies and modern infrastructure
- US production challenges: High default emission factors and rising feedstock costs
- European import dependency: Limited domestic production capacity requiring imports
The transition away from grey ammonia production appears inevitable under strengthening carbon pricing mechanisms, though the timeline depends on renewable hydrogen cost reductions and carbon capture technology deployment rates. Additionally, the sustainability transformation across industrial sectors demonstrates how companies are adapting to environmental regulations through innovative approaches.
How Will CBAM Reshape Global Ammonia Trade Patterns?
Supply Chain Reconfiguration Scenarios
The implementation of the carbon border adjustment mechanism ammonia creates powerful economic incentives for ammonia importers to restructure their supply chains toward lower-emission producers. The €137 per tonne cost differential between US conventional ammonia (€344 CBAM cost) and Egyptian supply (€207 CBAM cost) provides compelling motivation for sourcing diversification.
Short-term supply chain adaptations (2026-2028) likely include:
- Increased imports from Algeria and Egypt leveraging lower default emission values
- Reduced US market share in European ammonia trade
- Premium pricing for verified low-carbon production creating two-tier market structure
- Long-term contract renegotiation incorporating carbon intensity specifications
Medium-term structural changes (2028-2032) may encompass:
- Investment flow redirection toward green and blue ammonia projects
- Regional hub development in areas with renewable energy advantages
- Transportation optimisation balancing carbon costs with logistics efficiency
- Vertical integration strategies linking renewable energy with ammonia production
Trade agreement implications become increasingly significant as carbon border adjustments interact with existing preferential trading arrangements. Free trade agreements lacking climate provisions may require renegotiation to address carbon leakage concerns and maintain commercial viability.
Investment Flow Redirection
Capital allocation patterns across the global ammonia industry face fundamental restructuring as carbon pricing mechanisms alter project economics and return profiles. Traditional investment criteria focusing primarily on feedstock availability and transportation costs must now incorporate carbon intensity considerations and regulatory compliance costs.
Green ammonia project investment drivers:
- Renewable energy resource availability (solar irradiation, wind profiles, hydroelectric capacity)
- Electrolysis technology cost reductions projecting 50-70% decreases by 2030
- Government policy support through subsidies, tax credits, and regulatory frameworks
- Offtake agreement security with premium pricing for verified low-carbon ammonia
Technology transfer acceleration to developing markets creates opportunities for leapfrog development patterns, where emerging ammonia producers can adopt clean production technologies without legacy infrastructure constraints.
Infrastructure development requirements for clean ammonia production include:
- Renewable electricity grid integration requiring transmission and storage capacity
- Hydrogen production and storage facilities with appropriate safety and handling systems
- Port infrastructure modifications for ammonia export terminal development
- Maritime transportation specialised for clean ammonia trade routes
Investment risk considerations encompass technology performance, regulatory stability, and market acceptance factors that influence project financing costs and commercial viability assessments.
Competitive Dynamics Between Exporting Regions
The carbon border adjustment mechanism fundamentally alters competitive positioning among major ammonia-exporting regions, creating winners and losers based primarily on production technology and carbon intensity rather than traditional cost advantages.
Regional competitive positioning analysis:
Middle East and North Africa maintain strong competitive positions through:
- Natural gas-based production with relatively efficient facilities
- Proximity to European markets reducing transportation costs
- Potential for blue ammonia development with geological CO2 storage
- Government support for industrial diversification and decarbonisation
United States faces significant challenges:
- Highest default emission factor (3.44t CO2e/tonne) among major suppliers
- Petroleum coke production route revision increasing carbon intensity
- Substantial CBAM cost burden (€344/tonne) affecting export competitiveness
- Need for major technology investments to maintain EU market access
Caribbean and South American producers benefit from:
- Established natural gas-based production with moderate emission factors
- Existing trade relationships and logistics infrastructure with Europe
- Opportunities for renewable energy integration in future projects
- Competitive positioning relative to North American suppliers
Asia-Pacific emerging markets present mixed prospects:
- Coal-based production faces severe CBAM exposure exceeding US levels
- Natural gas producers maintain moderate competitiveness
- Substantial renewable energy potential for future green ammonia development
- Infrastructure investment requirements for clean production scaling
Market share redistribution projections suggest potential European import source diversification away from high-carbon intensity suppliers toward regions with demonstrated emission reduction capabilities and verification systems.
What Strategic Responses Should Industry Stakeholders Consider?
Producer Adaptation Strategies
Ammonia producers face fundamental strategic decisions regarding technology investments, market positioning, and regulatory compliance approaches as carbon border adjustment mechanism implementation approaches. The scale of required adaptations varies dramatically based on current production technology and carbon intensity levels.
Technology upgrade pathway options:
Immediate efficiency improvements (2024-2026):
- Process optimisation and heat integration systems
- Catalyst technology upgrades reducing energy consumption
- Renewable electricity procurement for auxiliary power requirements
- Operational best practices minimising fugitive emissions
Medium-term carbon reduction investments (2026-2030):
- Carbon capture and storage system integration
- Natural gas feedstock optimisation and leakage reduction
- Facility-specific emissions verification and reporting systems
- Blue hydrogen integration for partial decarbonisation
Long-term transformation strategies (2030+):
- Complete conversion to renewable hydrogen-based production
- Strategic site selection for renewable energy access
- Vertical integration with renewable electricity generation
- Green ammonia product differentiation and premium positioning
Market positioning considerations require producers to evaluate the trade-offs between EU market access, alternative export destinations, and domestic market opportunities. Regions with lower carbon pricing mechanisms may provide temporary competitive advantages, though global policy convergence trends suggest widespread adoption of similar measures.
Policy advocacy opportunities enable producers to influence domestic carbon pricing mechanisms that could provide CBAM cost offsets. Carbon taxes or cap-and-trade systems implemented in producing countries can reduce CBAM obligations through third-country carbon price deductions.
Importer Risk Management Approaches
European ammonia importers must develop comprehensive risk management strategies addressing both compliance obligations and supply chain security considerations. The complexity of CBAM requirements creates multiple risk vectors requiring proactive management approaches.
Supplier diversification strategies:
- Geographic diversification across multiple producing regions to reduce single-country dependency
- Technology pathway diversification balancing conventional, blue, and green ammonia sources
- Verification status assessment prioritising suppliers with established emissions reporting capabilities
- Long-term partnership development with producers committed to decarbonisation investments
Carbon cost management approaches:
- CBAM certificate procurement strategies utilising forward contracting and hedging mechanisms
- Supply chain emission verification supporting facility-specific data collection and documentation
- Internal carbon accounting systems tracking and optimising total cost of ownership including carbon costs
- Premium product positioning for verified low-carbon ammonia in downstream markets
Compliance system development:
- Digital documentation platforms managing complex supply chain verification requirements
- Quarterly reporting automation reducing administrative burden and compliance risks
- Legal and regulatory expertise ensuring accurate interpretation of evolving CBAM requirements
- Supply chain transparency initiatives enabling end-to-end carbon footprint tracking
Financial planning considerations must account for the volatility of ETS-linked CBAM certificate prices and the potential for regulatory evolution affecting compliance costs and requirements.
Consequently, the broader energy security challenges facing industries worldwide highlight the importance of strategic planning in navigating these regulatory transitions while maintaining operational resilience.
Policy Coordination Opportunities
The success of the carbon border adjustment mechanism depends significantly on international policy coordination and technical cooperation mechanisms that facilitate trade flow continuity while achieving environmental objectives. Multiple stakeholders can contribute to constructive policy development.
International carbon pricing alignment initiatives:
- Bilateral cooperation agreements establishing mutual recognition of carbon pricing systems
- Technical working groups harmonising emissions measurement and verification standards
- Capacity building programs supporting developing country producers in establishing CBAM compliance systems
- Technology transfer mechanisms facilitating clean production technology deployment
Technical cooperation priorities:
- Verification body accreditation ensuring international recognition of emissions verification reports
- Digital documentation standards enabling seamless information flow across supply chains
- Measurement methodology harmonisation reducing technical barriers to facility-specific data reporting
- Quality assurance frameworks maintaining integrity of emissions data and verification processes
Trade agreement integration opportunities:
- Climate chapter inclusion in future trade negotiations addressing carbon border adjustment coordination
- Regulatory cooperation mechanisms streamlining CBAM compliance for established trading partners
- Dispute resolution procedures managing potential trade conflicts arising from carbon border adjustments
- Development assistance programs supporting clean technology adoption in emerging markets
These coordination mechanisms can reduce trade friction while maintaining environmental integrity, ensuring that the carbon border adjustment mechanism achieves climate objectives without unnecessarily disrupting established commercial relationships.
The next major ASX story will hit our subscribers first
Frequently Asked Questions About CBAM and Ammonia
When do payment obligations begin for ammonia imports?
Payment obligations for ammonia imports commence with the definitive phase launch on January 1, 2026. Importers must purchase and surrender CBAM certificates quarterly, with the first surrender deadline occurring June 30, 2026 for Q1 2026 import volumes. The transition phase (October 2023 through December 2025) requires only reporting obligations without financial penalties.
Can carbon taxes paid in the origin country reduce CBAM costs?
Yes, carbon taxes or emissions trading system charges paid in the country of origin can reduce CBAM obligations through third-country carbon price deductions. Importers must provide documentation proving carbon pricing payments related to ammonia production, with the deduction amount calculated based on verified carbon price levels. However, the origin country carbon price must meet EU recognition criteria for eligibility.
How are emissions calculated for ammonia-based fertiliser products?
Emissions calculations for downstream fertiliser products like urea or ammonium nitrate incorporate both the ammonia input carbon content and additional processing emissions. Each fertiliser product has specific emission factors accounting for the ammonia component plus direct emissions from the manufacturing process. Facility-specific data can provide more accurate calculations than default values for complex fertiliser products.
What documentation is required from non-EU suppliers?
Non-EU ammonia suppliers must provide independently verified emissions reports from ISO 14064-3 accredited verification bodies, including facility identification, production methodology, Scope 1 and Scope 2 emissions data, and verification certificates. Additional documentation includes production period specifications, carbon pricing payment evidence (if applicable), and chain-of-custody records linking production to specific export shipments.
Implementation Timeline and Future Developments
2026 Definitive Phase Launch Preparations
The transition from reporting-only obligations to mandatory financial compliance represents a critical milestone requiring comprehensive preparation across regulatory, commercial, and operational dimensions. Final methodology guidance publication scheduled for Q1 2025 will provide definitive technical specifications for emissions calculations, verification requirements, and certificate surrender procedures.
Industry readiness assessment indicators include:
- Importer authorisation completion rates across EU member states
- Verification body accreditation progress in major exporting countries
- Digital infrastructure deployment for CBAM registry and reporting systems
- Supply chain documentation system establishment linking producers to importers
Potential implementation challenges:
- Administrative capacity constraints in national competent authorities
- Verification system gaps in certain producing regions
- Digital platform performance under full-scale operational loads
- Market liquidity concerns for CBAM certificate trading mechanisms
Contingency planning mechanisms may include grace periods for administrative errors, provisional compliance procedures for systems integration issues, and technical assistance programs supporting smaller market participants in achieving compliance readiness.
Long-term CBAM Evolution Prospects
The carbon border adjustment mechanism ammonia represents the initial implementation of a policy framework likely to expand in scope, geographical coverage, and technical sophistication over time. Scope expansion considerations already under discussion include additional industrial sectors, downstream products, and indirect emissions coverage.
Potential future developments:
Sectoral expansion may encompass:
- Plastics and petrochemicals with ammonia inputs
- Hydrogen and hydrogen-derived products
- Additional metals and mineral processing industries
- Transportation fuels with carbon border adjustment applications
Geographical coordination prospects include:
- G7 carbon border adjustment alignment creating coordinated international frameworks
- Developing country partnership programs supporting clean technology deployment and CBAM compliance
- Regional carbon market integration linking CBAM with other cap-and-trade systems
- Technology standard harmonisation reducing technical barriers to international trade
Methodology enhancement directions encompass:
- Lifecycle assessment integration incorporating upstream and downstream emissions
- Digital monitoring systems utilising blockchain and IoT technologies for real-time emissions tracking
- Artificial intelligence applications for emissions verification and fraud detection
- Sectoral benchmarking refinements reflecting technological progress and efficiency improvements
Key Compliance Deadlines for Ammonia Importers
- Q1 2025: Final methodology guidance publication by European Commission
- January 1, 2026: Definitive CBAM phase implementation with financial obligations
- June 30, 2026: First certificate surrender deadline for Q1 2026 imports
- 2027 onwards: Annual reporting cycles with quarterly certificate surrender requirements
Economic Impact Assessment and Market Projections
Cost Structure Analysis for Different Production Routes
The implementation of the carbon border adjustment mechanism fundamentally alters the economic competitiveness of different ammonia production technologies, creating new investment incentives and market dynamics. Break-even carbon price analysis reveals critical threshold levels where technology switching becomes economically viable.
Technology switching economics at various ETS price scenarios:
| ETS Price Level | Grey Ammonia CBAM Cost | Blue Ammonia Advantage | Green Ammonia Advantage |
|---|---|---|---|
| €75/tonne | €258 (US supply) | €150-200 savings | €250+ savings |
| €100/tonne | €344 (US supply) | €200-275 savings | €340+ savings |
| €125/tonne | €430 (US supply) | €250-350 savings | €420+ savings |
Investment payback period calculations for clean ammonia projects vary significantly based on carbon price assumptions, technology costs, and financing conditions:
- Green ammonia projects: 8-12 year payback periods at €100/tonne carbon prices
- Blue ammonia retrofits: 5-8 year payback periods with 90% capture efficiency
- Efficiency optimisation: 2-4 year payback periods for operational improvements
Regional competitiveness shifts under various carbon pricing scenarios demonstrate the vulnerability of high-emission production locations to policy-driven market changes. Traditional cost advantages from cheap feedstock access become insufficient to offset carbon pricing obligations.
Capital allocation implications suggest potential investment redirection exceeding $50 billion globally over the next decade as producers adapt to carbon-constrained trade environments. This represents one of the largest technology transition investments in industrial chemistry.
Global Supply Security Implications
The carbon border adjustment mechanism creates potential supply security risks for food systems dependent on ammonia-derived fertilisers, particularly in regions with limited domestic production capacity or high import dependency ratios.
Food security considerations:
- European fertiliser import dependency exceeding 60% for nitrogen products
- Global fertiliser trade disruption potential during technology transition periods
- Price volatility implications for agricultural input costs and food affordability
- Strategic stockpiling requirements for essential agricultural nutrients
Alternative nitrogen fixation technology development gains strategic importance as carbon pricing mechanisms alter traditional ammonia economics:
- Distributed ammonia production utilising renewable electricity and modular technologies
- Biological nitrogen fixation enhancement through agricultural biotechnology
- Recycling and efficiency improvements in fertiliser application and nitrogen management
- Synthetic biology applications for alternative nitrogen source development
Supply chain resilience strategies must balance carbon intensity optimisation with security of supply considerations, potentially requiring diversified sourcing approaches that prioritise both environmental and strategic objectives.
The interaction between climate policy and supply security creates complex trade-offs requiring careful policy design to achieve environmental objectives while maintaining essential commodity access for food production systems.
Based on current EU regulations and preliminary CBAM documents, the carbon border adjustment mechanism ammonia implementation schedule remains firm, though technical adjustments continue through stakeholder consultation processes.
Furthermore, recent analysis by S&P Global on CBAM implications suggests that ammonia producers must prepare for significant compliance costs that could reshape international trade patterns across the fertiliser industry.
This analysis is based on regulatory documents and market data available as of December 2025. Carbon border adjustment mechanism implementation remains subject to ongoing regulatory development and potential modifications based on operational experience and stakeholder feedback. Importers should consult current regulatory guidance and qualified compliance specialists for specific implementation requirements.
Ready to Capitalise on Critical Mineral Discoveries in Carbon-Constrained Markets?
As industries navigate complex regulatory frameworks like CBAM, the demand for critical minerals essential to clean energy transitions continues to surge. Discovery Alert's proprietary Discovery IQ model delivers instant notifications about significant ASX mineral discoveries, helping investors identify actionable opportunities in the evolving decarbonisation landscape ahead of the broader market. Begin your 30-day free trial today to position yourself strategically as carbon pricing mechanisms reshape global commodity markets and create new investment opportunities.