July 10, 2026
The Materials Economics Beneath Europe's EV Transition
The industrial transformation underway across Europe's automotive sector is frequently framed as a technology story. In reality, it is increasingly a commodities story. The shift from internal combustion to battery-electric powertrains has not simply changed what vehicles contain; it has fundamentally restructured the cost architecture of the companies that build them. Understanding this restructuring is the essential starting point for any serious analysis of how European automotive OEMs are managing EV material costs and demand in 2026 and beyond.
When big ASX news breaks, our subscribers know first
Why Battery Raw Materials Now Define OEM Profitability
For decades, European automakers operated within a cost framework anchored by steel, aluminium, and precision-engineered mechanical components. These were markets they understood deeply, with established pricing mechanisms, mature supplier relationships, and well-developed hedging tools. The pivot to battery-electric powertrains has introduced an entirely different category of cost exposure: electrochemical-grade feedstocks that price differently, source differently, and carry geopolitical risk profiles that no traditional automotive procurement team was originally built to handle.
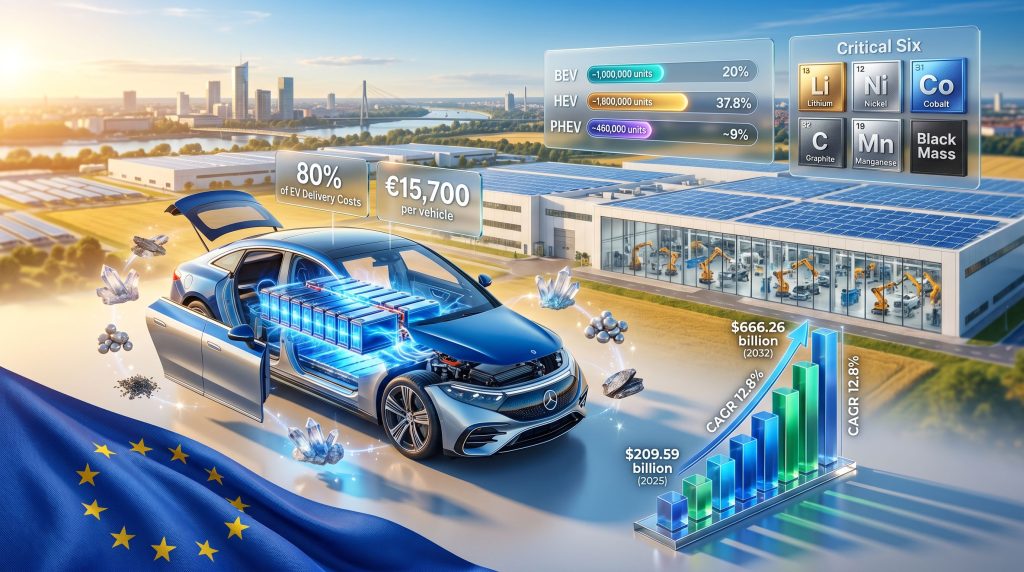
The numbers illustrate the scale of this shift. Materials now account for approximately 80% of total EV delivery costs, a proportion that would be unrecognisable to an ICE-era cost accountant. For a B-segment battery-electric vehicle, raw material costs average around €15,700 per unit, roughly 65% higher than the approximately €9,400 that equivalent ICE vehicles require. That gap is almost entirely attributable to one component: the battery pack.
Strikingly, when the battery is stripped from the comparison, EV platforms are actually around €4,585 cheaper to manufacture than their ICE counterparts. The vehicle architecture itself is not the problem. The electrochemical heart of the vehicle is. And that heart requires approximately six times more critical minerals than a conventional powertrain, amplifying exposure to commodity cycles that can be volatile, opaque, and heavily influenced by decisions made thousands of kilometres away from European factory floors. The battery raw materials market continues to evolve rapidly, adding further complexity to these procurement challenges.
The EV cost challenge confronting European OEMs is not an engineering problem waiting for a technical solution. It is a materials economics problem that demands commercial and strategic responses.
What the European EV Demand Picture Actually Looks Like in 2026
Registration Data and Market Share Realities
Demand data through the first five months of 2026 shows encouraging momentum. Close to one million new battery-electric vehicles were registered across the EU during this period, with BEVs capturing a 20% market share according to figures from the European Automobile Manufacturers Association (ACEA). Projections suggest this figure could approach 25% by the close of 2026 if current trajectories hold.
However, the headline number conceals important structural complexity. Hybrid-electric vehicles retained their position as the dominant powertrain category, commanding a 37.8% market share, while plug-in hybrids registered approximately 460,000 units in early 2026. The European EV market as a whole is projected to expand from approximately $209.59 billion in 2025 to $666.26 billion by 2032, representing a compound annual growth rate of 12.8%. Furthermore, critical minerals demand is expected to intensify significantly as these volumes scale.
| Powertrain Type | Early 2026 EU Registrations | Market Share | Battery Material Intensity |
|---|---|---|---|
| Battery Electric (BEV) | ~1,000,000 units | 20% | High — lithium, nickel, cobalt, graphite, manganese |
| Hybrid Electric (HEV) | ~1,800,000 units | 37.8% | Moderate — smaller packs, varied chemistries |
| Plug-In Hybrid (PHEV) | ~460,000 units | ~9% | Moderate-high — larger packs than standard HEV |
| ICE (including mild hybrid) | Remaining share | ~33% | Minimal battery material exposure |
Geographic Fragmentation and Its Procurement Consequences
The west-east divide within European EV adoption is more than a curiosity; it has direct implications for how OEMs structure their procurement and production planning. Western markets, led by Germany, France, the Netherlands, and the Nordic countries, are driving the bulk of BEV volume growth. Eastern European markets are expanding, but their growth profile is structurally different, with Chinese plug-in hybrid imports playing a disproportionately influential role.
This fragmentation dismantles the possibility of a single, uniform procurement assumption across European operations. OEMs must model battery material requirements at a granular level: by geography, vehicle segment, powertrain type, and chemistry. The simultaneous scaling of BEVs, HEVs, and PHEVs means procurement teams are managing exposure across multiple battery configurations at the same time, each with its own material intensity and supplier relationship requirements.
Which Battery Materials Are Creating the Greatest Cost Exposure
The Six Electrochemical Feedstocks at the Core of the Cost Problem
Six materials sit at the centre of battery cost exposure for European automotive OEMs: lithium, nickel, cobalt, graphite, manganese, and black mass. Each carries distinct pricing dynamics, supply chain characteristics, and geopolitical risk profiles. Copper and aluminium, while not battery-specific, have seen demand intensification from EV production growth, adding further complexity to an already challenging cost environment.
Lithium demand growth remains the most closely watched dynamic. While price volatility has moderated from its peak, structural uncertainty persists around how quickly upstream supply can rebalance against accelerating demand. A paradox underlies the current pricing environment: lower lithium prices support near-term OEM margins, but they simultaneously risk undermining the investment economics of upstream mining and refining projects, potentially creating future supply constraints at precisely the moment demand is scaling most aggressively.
The 70% Supply Dependency and Its Strategic Implications
More than 70% of EV batteries installed in European vehicles in 2024 were sourced from Asian manufacturers, with CATL, LG Energy Solution, and Panasonic representing the dominant producers. Cathode active material (CAM), which is the single most value-intensive component within a battery cell, is manufactured predominantly in China, where accumulated scale, infrastructure investment, and integrated supply chains create cost advantages that European producers cannot currently replicate.
Chinese EV manufacturers can produce comparable vehicles at costs approximately 20-30% lower than European automotive OEMs managing EV material costs and demand, and at approximately twice the production speed. This competitive gap is not primarily a labour cost story. It reflects the compounding advantage of integrated domestic supply chains, efficient CAM production, and battery manufacturing scale that took years to build and cannot be closed quickly. According to McKinsey's analysis of Europe's EV economic potential, addressing these structural disadvantages requires coordinated investment across the entire value chain.
European OEMs that defer investment in localised battery supply chains risk compounding their cost disadvantage as Chinese manufacturers accelerate their presence in European market segments.
European OEMs currently carry an estimated 13% battery cost disadvantage relative to more vertically integrated competitors. This gap is projected to narrow to approximately 9% by 2030 and 5% by 2040 as European gigafactory capacity scales, though achieving this trajectory requires sustained investment. Estimates suggest the EU needs approximately €42 billion per year in battery-related investment through 2030 to reach meaningful supply chain self-sufficiency.
Battery Chemistry Selection as a Financial Strategy
The chemistry decision in battery design has evolved from a predominantly engineering conversation into a commercial and financial one. Each chemistry profile presents a distinct trade-off between performance, cost stability, and supply chain risk.
| Chemistry | Energy Density | Cost Profile | Supply Chain Risk | Optimal Application |
|---|---|---|---|---|
| NMC (Nickel-Manganese-Cobalt) | High | Higher, volatile | Moderate-high | Premium EVs |
| NCA (Nickel-Cobalt-Aluminium) | Very High | High | High | Performance EVs |
| LFP (Lithium Iron Phosphate) | Moderate | Lower, more stable | Low-moderate (China IP dependency) | Mass-market EVs |
| LMFP (Lithium Manganese Iron Phosphate) | Moderate-High | Moderate | Emerging | Mid-range EVs |
Nickel-rich chemistries deliver the energy density that premium and performance EVs require, but they carry higher raw material costs and greater exposure to market volatility. LFP chemistries reduce that exposure and can improve per-unit economics for mass-market vehicles, but they remain heavily dependent on Chinese intellectual property for higher-performance applications, meaning adoption by European OEMs can substitute one form of supply chain dependency for another.
A hypothetical but instructive scenario: a European mass-market OEM producing 500,000 B-segment EVs annually transitions 60% of production from NMC to LFP chemistry by 2028. At an estimated battery pack cost reduction of 15-20% on LFP models, per-vehicle material savings could reach €1,500-€2,500. Across 300,000 units, this represents a potential annual cost saving of €450 million to €750 million, before accounting for LFP licensing costs tied to Chinese intellectual property. The financial case is compelling; the strategic dependencies require careful navigation.
In response, many OEMs are pursuing standardised cell-to-pack platform designs capable of accommodating multiple chemistries, preserving optionality as market conditions and material costs evolve.
The Recycling Dimension: Long-Term Strategic Asset, Not a Near-Term Fix
Battery recycling sits at an important but uncomfortable position in the EV cost conversation. Its long-term strategic value is well understood; its near-term utility as a cost management tool is frequently overstated. Indeed, battery recycling breakthroughs emerging from Asia are beginning to reframe what is commercially achievable, though European infrastructure remains significantly behind.
Incorporating recycled battery materials, particularly black mass, into production currently adds approximately €500 per B-segment EV at current European recycling scales. This cost premium reflects the immaturity of the recycling infrastructure rather than any fundamental economic flaw in the concept.
The structural challenges limiting near-term viability in Europe include:
-
Significant shredding overcapacity relative to the volume of end-of-life batteries currently available as feedstock
-
Hazardous waste regulations that restrict the movement of black mass across European borders, fragmenting what should be a continental-scale material flow
-
Commercial incentives that lead some European recyclers to export black mass to South Korean refiners rather than invest in more complex domestic refining capacity
The consequence is a recycling ecosystem that generates more shredding capacity than it can usefully deploy, while the most valuable processing steps continue to be performed outside Europe. For OEMs, the appropriate framing for recycled materials is as a long-term strategic input rather than an immediate cost hedge.
The next major ASX story will hit our subscribers first
Carbon Costs Add a Compounding Layer of Pressure
Battery raw material costs do not exist in isolation within European OEM cost structures. The EU Emissions Trading System (EU ETS) and the Carbon Border Adjustment Mechanism (CBAM) are progressively embedding carbon costs into the bill of materials for vehicles assembled in Europe. Europe's critical minerals supply chain is increasingly shaped by these regulatory pressures, adding another dimension to procurement complexity.
As EU ETS free allocations decline on their scheduled trajectory, carbon pricing transitions from an indirect consideration to a direct cost line item. Steel, aluminium, and increasingly battery inputs all carry embedded carbon costs that upstream suppliers will pass through to OEMs. CBAM extends this logic to imported materials, creating additional cost complexity for any OEM relying on non-European battery components or intermediate materials.
The operational implication is significant: battery materials and carbon compliance cannot be managed as separate workstreams. Effective cost management requires cross-functional integration across procurement, sustainability, and finance, using shared data frameworks that capture both material prices and embedded emissions content simultaneously. Transport & Environment's research on Europe's automotive industry at a crossroads underscores how these regulatory and competitive pressures are converging simultaneously for European OEMs.
The Procurement Intelligence Advantage
The shift from static annual contracting toward dynamic procurement models is one of the more consequential organisational changes underway across European automotive OEMs managing EV material costs and demand. Traditional approaches built on fixed price assumptions and annual renegotiation cycles are structurally misaligned with battery raw material markets that can reprice sharply within weeks.
Independent price benchmarks now serve three operationally distinct functions for European OEMs:
-
Validation — confirming whether supplier price claims reflect genuine market movements or represent inflated cost pass-through
-
Negotiation leverage — providing a defensible, third-party reference point during supplier discussions
-
Internal alignment — enabling procurement, finance, and sustainability functions to work from a shared and consistent cost framework
This benchmark logic, already well established in the context of carbon cost management under CBAM and EU ETS, is now being systematically extended to battery raw material procurement across the sector.
The Path to Cost Parity and What Determines the Timeline
Conservative industry estimates place EV-ICE production cost parity at approximately 2035; more optimistic projections suggest parity in specific vehicle segments and geographies could arrive as early as 2025-2026. The wide range between these scenarios is driven by the trajectory of battery raw material costs, the pace of European gigafactory ramp-up, and the speed at which supply chain localisation achieves meaningful scale.
Five structural pathways are available to European automotive OEMs managing EV material costs and demand to close the cost gap:
-
Gigafactory scaling and vertical integration — Building or co-investing in European battery cell manufacturing to reduce dependency on Asian suppliers
-
Chemistry diversification — Expanding into LFP and next-generation chemistries to reduce nickel and cobalt cost exposure
-
Supply chain localisation — Developing European CAM production capacity and securing long-term offtake agreements with domestic or allied-nation raw material producers
-
Recycling infrastructure investment — Treating black mass and recycled cathode material as a long-term strategic sourcing input
-
Data-driven procurement — Deploying independent price benchmarks, cost indices, and scenario-based forecasting tools to reduce margin leakage from opaque supplier pricing
The window for building structural cost advantages through these pathways is narrowing. Regulatory timelines are fixed, competitive pressure from lower-cost producers is intensifying, and consumer price sensitivity in mass-market EV segments is increasing. The OEMs that treat battery raw materials as a core commercial strategic asset, rather than a procurement line item, will be best positioned to compete in the next phase of the European EV transition.
Key Metrics: European OEM EV Cost and Demand Summary
| Metric | Figure |
|---|---|
| BEV market share (EU, Jan-May 2026) | 20% |
| HEV market share (EU, Jan-May 2026) | 37.8% |
| PHEV registrations (EU, early 2026) | ~460,000 units |
| B-segment EV material cost per vehicle | ~€15,700 |
| Equivalent ICE material cost per vehicle | ~€9,400 |
| Battery share of EV cost premium over ICE | 30-50% |
| Asian battery supply share of European EVs (2024) | >70% |
| European OEM battery cost disadvantage (2023) | ~13% |
| Projected disadvantage by 2030 | ~9% |
| Required EU annual battery investment through 2030 | ~€42 billion |
| European EV market projected CAGR (2025-2032) | 12.8% |
Disclaimer: Forward-looking projections, cost estimates, and market share forecasts referenced in this article are drawn from industry research and publicly available data. They are subject to material change based on commodity market conditions, regulatory developments, and competitive dynamics. This article does not constitute financial or investment advice.
Want To Track The Critical Mineral Discoveries Driving The EV Revolution?
Discovery Alert's proprietary Discovery IQ model delivers real-time alerts the moment significant ASX mineral discoveries are announced, instantly translating complex battery material data — lithium, nickel, cobalt, graphite, and more — into actionable investment insights for both traders and long-term investors. Explore Discovery Alert's discoveries page to understand the historic returns major mineral discoveries have generated, and begin a 14-day free trial to position yourself ahead of the market.