July 9, 2026
When the World's Energy Corridor Becomes a Pressure Valve
Global energy markets rarely respond to a single variable. The most significant price dislocations in oil history have consistently emerged from the collision of multiple stress factors arriving simultaneously, each amplifying the other in ways that neither would produce independently. That dynamic is playing out in full today, as Middle East supply risks and the US distillate deficit combine to create a pricing environment that is structurally more fragile than headline crude prices suggest.
Understanding this moment requires stepping back from the daily price moves and examining the architecture of the problem. Two entirely separate forces have converged at the worst possible time: a geopolitical disruption concentrated around the single most consequential maritime chokepoint in global energy logistics, and a pre-existing domestic inventory deficit in refined fuels that eliminates the market's traditional shock-absorption capacity.
The result is a market with an asymmetric risk profile that strongly favours upside price surprises over downside corrections. Furthermore, understanding the crude oil price drivers behind these dynamics helps frame just how unusual the current environment truly is.
When big ASX news breaks, our subscribers know first
The Strait of Hormuz: More Than a Geography Lesson
Why a Narrow Waterway Controls Global Energy Pricing
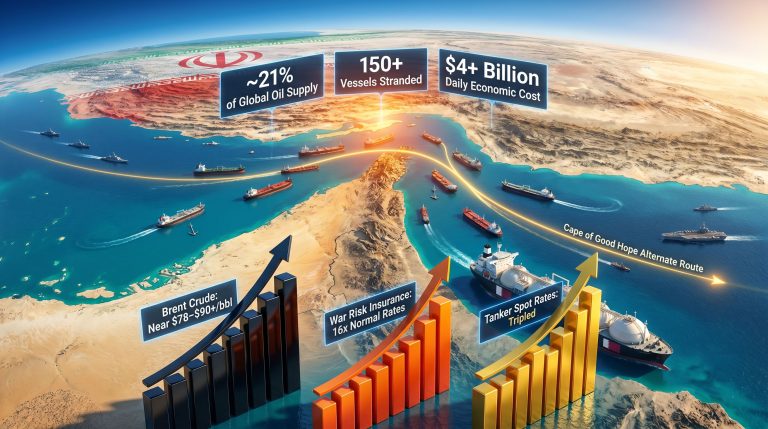
The Strait of Hormuz is not simply a geographic feature. It is the functional control valve through which approximately 20% of the world's crude oil and liquefied natural gas supply passes under normal operating conditions. That translates to between 16 and 18 million barrels per day of petroleum flow, representing the combined export capacity of Saudi Arabia, the UAE, Kuwait, Iraq, and Iran moving through a corridor that is, at its narrowest point, approximately 33 kilometres wide.
Iran's strategic leverage over this waterway is not incidental. It is the central pillar of Tehran's deterrence posture against Western military pressure, and any conflict scenario that activates this leverage immediately re-prices the global oil complex. The IEA's analysis of the Middle East and global energy markets highlights precisely why Hormuz disruptions carry such outsized consequences for prices worldwide.
The sequence of events that triggered the most recent volatility cycle is instructive:
- Commercial shipping attacks in and around the Strait prompted a US military response
- Iranian retaliatory strikes targeted infrastructure in Kuwait and Bahrain
- Brent crude surged 5.4% in its largest single-day gain since May 4
- WTI crude gained 4.4%, its biggest increase since June 1
- War underwriters issued advisories recommending that shipping companies pause Hormuz voyages
- Freight costs increased and near-term supply uncertainty became structurally elevated
Prices subsequently reversed as traders shifted from pricing the initial shock to assessing the probable duration of disruption. Brent fell $1.03, or 1.32%, to $76.99 per barrel, while WTI dropped $0.88, or 1.2%, to $72.64 per barrel. KCM Trade's chief market analyst Tim Waterer noted that expectations of de-escalation capped further gains after President Trump indicated Iran had sought renewed negotiations.
This price behaviour reveals something important about market psychology in geopolitical shock cycles. The initial spike reflects fear-based repricing of supply risk. The subsequent pullback reflects traders rationally discounting the probability of worst-case outcomes. Neither move fully captures the structural supply tightness that persists regardless of short-term diplomatic signals.
| Event Type | Immediate Price Impact | Sustained Duration |
|---|---|---|
| Initial geopolitical shock | Brent +5.4% (largest daily gain since May 4) | Hours to days |
| Shipping advisory and voyage pause | Freight cost increase plus risk premium | Days to weeks |
| Sustained transit disruption | Supply deficit pricing | Weeks to months |
| Iranian export infrastructure damage | Potential reduction of ~1.75 million b/d | Months |
| Near-total Hormuz closure (3-4 weeks) | JPMorgan estimates above $100/barrel | Extended disruption scenario |
The US Distillate Deficit: A Pre-Existing Wound
Inventory Data That Changes the Entire Price Equation
What makes the current geopolitical disruption unusually dangerous for fuel prices is not the disruption itself. It is the condition of US refined product inventories before the disruption arrived. The oil market's traditional defence against crude price spikes is its ability to draw down distillate and gasoline inventories, absorbing demand while supply normalises. That buffer has been progressively eroded over the preceding months.
The most recent EIA Weekly Petroleum Status Report confirmed the depth of the problem:
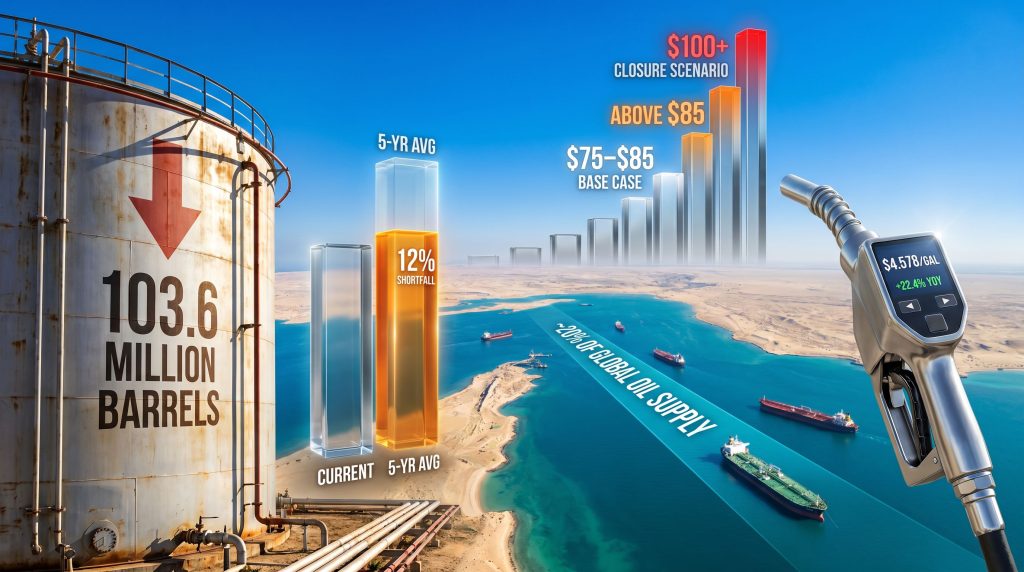
- 103.6 million barrels of total US distillate fuel inventories
- A single-week draw of 5.0 million barrels, one of the steepest in recent history
- Inventories sitting 12% below the five-year seasonal average
- Effective supply coverage of approximately 25 days of consumption
- The lowest inventory position recorded since 2016
A 12% deficit relative to the five-year seasonal average is not a routine fluctuation. It represents a structural supply gap that cannot be closed quickly given the refinery utilisation constraints currently operating across the US system.
Distillates are not a niche market segment. They represent the fuel backbone of the physical economy. Diesel powers freight trucks, agricultural machinery, construction equipment, and marine vessels. Heating oil serves residential and commercial heating demand across the northeastern United States. Jet fuel underpins the aviation sector. When distillate inventories run this far below seasonal norms, the entire supply chain for goods and services faces elevated cost pressure.
Gasoline Inventories Confirm the Problem Is Systemic
The distillate deficit does not exist in isolation. In the same reporting period, gasoline inventories fell a further 1.9 million barrels, leaving stocks 6% below the five-year seasonal average. While the distillate deficit is more severe, the gasoline deficit confirms that refined product market stress is broad-based rather than isolated to a single fuel category.
When both major refined product categories simultaneously show below-average inventory positions, the market loses multiple layers of its normal price-stabilisation architecture at once. In addition, the LNG supply outlook signals that broader energy tightness is not confined to crude alone.
Why Refineries Cannot Simply Produce Their Way Out of the Deficit
The 95.8% Utilisation Ceiling
A natural question arises from the inventory deficit data. If distillate stocks are critically low, why can't US refineries simply increase production to rebuild them? The answer lies in a single figure: 95.8% refinery utilisation.
US refineries are already operating at near-maximum throughput. At this utilisation level, the physical and operational constraints of the refinery system leave minimal headroom for incremental output increases. Average distillate production currently runs at approximately 5.2 million barrels per day, a rate that is insufficient to rebuild inventories while simultaneously meeting current consumption demand.
What makes the 95.8% figure particularly significant is the non-linear cost structure of marginal throughput increases at high utilisation rates. Beyond approximately 95% utilisation, each additional percentage point of throughput:
- Increases maintenance risk and unplanned outage probability
- Raises the marginal cost of additional crude processing
- Reduces operational flexibility to adjust yield slates toward higher-distillate configurations
- Compresses the system's ability to respond to demand spikes
In practical terms, there is no near-term production fix for the distillate deficit. Inventory rebuilding will require either a sustained period of demand destruction or a meaningful reduction in crude feedstock costs that incentivises additional refinery investments, neither of which resolves quickly.
The Russia Diesel Export Ban: Removing the Secondary Safety Net
A less widely discussed but analytically significant development compounding the distillate situation is Russia's temporary ban on diesel exports. Ukrainian drone strikes disrupted Russian refinery operations, prompting Moscow to restrict diesel exports in response to domestic supply concerns.
This matters for the US market in a way that is not immediately obvious. Russian diesel exports historically serve as a secondary balancing mechanism for global distillate markets. When Atlantic Basin refiners face tight domestic supply conditions, arbitrage flows from Russia to European markets reduce the indirect pressure on US stocks. With Russian diesel exports suspended:
- European distillate markets tighten independently
- Atlantic Basin arbitrage opportunities that might otherwise relieve US inventory pressure are reduced
- The global distillate supply system loses a key counterbalancing mechanism precisely when it is most needed
This is the operational meaning of compounding supply shocks. Each individual factor is manageable. Together, they close every available relief valve simultaneously.
Retail Fuel Prices: Where Abstract Market Data Becomes Concrete
The Consumer-Facing Cost of Structural Supply Tightness
Wholesale inventory data and crude price benchmarks eventually translate into prices paid at the pump and loading dock. The year-over-year comparisons in current US retail fuel pricing quantify what Middle East supply risks and the US distillate deficit are costing consumers and businesses in direct terms.
| Fuel Category | Current Price | Year-Over-Year Change |
|---|---|---|
| On-highway diesel | $4.578/gallon | +$0.839 (+22.4%) |
| Regular gasoline | $3.777/gallon | +$0.652 (+20.8%) |
The $0.801 per gallon premium that diesel commands over regular gasoline at retail is a direct expression of the disproportionate tightness in distillate markets relative to gasoline. Crack spreads, the margin refiners earn from converting crude oil into distillate products, have reached historically elevated levels, confirming extreme demand pressure relative to available supply.
For freight-dependent industries, a sustained diesel price at $4.578 per gallon represents a significant cost increase that cannot be absorbed without either margin compression or pass-through price increases to end consumers. The inflationary transmission from fuel markets into broader consumer prices operates through precisely this channel. Monitoring the current crude oil prices alongside retail fuel data provides a clearer picture of how upstream pressures filter through to end users.
Scenario Forecasting: How Goldman Sachs and WisdomTree Are Framing Price Risk
Three Pathways for Oil Prices Over the Coming Months
Major institutional forecasters have converged on a scenario-based analytical framework that ties near-term price outcomes directly to the diplomatic and operational resolution of the Hormuz disruption. However, the oil price trade war impact adds a further layer of complexity that analysts are factoring into their projections.
Goldman Sachs Base Case:
Goldman Sachs' baseline assumptions require continued US-Iran negotiations, reinstatement of Iranian oil sanctions waivers, and restoration of shipping security through the Strait. Under this scenario, Hormuz flows would normalise by end-July, requiring an increase of 6.6 million barrels per day of additional throughput. The current four-week average US crude import rate of 5.4 million barrels per day sits 11.4% below year-ago levels, illustrating how far the system needs to recover to meet this target. Goldman Sachs has specifically identified failed negotiations, additional tanker attacks, or a US blockade of Iranian oil exports as the primary scenarios capable of preventing this normalisation timeline.
WisdomTree Base Case:
WisdomTree's analysis points to a Brent trading range of $75 to $85 per barrel over the near term, conditional on supply recovery continuing, diplomatic engagement persisting, and the market remaining sensitive to disruption risks without experiencing a further escalation event.
Upside Risk Scenarios:
| Scenario | Potential Brent Outcome |
|---|---|
| Failed US-Iran negotiations | Above $85/barrel |
| US blockade of Iranian oil exports | Above $85/barrel |
| Sustained tanker attacks without resolution | $90-$100/barrel range |
| Iranian export infrastructure damage | Potential peak above $90/barrel |
| Near-total Hormuz closure lasting 3-4 weeks | JPMorgan estimates above $100/barrel |
When the base case range sits at $75 to $85 and the upside scenarios extend to $100, the asymmetry of the risk distribution becomes the most important fact for investors and fuel-cost-exposed businesses to internalise. Indeed, analysts at Crux Investor note that even peace deal optimism cutting Brent to $88 cannot eliminate the higher oil price risk embedded in a 13% US distillate deficit.
The next major ASX story will hit our subscribers first
The Compounding Mechanism: Why Simultaneous Shocks Produce Non-Linear Outcomes
How Two Separate Problems Multiply Into One Larger Problem
The analytical core of the current market environment is not that either factor, Middle East supply disruption or domestic inventory deficit, is unprecedented on its own. Both have occurred separately before. What is unusual is their precise timing overlap, which activates a compounding mechanism that produces price outcomes larger than either would generate independently.
The transmission chain works as follows:
- Crude supply disruption through Hormuz triggers Brent price spike and increased feedstock costs for refiners
- Refinery utilisation already at 95.8% prevents any capacity to increase distillate output in response
- Distillate inventories sitting 12% below the five-year average eliminate the inventory buffer that would normally absorb demand
- Russia's diesel export ban removes the secondary global supply relief mechanism
- The result is diesel and heating oil bearing disproportionate upward price pressure relative to crude itself
This chain explains why on-highway diesel has risen 22.4% year-over-year while the crude price increase over the same period is considerably smaller. Refined product markets are amplifying the upstream signal through their own structural constraints. Furthermore, the OPEC market influence on production decisions could either accelerate or moderate this dynamic depending on how member nations respond to the disruption.
Macroeconomic Consequences Beyond the Fuel Sector
Elevated distillate prices carry economic consequences that extend well beyond the energy sector. The primary transmission pathways into the broader economy include:
- Freight and logistics costs: Diesel-dependent trucking, rail, and maritime shipping embed fuel surcharges throughout supply chains, effectively taxing every physical good that moves
- Agricultural input costs: Farming equipment, irrigation systems, fertiliser production, and food distribution all carry significant diesel exposure, creating food price inflation risk
- Industrial manufacturing: Energy-intensive sectors face direct margin compression when distillate prices remain elevated for extended periods
- Consumer discretionary spending: Higher pump prices reduce household disposable income, dampening consumption in non-fuel categories
Analysts estimate that a sustained quarter of elevated diesel prices at current levels could produce approximately a 0.3% reduction in real GDP through the accumulation of these transmission channels. While this figure may appear modest, it compounds over successive quarters and disproportionately affects lower-income households where fuel costs represent a higher share of total income.
Key Monitoring Thresholds for Near-Term Price Direction
The Data Signals That Will Confirm or Contradict the Base Case
The EIA Weekly Petroleum Status Report, published every Wednesday, serves as the primary data mechanism through which the market will evaluate whether supply conditions are tightening or recovering. Market participants tracking the Middle East supply risks and US distillate deficit interaction should monitor the following thresholds:
| Metric | Current Level | Normalisation Target | Gap |
|---|---|---|---|
| Four-week average US crude imports | 5.4 million b/d | 6.6 million b/d | -1.2 million b/d |
| US distillate inventories | 103.6 million barrels | ~117.7 million barrels (5-yr avg) | -14.1 million barrels |
| Refinery utilisation | 95.8% | Operational ceiling (~97%) | Minimal headroom |
Bullish price catalysts to watch:
- A second consecutive distillate inventory draw exceeding 3.0 million barrels
- Breakdown in US-Iran diplomatic negotiations
- Additional commercial vessel attacks in or near the Strait of Hormuz
- Evidence of damage to Iranian export infrastructure
Bearish price catalysts to watch:
- Crude import recovery trending toward 6.6 million barrels per day
- Formal Hormuz ceasefire or renewed sanctions waiver agreement
- Resumption of war underwriter approvals for Hormuz transit
- Emergency OPEC+ production response to fill the supply gap
A second consecutive distillate draw above 3.0 million barrels would deepen the existing 103.6 million barrel deficit and materially increase the probability of Brent breaching WisdomTree's $85 upper bound, particularly if Hormuz normalisation progress stalls simultaneously.
The intersection of Middle East supply risks and the US distillate deficit has created an oil market where the downside scenarios are limited and the upside scenarios are numerous. Until either the geopolitical situation resolves toward the Goldman Sachs base case timeline or US distillate inventories begin a sustained recovery trajectory confirmed across multiple consecutive EIA reports, the structural case for elevated energy prices remains intact.
This article contains forward-looking analysis and scenario projections drawn from institutional research. All price forecasts, supply estimates, and economic impact assessments represent analytical scenarios and not guaranteed outcomes. Energy markets are subject to rapid change based on geopolitical developments, policy decisions, and supply variables that may differ materially from any base case assumptions. Readers should conduct their own due diligence before making investment or business decisions based on energy price forecasts.
Want to Capitalise on Energy Market Volatility Before It Moves the ASX?
When structural supply shocks collide with geopolitical disruption, the ripple effects reach deep into ASX-listed energy and resources companies — and Discovery Alert's proprietary Discovery IQ model scans ASX announcements in real time, instantly identifying significant mineral and energy discoveries so subscribers can act before the broader market catches on. Explore historic discovery returns on Discovery Alert's dedicated discoveries page and begin your 14-day free trial today to position yourself ahead of the next major market move.