May 21, 2026
Why Gold Equity Pricing Is More Psychology Than Physics
Every few years, a pattern repeats itself across commodity markets with almost mechanical reliability. A metal climbs to extraordinary highs, equity markets re-rate the producers that extract it, and then a correction arrives, not because the underlying business has deteriorated, but because the commodity price has retreated from levels that were themselves extraordinary. Investors who understand this cycle can use it to their advantage. Those who conflate share price weakness with business deterioration often make costly decisions in either direction.
This dynamic is precisely what is playing out right now with Evolution Mining (ASX: EVN), one of Australia's largest gold producers. A ~36% decline from an all-time high of approximately A$17.67 reached in early March 2026 has brought the share price to around A$11.32, including a single-session drop of approximately 5.3% as gold softened below US$4,500 per ounce. For investors asking whether this is a genuine Evolution Mining buy the dip opportunity or a value trap, the answer depends almost entirely on how clearly you can separate the business from the commodity it sells.
When big ASX news breaks, our subscribers know first
The Mechanics of Operating Leverage: Why Gold Miners Move Harder Than Gold
Understanding why EVN fell roughly twice as hard as gold itself requires a working knowledge of operating leverage, one of the most important and least understood concepts in mining equity analysis. Furthermore, how gold price movements affect mining equities is a subject that rewards careful study before committing capital.
A gold miner's costs are largely fixed or semi-fixed in the short term. Labour contracts, energy costs, equipment maintenance, and site overhead do not adjust in real time when spot prices move. This means that when gold prices rise, nearly all of the incremental revenue flows directly into profit. Conversely, when prices fall, the reverse applies with equal force.
Consider a simplified illustration:
| Gold Price Scenario | Revenue per Ounce | AISC per Ounce | Margin per Ounce | Change in Margin |
|---|---|---|---|---|
| A$3,500/oz | A$3,500 | A$2,220 | A$1,280 | Baseline |
| A$3,850/oz (+10%) | A$3,850 | A$2,220 | A$1,630 | +27% |
| A$3,150/oz (-10%) | A$3,150 | A$2,220 | A$930 | -27% |
This is why a 10% movement in gold can translate into a 25% to 40% swing in a producer's per-ounce profitability. Share markets anticipate this dynamic and price it forward, which is why EVN's equity declined far more sharply than the metal itself. This is not a flaw in the market's logic. It is the market correctly repricing leveraged exposure to a lower commodity input.
What High-Beta Actually Means in Practice
The term high-beta is used frequently but understood imprecisely. In the context of gold equities, beta measures how aggressively a stock responds to movements in its underlying commodity driver. For a producer like EVN, the relationship is not symmetric in the way many investors assume.
Beta behaviour across gold price scenarios:
| Scenario | Gold Price Move | Typical High-Beta Miner Response |
|---|---|---|
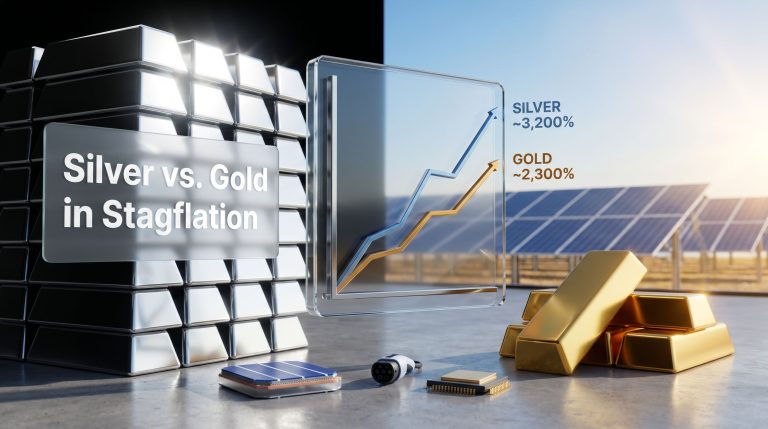
| Strong gold bull run | +20% | +40% to +60% |
| Moderate gold correction | -10% | -20% to -30% |
| Sharp gold selloff | -20% | -35% to -50% |
| Gold consolidation (flat) | 0% | -5% to +5% (range-bound) |
This asymmetry exists partly because of market sentiment amplification. When gold falls, investors do not merely reprice the miner's current earnings; they also discount the probability of future earnings at a lower forward gold price, apply higher risk premiums to cyclical names, and trigger systematic selling by momentum and quantitative strategies. The result is a compounding effect that goes beyond what pure operating leverage alone would explain.
The critical distinction for investors is this: high-beta behaviour is a structural feature of leveraged commodity exposure, not a signal that the business has changed. Confusing the two is one of the most common and costly errors in resource stock investing.
Mapping the Decline: What the Numbers Actually Reveal
EVN's trajectory over the past 12 months tells a more nuanced story than the headlines suggest. The stock is still approximately 40% higher on a 12-month trailing basis, even after the pullback from its March 2026 peak. That context is critical when evaluating whether current levels represent genuine value or simply a partial reversal of an exceptional re-rating cycle.
The Selloff Was Macro-Driven, Not Company-Specific
The gold price retreat below US$4,500 per ounce was attributable to two converging macro forces:
-
Shifting US interest rate expectations: Markets began pricing in a more cautious Federal Reserve path, reducing the opportunity cost argument that had supported gold's record run.
-
Reduced geopolitical risk premium: A partial easing of global tensions deflated some of the safe-haven demand that had driven gold to extraordinary levels earlier in the year. Investors interested in the broader case for gold as a safe haven will find these macro dynamics particularly relevant.
Critically, no company-specific negative announcements accompanied EVN's share price weakness. There were no production misses, no cost blowouts, no balance sheet concerns, and no management changes that could explain the decline from a business fundamentals perspective. The selloff was a commodity repricing event, with EVN's high-beta characteristics amplifying the impact on its equity price.
A stock that falls 36% from its peak but remains 40% above where it traded 12 months earlier is not necessarily cheap. It may simply be less expensive than it was at peak exuberance.
Evolution Mining's Operating Fundamentals: Reading Past the Price Signal
Quarterly Production and Cost Performance
While the share price has corrected sharply, the underlying operational metrics tell a different story entirely. According to Evolution Mining's quarterly earnings results, the most recent quarterly results delivered the following:
| Metric | Reported Figure |
|---|---|
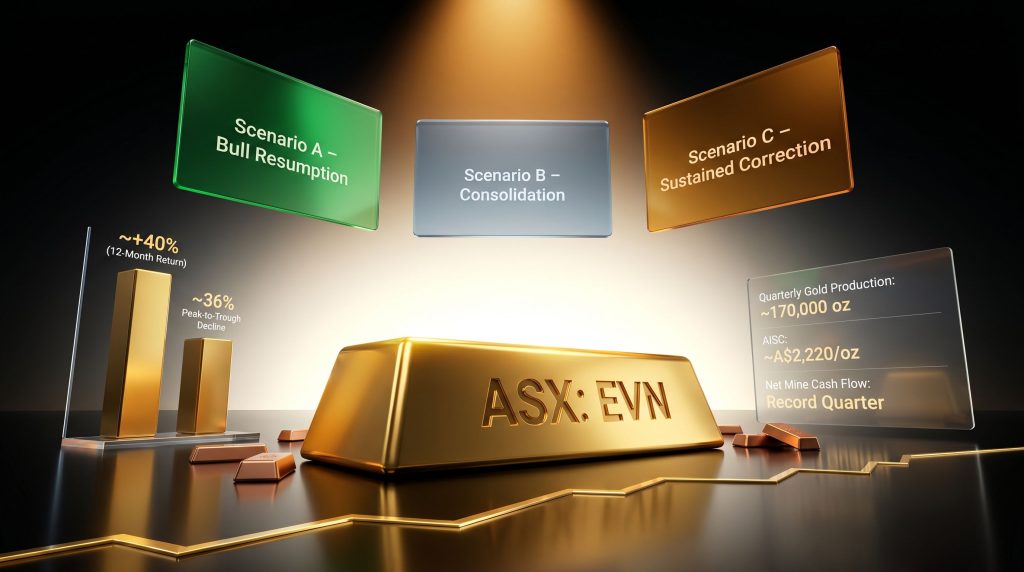
| Quarterly Gold Production | ~170,000 oz |
| Quarterly Copper Production | ~11,000 tonnes |
| All-In Sustaining Cost (AISC) | ~A$2,220/oz |
| Net Mine Cash Flow | Record quarter |
| Share Price Decline from Peak | ~36% |
| 12-Month Share Price Return | ~+40% |
With gold trading materially above the A$2,220 per ounce AISC, the company is generating a meaningful margin on every ounce it pulls from the ground. The record net mine cash flow result in the most recent quarter is particularly significant because it reflects actual dollars generated after all sustaining capital requirements are met, not an accounting construct.
The Dual Commodity Exposure Dimension
A less-discussed but strategically important aspect of Evolution's production profile is its meaningful copper output, approximately 11,000 tonnes per quarter. This dual commodity exposure provides a partial natural hedge against single-commodity price risk that pure-play gold miners do not have.
Copper is increasingly driven by industrial demand tied to energy transition infrastructure, including electrical wiring, EV components, and renewable energy systems. When gold weakens on a risk-off sentiment shift, copper sometimes moves independently based on industrial demand signals. For a producer with material copper revenue, this diversification reduces earnings volatility at the margin, even if gold remains the dominant price driver.
Reserve Life and Long-Term Production Pipeline
Evolution's recently updated Mineral Resources and Ore Reserves Statement indicates a healthy long-term production base. In mining equity analysis, reserve life is a foundational valuation input that many retail investors overlook. Here is why it matters:
-
A miner with declining reserves is a depleting asset. Its intrinsic value falls over time regardless of commodity price.
-
A miner with stable or growing reserves is a self-renewing production platform. Its intrinsic value is sustained or enhanced as new reserves replace mined material.
-
Reserve grade, not just reserve size, determines the economic quality of future production. Higher-grade reserves generate more ounces per tonne processed, reducing unit costs.
The reserve update provides confidence that the production pipeline underpinning EVN's cash flow generation is not at risk of near-term exhaustion, which is a non-trivial consideration when evaluating whether current margins can be sustained.
The Valuation Question: Cheap, Fair, or Still Expensive?
The Analyst Consensus Puzzle
Prior to the recent correction, available market data suggested that EVN had been trading around A$13, while consensus analyst price targets were clustered closer to A$10.50. This is an unusual situation that deserves careful analysis, as it implies the market had already priced in a significant portion of the fundamental improvement story before the correction began. Reviewing current analyst price targets for EVN can provide additional context on how broker expectations have shifted alongside the commodity.
The re-rating of EVN from a turnaround candidate to a cash-flow compounder is a journey the stock largely completed during 2024 and 2025. During that period, the stock reportedly surged more than 130% in a compressed timeframe as the market repriced its earnings quality, balance sheet strength, and operational execution. The key question now is: how much of that repricing remains justified at current gold price assumptions, and how much was driven by sentiment that has since partially unwound?
A share price that has declined 36% from its peak but remains well above where fundamental re-rating began is not the same as a stock trading at a discount to intrinsic value. Investors must distinguish between a price correction and fundamental undervaluation. These are not the same thing.
A Five-Step Framework for Assessing Whether EVN Is Genuinely Cheap
Rather than relying on momentum or peak-price anchoring, investors can apply a disciplined valuation framework. In addition, understanding the broader gold price outlook for miners is essential context for any of these steps:
-
Establish a normalised gold price assumption based on long-run supply and demand fundamentals, not the current spot price or the recent high.
-
Apply that normalised price against EVN's AISC to derive a sustainable per-ounce margin estimate that reflects a full commodity cycle rather than a peak moment.
-
Capitalise that sustainable margin against production volumes to generate a rough earnings proxy across a range of gold price scenarios.
-
Compare the resulting implied valuation to current market capitalisation to determine whether the stock trades at a premium, discount, or fair value relative to normalised earnings.
-
Stress-test the output against a bear-case gold scenario to understand the downside exposure if the commodity continues to retreat.
Applying this kind of framework is more intellectually honest than comparing today's price to the March 2026 peak and declaring it cheap on a percentage-decline basis.
Three Macro Scenarios and Their Implications for EVN
Scenario A: Gold Resumes Its Structural Bull Run
Conditions required: The US Federal Reserve pivots to rate cuts, geopolitical risk re-escalates, or a meaningful weakening of the US dollar resumes. Central bank gold demand, which has been a structural support for gold prices over recent years, continues at elevated volumes.
EVN implication: High-beta amplification means the stock could recover sharply and potentially challenge prior highs. Investors who built positions during the pullback would benefit most from this outcome. The operating leverage analysis above shows how dramatically per-ounce margins expand if gold pushes back above prior highs.
Risk level for new buyers: Moderate.
Scenario B: Gold Enters a Prolonged Consolidation Phase
Conditions: Rates remain elevated but stable, geopolitical tensions plateau without major escalation, and no new macro catalyst emerges to push gold decisively in either direction.
EVN implication: The share price is likely to trade in a range. Cash flow generation continues at healthy levels given the AISC buffer, but the re-rating catalyst that drove the prior surge is absent. This is actually a reasonable environment for EVN's business, even if the share price excitement is limited.
Risk level for new buyers: Low to moderate.
Scenario C: Gold Enters a Sustained Correction
Conditions: Aggressive rate increases resume in major economies, broader risk appetite returns strongly to growth equities, and safe-haven demand collapses as investors rotate away from defensive assets.
EVN implication: The high-beta structure accelerates the downside. The AISC buffer provides a fundamental floor on the business (the company remains profitable until gold falls toward A$2,220 per ounce), but it does not prevent further share price erosion driven by sentiment and forward earnings downgrades.
Risk level for new buyers: High.
| Scenario | Gold Trajectory | EVN Share Price Outlook | Risk Level for New Buyers |
|---|---|---|---|
| A: Bull Resumption | Rising | Strong recovery potential | Moderate |
| B: Consolidation | Flat/sideways | Range-bound, cash flow supported | Low-Moderate |
| C: Sustained Correction | Falling | Further downside likely | High |
The next major ASX story will hit our subscribers first
Matching EVN to Investor Profile: Who Should Consider Acting?
Investors for Whom a Dip Entry May Be Appropriate
-
Long-term commodity bulls with a multi-year gold price thesis grounded in structural demand factors such as central bank accumulation, de-dollarisation trends, or persistent fiscal deficits in major economies.
-
Investors comfortable with high-beta volatility and the cyclical drawdowns that are an inherent feature of leveraged commodity exposure.
-
Those who have not yet established an EVN position and are therefore entering at a meaningfully lower cost basis than investors who chased the March 2026 highs.
-
Portfolio builders seeking ASX gold exposure with an operational track record, without taking on the exploration-stage risk present in junior miners. Furthermore, those interested in undervalued mining stocks may find the current EVN setup worth comparing against other opportunities in the sector.
Investors for Whom Caution Is Warranted
-
Those seeking capital stability or predictable income streams, as EVN's dividend profile is secondary to its commodity price sensitivity.
-
Investors who cannot confidently distinguish between a commodity price correction and genuine business deterioration. Both produce falling share prices but require entirely different responses.
-
Those attempting to time the precise bottom of a commodity cycle, which historical evidence consistently shows is an unreliable strategy even for professional investors.
-
Value-focused investors who believe EVN may still be trading above normalised fundamental value even after the pullback, particularly if they use a conservative long-run gold price assumption.
Before entering any high-beta gold miner, two questions deserve honest answers: Do you have a well-reasoned view on where gold trades over the next 12 to 24 months? And are you genuinely prepared to hold through further drawdowns if that view takes time to materialise? If either answer is uncertain, waiting for price stabilisation may be the more rational path.
The Staged Accumulation Approach
For investors who find the binary buy-or-avoid framing unsatisfying, a staged entry strategy offers a middle path. Rather than committing a full position at current levels, this approach involves:
-
Initiating a smaller-than-full position now, accepting current uncertainty in exchange for partial exposure to a potential recovery.
-
Identifying pre-defined price levels at which additional tranches would be added, reducing the average cost basis if the stock continues to fall.
-
Setting commodity-linked triggers that define the gold price conditions under which a full position would be justified.
-
Using the AISC as a valuation anchor. As long as gold trades well above A$2,220 per ounce, the margin buffer is intact, and position sizing decisions can be informed by how much of that buffer remains.
Frequently Asked Questions
What Caused EVN's ~36% Decline from Its Peak?
The primary driver was a retreat in the gold spot price below US$4,500 per ounce, reflecting shifting US interest rate expectations and reduced geopolitical risk premium. No company-specific negative events triggered the selloff.
Is Evolution Mining Still Profitable Despite Falling Share Prices?
Yes. With an AISC of approximately A$2,220 per ounce and gold trading materially above that level, Evolution continues to generate positive per-ounce margins. The most recent quarterly period delivered record net mine cash flows.
What Does AISC Measure and Why Does It Matter?
All-in sustaining cost is the most comprehensive measure of what it costs a producer to mine one ounce of gold, including direct mining costs, sustaining capital, corporate overhead, and royalties. It represents the effective price floor below which a mine becomes unprofitable on a fully-loaded basis.
Why Does EVN Fall Harder Than Gold During Corrections?
Operating leverage means that a fixed cost base causes proportionally larger swings in profitability when revenue changes. When this is combined with the market's forward-pricing of future earnings at lower gold prices, plus sentiment-driven selling, the result is amplified share price movements relative to the metal itself.
What Analyst Price Targets Exist for EVN?
Prior to the recent correction, available market data indicated consensus targets around A$10.50, while the stock had been trading above A$13. Investors should consult current broker research for updated figures, as targets shift materially with changes in gold price assumptions.
Separating the Business from the Bet
When every operational metric is performing well, a falling share price in a gold miner is almost always communicating one thing: the market's revised view on the commodity. For Evolution Mining, the most recent quarter produced record net mine cash flows, copper co-production added revenue diversification, and the updated reserve statement confirmed long-term production continuity. None of that has changed.
What has changed is gold's price, and through the mechanism of operating leverage and high-beta amplification, that change has reduced EVN's share price by roughly 36% from its peak. The stock remains approximately 40% higher than it was 12 months ago, which is a critical piece of context that the dip-buying narrative frequently omits.
The intellectually honest framing for anyone evaluating an Evolution Mining buy the dip decision is straightforward: the business is demonstrably healthy, but the near-term share price is almost entirely a function of where gold trades next. Investors with a clear, evidence-based commodity thesis and the psychological resilience to hold through further volatility may find current levels more attractive than the March highs. However, investors who lack either of those qualities would be better served waiting until gold's direction becomes clearer before committing capital to one of the ASX's most leveraged plays on the metal.
This article is intended for general informational purposes only and does not constitute financial advice. Past performance is not indicative of future results. Investors should conduct their own research and seek independent financial advice before making investment decisions. All figures cited reflect available data at the time of writing and are subject to change.
Want To Stay Ahead Of The Next Major ASX Mineral Discovery?
Discovery Alert's proprietary Discovery IQ model delivers real-time alerts on significant ASX mineral discoveries, instantly translating complex data into actionable opportunities for both short-term traders and long-term investors — start your 14-day free trial today and gain a market-leading edge, or explore Discovery Alert's dedicated discoveries page to understand how historic finds have generated extraordinary returns.