July 15, 2026
When Cash Generation Becomes the Story: A New Chapter for ASX Gold Producers
The gold mining industry has long operated on a fundamental paradox: the assets that generate the most geological value are often the same ones that consume the most capital. For decades, mid-tier producers navigated a difficult tightrope between production growth, debt management, and shareholder returns. Sustained periods of elevated spot gold prices were frequently absorbed by hedging obligations, cost blowouts, or aggressive acquisition programs that left balance sheets stretched. The result was a sector that produced gold in abundance but struggled to convert that output into durable financial strength.
That dynamic is shifting. The combination of elevated commodity prices, maturing asset portfolios, and disciplined capital allocation is allowing a select group of producers to cross a threshold that was genuinely rare a decade ago: generating cash faster than they can deploy it. For Evolution Mining Ltd (ASX: EVN), FY26 represents precisely that moment, and the Evolution Mining record cash flow carries implications that extend well beyond a single reporting period.
When big ASX news breaks, our subscribers know first
Understanding the Financial Architecture Behind Evolution Mining's Record Cash Flow
The Numbers That Define a Structural Shift
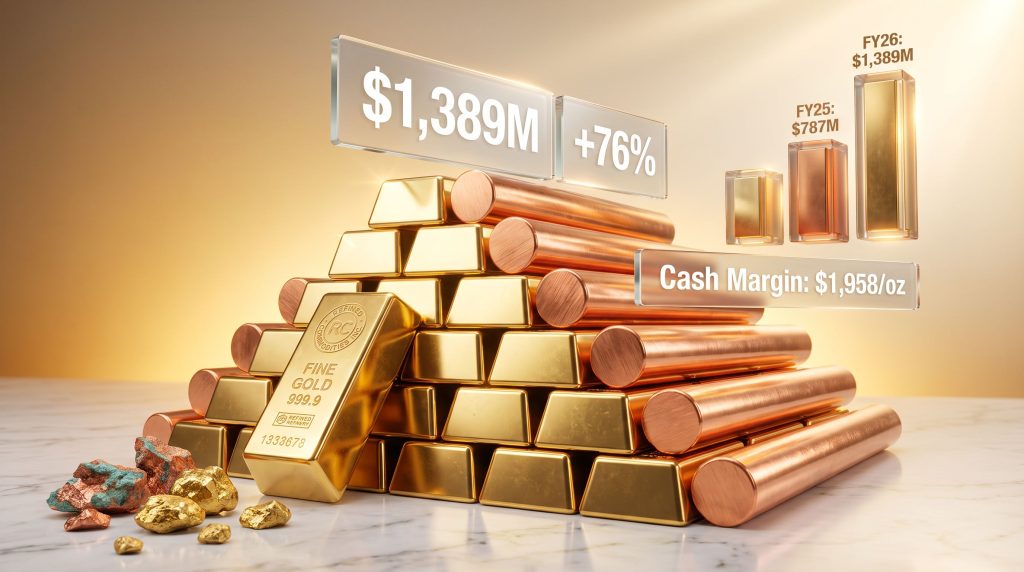
Evolution Mining's FY26 results mark a clear departure from the operational recovery narrative that characterised the prior two years. The company's Evolution Mining record cash flow of $1,389 million for the full year represents a 76% increase over the FY25 result of $787 million, and the underlying mechanics of that expansion reveal something important: this was not simply a gold price windfall. Furthermore, understanding the relationship between gold price and mining equities helps contextualise just how exceptional this result truly is.
| Metric | FY26 Result | FY25 Comparison | Change |
|---|---|---|---|
| Group Cash Flow | $1,389M | $787M | +76% |
| Operating Mine Cash Flow | $3,394M | $2,288M | +48% |
| Net Mine Cash Flow | $2,079M | N/A | Record |
| Cash Balance (30 June 2026) | $1,347M | $967M (Dec 2025) | +39% |
| Interim Dividend Paid | $406M | N/A | Record |
| Full-Year AISC | $1,717/oz | N/A | Sector-leading |
| Cash Margin | $1,958/oz | ~$1,051/oz (FY25) | +86% |
The cash margin expansion from approximately $1,051 per ounce in FY25 to $1,958 per ounce in FY26 is the single most revealing figure in this dataset. It reflects a compounding effect that investors in capital-intensive industries rarely get to observe in real time: a producer simultaneously improving its cost position, increasing throughput, and benefiting from higher commodity prices. Each lever reinforces the others.
The cash margin of $1,958/oz is not just a function of gold prices sitting above $3,600/oz during parts of FY26. It is the product of AISC discipline maintained at $1,717/oz across a diversified five-asset portfolio, a result that places Evolution Mining within the top quartile of ASX-listed gold producers on a cost-per-ounce basis.
Why Net Cash Status Is Rare in This Industry
Achieving a net cash position is not a routine outcome for mid-to-large gold producers. The capital requirements of underground development, processing infrastructure, and exploration programs routinely absorb free cash flow for years at a time. Evolution Mining's cash balance of $1,347 million as of 30 June 2026, combined with no debt repayments due until FY29, places the company in an unusually strong liquidity position.
This balance sheet configuration has strategic significance beyond financial ratios. It eliminates the coercive pressure that debt service obligations place on operational decision-making. Management can consequently choose to increase exploration spend, accelerate project development, or return capital to shareholders based on strategic merit rather than liquidity necessity.
Production Performance: Gold and Copper as Complementary Revenue Pillars
FY26 Output in Context
- Full-year gold production: 715,000 ounces
- Full-year copper production: 66,000 tonnes
- June quarter gold output: 180,000 oz at AISC of $1,706/oz
- June quarter copper output: 19,000 tonnes
- Quarter-on-quarter AISC improvement in the June quarter: 23%
The June quarter improvement of 23% in AISC is worth examining closely. AISC reductions of this magnitude within a single quarter typically reflect one or more of the following: higher ore grades processed, increased mill throughput, reduced contractor costs, or improved by-product credits. In Evolution's case, the copper contribution from Ernest Henry functions as a natural cost offset, since copper revenue is netted against gold production costs when calculating gold AISC. When copper prices are elevated, the effective gold AISC reported by Evolution Mining is structurally lower than it would be for a pure-play gold producer with identical operating costs.
AISC Benchmarking Across the ASX Gold Sector
| Producer Type | Typical AISC Range (FY26 Est.) | Evolution Mining Position |
|---|---|---|
| Tier-1 ASX gold producers | $1,600-$2,000/oz | $1,717/oz within top quartile |
| Mid-tier ASX gold producers | $2,000-$2,400/oz | Materially below peer average |
| Global gold major benchmark | $1,400-$1,800/oz | Competitive on global scale |
It is worth noting that AISC benchmarking across producers requires careful interpretation. The World Gold Council's standardised AISC definition includes sustaining capital, royalties, and corporate overhead, but the by-product credit treatment varies across companies. Evolution Mining's copper output meaningfully reduces its reported gold AISC, which is both legitimate and transparent under WGC methodology, but it does mean direct comparisons with single-commodity gold producers require adjustment.
Site-by-Site Analysis: Where the Cash Actually Came From
Cowal (NSW): The High-Grade Flagship
Cowal remains Evolution Mining's most significant single-asset cash contributor. The New South Wales operation benefits from a combination of open pit scale and favourable ore characteristics, with the Cowal Open Pit Continuation project advancing on schedule and within budget. For context, Cowal recorded $885 million in annual operating mine cash flow in FY25, and its trajectory into FY26 continued that trend.
The geological setting at Cowal is important to understand: the deposit sits within a porphyry-related system hosting disseminated gold mineralisation that lends itself to large-scale, low-cost bulk mining rather than selective high-grade extraction. This orebody type typically delivers consistent grade profiles with lower geological variability, which translates directly into predictable processing costs.
Ernest Henry (QLD): Dual-Commodity Leverage
Ernest Henry operates as an underground iron oxide copper gold (IOCG) deposit, a deposit type characterised by simultaneous copper and gold mineralisation hosted in iron oxide-altered breccia systems. IOCG deposits are globally significant because they can deliver genuinely competitive gold AISC through copper by-product credits.
After returning to full production following weather-related disruptions earlier in FY26, Ernest Henry recorded strong annual cash flows and provided the company with natural revenue diversification. When gold and copper prices move in tandem, as they often do in risk-on commodity environments, the dual-commodity exposure creates an amplified margin effect.
Mungari (WA): The Ramp-Up Story Delivering Results
The Mungari expansion in Western Australia underwent a significant mill upgrade, and FY26 was the year that investment began generating measurable returns. Net mine cash flow reached a site record of $104 million in the December 2025 quarter, a result that validated the capital deployed in the processing circuit upgrade.
The Western Australian gold belt, where Mungari operates, is characterised by Archaean greenstone-hosted lode gold deposits, which typically present narrow, high-grade veins that require precise underground mining methods. Grade control is therefore a critical operational variable at Mungari, and the mill ramp-up's success depends on consistent ore supply from underground development.
Northparkes (NSW): Building Tomorrow's Cash Flow Today
Northparkes is an underground block cave copper-gold mine, a mining method that is capital-intensive to establish but delivers exceptionally low operating costs at scale once the cave propagates. The E22 underground development, currently on schedule and within budget, is expected to become a material cash flow contributor in FY27 and beyond.
Block caving is one of the mining industry's most productive methods for large, low-to-medium grade deposits, and Northparkes has a long history of successfully applying this technique. Mine development investment at Northparkes is scheduled to increase in FY27, reflecting the capital commitment required to sustain cave propagation and production continuity.
Red Lake (Canada): A Turnaround Validated by Metrics
Red Lake represents one of the more instructive case studies within the Evolution portfolio. The operation required substantial operational and geological investment following acquisition, and the results in FY26 confirm that the repositioning is producing tangible outcomes. Red Lake generated $80 million in net mine cash flow in the December 2025 quarter and $90 million in the June 2025 quarter, representing a 127% quarter-on-quarter increase at the time.
Red Lake's geological setting in the Superior Province of Ontario places it within one of the world's most historically significant gold camps, hosting high-grade structurally controlled deposits that require precise underground mining. High-grade Canadian operations typically carry higher per-tonne costs than bulk open-pit mines, but the grade premium, when achieved consistently, more than compensates.
The Hedging Decision: Why Full Unhedging Is a Bold but Calculated Signal
How Gold Hedging Works and Why It Matters
Gold hedging involves a producer entering into forward sale contracts that lock in a fixed price for a portion of future production. This provides revenue certainty but caps upside participation when spot prices rise above the contracted level. Historically, many gold producers hedged aggressively during periods of low gold prices to secure project financing or protect balance sheets during high-leverage phases.
Evolution Mining's transition to a fully unhedged position is a deliberate strategic choice to maximise exposure to prevailing market prices. With gold trading well above the company's AISC of $1,717/oz, the removal of the hedging book means every ounce of production is sold at spot, capturing the full margin of approximately $1,958/oz reported in FY26. Those interested in a broader view of the sector can consult our gold record highs guide for additional context on price drivers.
The Balance Sheet Conditions That Make Unhedging Viable
Not every gold producer can afford to be fully unhedged. Hedging is often a covenanted requirement from lenders seeking protection against commodity price volatility. The fact that Evolution Mining can operate without hedge protection reflects:
- A net cash balance sheet with no near-term refinancing risk
- No debt repayments due until FY29, eliminating lender-imposed hedging requirements
- A diversified asset base that provides operational cash flow continuity even if individual sites underperform
- Copper exposure at Ernest Henry that provides a partial natural hedge against gold price weakness through commodity diversification
From an investor psychology standpoint, the fully unhedged status sends a clear signal: management believes current commodity prices are sustainable enough to justify full market exposure. This is a meaningfully different message than simply reporting strong quarterly numbers.
Quarterly Cash Flow Progression: Tracing the Momentum
| Period | Group Cash Flow | Key Driver |
|---|---|---|
| June 2025 Quarter | $308M | Gold price surge and operational recovery |
| FY25 Annual | $787M | Record annual benchmark established |
| H1 FY26 (Jul-Dec 2025) | $608M | +123% vs H1 FY25; Mungari mill ramp-up |
| FY26 Annual | $1,389M | Full unhedging and all sites at capacity |
The progression from $787 million in FY25 to $1,389 million in FY26 illustrates a compounding effect that is uncommon in resources sector financial histories. It is not a single operational improvement or a commodity price spike driving the result. Multiple sites improved simultaneously, the hedging book was removed, and the gold price environment remained supportive throughout. These conditions rarely align in the same financial year. For further perspective, Australian gold M&A activity in this period also reflects just how attractive the sector has become to capital. Furthermore, Evolution Mining's record $308M cash flow in the June 2025 quarter was itself a milestone that foreshadowed the full-year result now on record.
The next major ASX story will hit our subscribers first
FY27 Outlook: What Investors Should Monitor Closely
Production Variables and Cost Pressures
Formal FY27 production and cost guidance is scheduled for release on 19 August 2026, and several known variables will shape that announcement:
- The planned closure of Mt Rawdon will reduce total group gold output in FY27, with no equivalent near-term offset from other sites indicated
- AISC is expected to increase by approximately $150-$160 per ounce due to inflationary pressures, placing estimated FY27 AISC in the range of $1,867-$1,877/oz
- Despite this increase, the margin between prevailing gold prices and the projected AISC remains substantial at current spot levels
Capital Allocation Priorities in FY27
| Investment Category | FY27 Direction | Strategic Rationale |
|---|---|---|
| Mine development (Northparkes, Cowal, Ernest Henry) | Increasing | Sustain long-term production reliability and cave progression |
| Exploration expenditure | Increasing | Greenfield evaluation and near-mine resource extension |
| Shareholder returns | Maintained or growing | Net cash position supports continued dividend capacity |
| Debt repayment | No near-term requirement | Next repayment due FY29 |
The increase in both mine development and exploration expenditure in FY27 warrants investor attention. Higher capital spending will reduce reported net free cash flow relative to operating cash flow, even if the underlying operational performance remains strong. This is not a deterioration in business quality; it is the natural capital cycle of a mining company investing to sustain future output. However, it does mean FY26's cash generation rate should not be extrapolated as a baseline without accounting for elevated FY27 capital deployment.
The AISC Inflation Dynamic: Industry-Wide, Not Company-Specific
The anticipated $150-$160/oz AISC increase in FY27 reflects a sector-wide challenge. Labour cost inflation in Australian mining jurisdictions, particularly in Western Australia and Queensland, has been a persistent theme since 2022. Energy costs, reagent prices, and equipment procurement timelines have also remained elevated compared to pre-2020 benchmarks.
Evolution Mining is not uniquely exposed to these pressures; all Australian gold producers face a similar inflationary backdrop. The company's advantage lies in its scale and asset diversification, which provide more levers to manage and offset cost increases than single-asset operators possess. Investors exploring themes around undervalued gold mining stocks may find this cost discipline particularly relevant when assessing relative value across the sector.
Safety Performance and ESG Considerations
Why TRIFR Matters to Institutional Capital
Evolution Mining reported a Total Recordable Injury Frequency Rate (TRIFR) of 5.9 as at 30 June 2026. TRIFR measures the number of recordable injuries per million hours worked and is the gold mining industry's most widely used safety benchmark for large employers. For institutional investors, particularly those operating under ESG mandates, safety performance is not merely a reputational consideration. It is a material operational risk indicator: high injury frequency rates correlate with workforce disruption, regulatory intervention, and potential production curtailments.
A TRIFR of 5.9 across a geographically dispersed, multi-jurisdiction portfolio represents a meaningful operational achievement. Underground mining environments, particularly high-grade structurally complex deposits like Red Lake, carry inherent safety challenges that make consistent low-TRIFR performance genuinely difficult to sustain.
Share Price Performance in Context
| Benchmark | 12-Month Return (to July 2026) |
|---|---|
| Evolution Mining (ASX: EVN) | +53% |
| S&P/ASX 200 Index (ASX: XJO) | +2% |
| Outperformance margin | +51 percentage points |
The 51 percentage point gap between Evolution Mining's share price return and the broader ASX 200 over the past 12 months reflects the market's repricing of gold equities in response to several converging forces: elevated spot gold prices, improved operational delivery across the portfolio, the transition to a net cash balance sheet, and the removal of hedging book drag.
Gold equities typically amplify movements in the gold price due to operating leverage, meaning that a percentage increase in the gold spot price translates into a larger percentage increase in earnings and cash flow. At $1,958/oz of cash margin, even modest spot price movements produce material changes in free cash flow. Indeed, Evolution Mining shares jumped 8.9% on the announcement of its record cash flow result, underscoring how decisively the market responded to the financial milestone.
Key Risk Factors That Warrant Ongoing Monitoring
While the FY26 result is demonstrably strong, investors should weigh the following risk dimensions when assessing the forward investment case:
- Gold price dependency: The record cash margin of $1,958/oz is partly attributable to elevated spot prices. A sustained gold price correction would compress margins materially, though the AISC of $1,717/oz still provides substantial buffer above historical average gold prices
- AISC inflation trajectory: If the $150-$160/oz FY27 cost increase proves to be the beginning of a multi-year inflationary trend rather than a temporary adjustment, long-term margin assumptions require revision
- Mt Rawdon closure: The loss of this producing asset reduces portfolio diversification and total ounce production, increasing the relative contribution weighting of remaining sites
- Capital expenditure escalation: Increased development and exploration spend in FY27 will reduce net free cash flow, and further capital commitments at Northparkes in particular are likely to be substantial given the scale of block cave infrastructure required
- Single-year comparison risk: Comparing FY27 cash flow to the record FY26 result risks a perception of performance deterioration even if the underlying business remains fundamentally sound
Frequently Asked Questions: Evolution Mining FY26 Cash Flow
What was Evolution Mining's record cash flow in FY26?
Evolution Mining generated group cash flow of $1,389 million in FY26, alongside operating mine cash flow of $3,394 million and net mine cash flow of $2,079 million, all of which represented record results for the company.
What is Evolution Mining's AISC for FY26?
The company reported a full-year AISC of $1,717 per ounce, described as a sector-leading result, with the June quarter delivering a further improvement to $1,706/oz, representing a 23% quarter-on-quarter reduction.
Is Evolution Mining in a net cash or net debt position?
As of 30 June 2026, Evolution Mining held a net cash position with a cash balance of $1,347 million and no debt repayments required until FY29.
What dividend did Evolution Mining pay in FY26?
Evolution Mining paid a record interim dividend totalling $406 million during FY26, reflecting the company's strengthened cash generation capacity and balance sheet position.
When will Evolution Mining release FY27 guidance?
Formal FY27 production and cost guidance is scheduled for release on 19 August 2026.
Why is Evolution Mining fully unhedged?
The company completed the removal of its hedging book to maximise exposure to prevailing gold and copper spot prices. The net cash balance sheet and absence of near-term debt repayment obligations removed the financial necessity for hedge protection, making full unhedging a viable and strategically attractive position.
What impact will Mt Rawdon's closure have on FY27 production?
The planned closure of Mt Rawdon will reduce total group gold production in FY27. The company has not indicated that equivalent increases at other sites will fully offset this volume reduction in the near term, though Cowal, Ernest Henry, Mungari, and Northparkes are all expected to maintain or grow their respective contributions.
This article contains general information only and does not constitute financial advice. Past performance is not indicative of future results. Investors should conduct their own due diligence and consider seeking independent financial advice before making investment decisions. Forecasts, production guidance, and financial projections referenced in this article are subject to change and involve inherent uncertainty.
Want to Capitalise on the Next Major ASX Mining Discovery Before the Market Does?
While Evolution Mining's record cash flow demonstrates the extraordinary returns possible from well-positioned mining assets, Discovery Alert's proprietary Discovery IQ model scans ASX announcements in real time to identify significant mineral discoveries the moment they are made public — transforming complex geological data into actionable opportunities for investors at every experience level. Explore historic discovery returns on Discovery Alert's dedicated discoveries page and begin your 14-day free trial to position yourself ahead of the broader market.