July 15, 2026
The Macro Architecture Behind Gold's Structural Repricing
Commodity cycles have a habit of confounding the consensus. When an asset transitions from being a tactical hedge to a core institutional holding, the underlying architecture of demand changes in ways that simple price charts rarely capture. That shift is precisely what appears to be unfolding in gold markets heading into 2026, and understanding the mechanics behind it matters far more than tracking the daily spot price.
Gold's behaviour over the past eighteen months has been notably different from prior bull cycles. Rather than spiking on a single geopolitical shock and retreating as tensions subsided, the metal has sustained elevated pricing across multiple macro regimes, periods of dollar strength, shifting rate expectations, and rotating risk sentiment. That persistence is itself a signal worth examining carefully.
The gold outlook with David Sokulsky of Carrara Capital offers a useful framework for unpacking these dynamics. As Chief Investment Officer with a PhD-level grounding in markets, Sokulsky's thesis is not built on fear alone. It rests on a multi-layered structural case involving dollar depreciation, fiscal deterioration, and a secular rotation away from US equity valuations that he views as stretched relative to hard assets.
When big ASX news breaks, our subscribers know first
Three Demand Pillars Reshaping the Gold Market
Gold's current rally draws power from three reinforcing sources that differ meaningfully from the speculative surges seen in 2011 or 2020.
Central bank accumulation has become the most durable of these pillars. According to World Gold Council data, central bank gold demand globally exceeded 1,000 tonnes in both 2022 and 2023, a pace not seen in more than five decades. The motivations behind this buying span reserve diversification, reduced dependence on US dollar-denominated assets, and a desire to hold non-sanctionable wealth following the freezing of Russian sovereign reserves in 2022. That geopolitical precedent fundamentally altered how many emerging market central banks think about reserve composition.
ETF inflows represent the second pillar, amplifying physical and futures market pricing through retail and institutional participation. The relationship between ETF positioning and gold prices has become increasingly reflexive: rising prices attract inflows, inflows support prices, and the cycle continues until positioning becomes crowded enough to trigger correction risk.
De-dollarisation flows form the third, and perhaps most structurally significant, demand driver. The share of global trade settled in US dollars has been gradually declining, and several BRICS-aligned nations have taken active steps to reduce bilateral dependence on the dollar as a reserve and settlement currency. Gold, as the only major reserve asset without a sovereign liability attached to it, benefits directly from this diversification impulse.
"Gold is increasingly being held not as insurance against catastrophe, but as a legitimate long-term reserve asset in a world where the confidence premium attached to US dollar-denominated instruments is being quietly reassessed by sovereign institutions worldwide."
Gold Outlook with David Sokulsky: The $5,000–$6,000/oz Price Target
Breaking Down the Revised Forecast
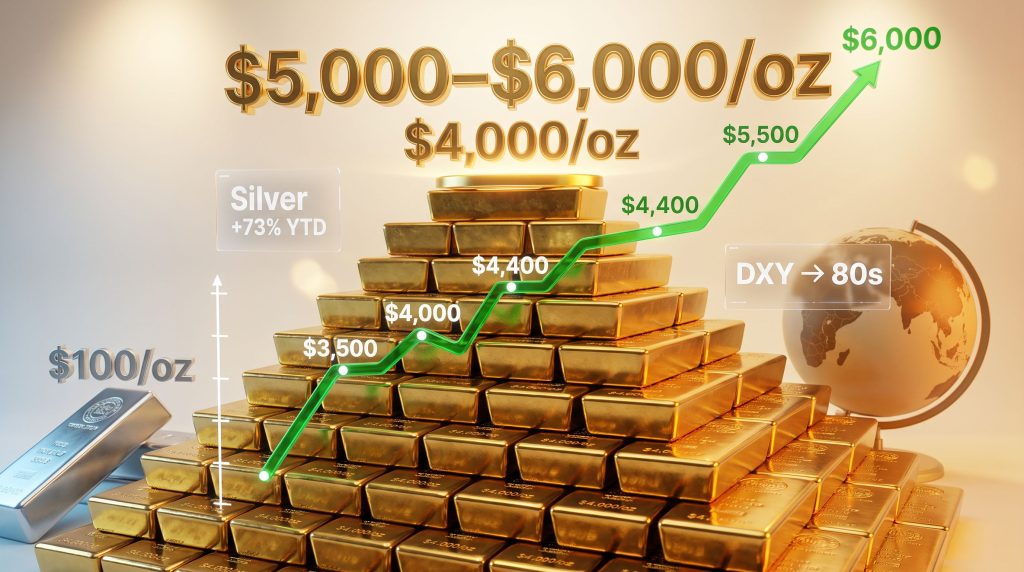
Carrara Capital CIO David Sokulsky has put forward a price target range of $5,000 to $6,000 per ounce for gold, representing a significant upgrade from prior quarterly estimates. It is important to treat this figure as a forward-looking projection grounded in scenario analysis rather than a near-term certainty. The analytical inputs underpinning the target are, however, coherent and internally consistent.
The central thesis rests on three variables moving in concert:
- A sustained weakening in the US dollar, with the DXY potentially declining into the 80s
- Inflation remaining persistently above central bank targets, keeping real yields suppressed
- Continued fiscal deterioration in the United States, increasing Treasury supply and reducing long-term confidence in dollar-denominated assets
Furthermore, the broader gold price forecast positions $4,000/oz not as a ceiling to be broken, but as a base from which the next leg of the bull market develops. For context, gold crossed $3,000/oz for the first time in early 2024, and its rapid ascent since then reflects the accelerating momentum of these structural forces rather than short-term speculative positioning.
The broader analyst community is somewhat more conservative. The consensus range sits between $4,400 and $4,700 as a base case, with a more optimistic scenario placing prices near $5,500/oz by late 2026 if dollar weakness accelerates. Sokulsky's target sits at the upper end of this distribution.
Price Scenario Framework
| Scenario | Price Range | Key Catalyst |
|---|---|---|
| Bull Case (Sokulsky Target) | $5,000–$6,000/oz | DXY decline to 80s, sustained central bank buying |
| Base Case (Consensus) | $4,400–$5,500/oz | Stable Fed policy, moderate dollar weakness |
| Bear / Washout Scenario | $3,500–$3,600/oz | Dollar rebound, risk-on rotation, ETF outflows |
| Institutional Floor Estimate | $3,800–$4,000/oz | Continued central bank demand, geopolitical premium |
The Bear Case: A Washout Before the Next Leg Higher
Not all analysts share Sokulsky's conviction about the trajectory. A cohort of technically-oriented analysts has identified the $3,500 to $3,600/oz zone as a potential correction target before a more durable base can form. The conditions that would need to materialise for such a pullback include a dollar recovery driven by stronger-than-expected US economic data, a faster-than-anticipated Federal Reserve rate cutting cycle that reduces inflation anxiety, and a meaningful liquidation of ETF positioning.
Importantly, even the bear case does not necessarily invalidate the structural bull thesis. Central bank demand has historically acted as a price floor precisely because sovereign buyers are not forced sellers and tend to increase accumulation during price weakness. The estimated institutional floor of $3,800 to $4,000/oz reflects this dynamic.
The US Dollar: The Most Consequential Variable
Sokulsky's Bearish DXY Framework
Gold is priced in US dollars, and the relationship between dollar strength and gold prices is one of the most well-documented inverse correlations in financial markets. When the DXY falls, gold becomes cheaper in non-dollar terms, stimulating demand internationally and, in turn, pushing the dollar price higher.
Sokulsky's bearish dollar thesis targets a DXY decline into the 80s, a level last seen during the commodity supercycle of the mid-2000s and briefly in 2011. The mechanisms he identifies are:
- Persistent US fiscal deficits driving increasing Treasury supply and putting upward pressure on yields, which paradoxically erodes dollar confidence over time
- Accelerating de-dollarisation among emerging market central banks reducing structural demand for US dollar reserves
- The potential for a new Federal Reserve leadership regime under Kevin Warsh to recalibrate monetary credibility, introducing uncertainty about the Fed's inflation-fighting commitment
It bears noting that as of mid-2026, Kevin Warsh's appointment as Federal Reserve Chair represents a significant transition. Market participants are still assessing the implications of new Fed leadership for monetary policy credibility, and gold has historically reacted sharply to perceived shifts in central bank resolve.
Real Yields and Gold's Sensitivity to Rate Policy
"Gold tends to perform most strongly when real interest rates, adjusted for inflation, are negative or declining. When the Federal Reserve maintains nominal rates below the inflation rate, the opportunity cost of holding non-yielding gold falls to zero or below, removing one of the traditional arguments against gold as a portfolio allocation."
This real yield mechanism explains much of gold's behaviour since 2022. Despite nominal rate rises from the Fed, inflation persistence kept real yields suppressed for extended periods, providing a supportive environment for gold even during conventional rate-tightening cycles. If the Fed pivots toward rate cuts while inflation remains above target, the real yield environment becomes structurally constructive for prices in a way that aligns with Sokulsky's $5,000/oz scenario.
Institutional and Sovereign Demand Dynamics
Why Central Bank Buying Is Different from Speculative Demand
Understanding the distinction between sovereign accumulation and ETF-driven retail demand is critical for assessing the durability of gold's floor price. Central banks operate with multi-decade investment horizons and are not subject to redemption pressures. When they accumulate gold, they remove that supply from the tradeable float, creating a persistent reduction in available supply that takes years to reverse.
The post-2022 acceleration in central bank buying has been led by institutions in China, Poland, Turkey, India, and several Gulf states, each motivated by a combination of reserve diversification and reduced reliance on Western-controlled financial infrastructure. According to World Gold Council data, this buying cohort collectively added more than 1,000 tonnes annually across 2022 and 2023, and there is no credible structural reason to expect this trend to reverse abruptly.
ETF Positioning and the Crowding Risk
ETF inflows are a more volatile demand component. Retail and institutional investors who hold gold through exchange-traded products can exit quickly in response to changing rate expectations or risk appetite shifts. When ETF positioning becomes heavily concentrated on the long side, it introduces a meaningful technical risk: any catalyst for rapid redemptions can trigger sharp price corrections that bear little relationship to the underlying fundamentals.
Sokulsky's commentary on whether the gold rally is becoming crowded is therefore worth taking seriously. Monitoring weekly ETF flow data alongside central bank purchase figures provides a more complete picture of demand health than spot prices alone.
Silver vs. Gold: The Relative Value Argument
Sokulsky's $100/oz Silver Target
Silver's performance in the current precious metals cycle has been remarkable. A 73% year-to-date gain significantly outpaces gold's own record-breaking run and signals a broadening of the precious metals bull market. Sokulsky's silver price target of $100/oz implies further outperformance ahead.
The gold-silver ratio analysis is a widely watched valuation framework in the precious metals community. Historically, the ratio has averaged between 50:1 and 60:1 over long periods. When it rises well above those levels, silver tends to mean-revert strongly during the latter stages of precious metals bull markets. The current ratio, even at silver's elevated recent prices, suggests room for continued silver outperformance if the broader bull market extends.
Crucially, silver carries an industrial demand profile that gold does not. Solar panel manufacturing, electric vehicle technology, and consumer electronics all require silver in meaningful quantities. This creates a structural demand floor independent of monetary safe-haven flows, which arguably makes silver's bull case more robust during periods of industrial expansion.
Comparative Risk Profile
| Metric | Gold | Silver |
|---|---|---|
| Sokulsky Price Target | $5,000–$6,000/oz | $100/oz |
| YTD Performance (approx.) | Record highs above $4,000/oz | ~+73% YTD |
| Volatility Profile | Lower | Higher |
| Primary Demand Driver | Monetary / safe-haven | Industrial + monetary |
| Long-Term Outlook (Sokulsky) | Sustained upside | Expected to outperform gold |
The next major ASX story will hit our subscribers first
Navigating the ASX Gold Sector
The AUD Gold Price Advantage and Its Limits
For Australian investors, the gold story has a local dimension that amplifies its relevance. When both the USD gold price rises and the AUD weakens against the dollar, Australian producers benefit from a compounding effect on their AUD-denominated revenue. This dynamic has historically transformed Australian gold miners into some of the highest-margin operators in the global sector during periods of dollar strength.
However, elevated gold prices do not guarantee proportional margin expansion. Rising input costs, including labour inflation, diesel, reagents, and equipment, have been compressing operating margins at the mine level. The challenge for investors is identifying producers with the cost discipline and operational efficiency to convert the gold price tailwind into meaningful free cash flow. In addition, tracking gold mining equities closely can help investors identify where the price tailwind is genuinely flowing through to shareholder returns.
What Separates Quality Operators from Weaker Ones?
Sokulsky's framework for evaluating ASX gold producers focuses on a set of fundamental operational metrics that matter most at the peak of a price cycle, when the margin of safety shrinks if costs escalate:
- All-in sustaining cost (AISC) relative to the prevailing gold price, as the spread between AISC and spot price is the truest measure of operating profitability
- Reserve grade and mine life, since higher-grade deposits generate more gold per tonne of rock processed, lowering unit costs and extending the period over which capital can be recovered
- Balance sheet strength, because producers with net cash or low debt are better positioned to fund sustaining capital during price pullbacks without diluting shareholders
- Production guidance consistency, as operators with a track record of meeting or exceeding guidance tend to attract a valuation premium from institutional investors
- Jurisdictional risk and infrastructure access, since projects in stable mining jurisdictions with established infrastructure can be developed faster and at lower capital intensity
Investor Checklist for ASX Gold Producers:
- AISC meaningfully below the current spot gold price
- Proven and probable reserves supporting a multi-year mine life
- Manageable debt levels with access to undrawn credit facilities
- Demonstrated production guidance delivery over multiple periods
- AUD-denominated cost base with revenue exposure to AUD gold price
Consolidation Wave in Australian Gold Mining
One of the more notable structural trends within the ASX gold sector over recent years has been an accelerating wave of mergers and acquisitions. Consolidation is typically rational at this stage of a gold price cycle: scale enables shared infrastructure, reduces per-ounce overhead, and creates reserve bases large enough to attract institutional capital that smaller companies cannot access.
Australian gold M&A activity is likely to continue, according to Sokulsky. The characteristics that make a gold company an attractive acquisition target include a high-grade, undeveloped or recently producing asset in a low-risk jurisdiction, a management team with a history of resource conversion, and a market capitalisation that allows a major to acquire the asset without triggering dilutive equity raises. Investors scanning for M&A optionality should weight these factors alongside pure valuation metrics.
Key Risks That Could Derail the Bull Thesis
Macro Risks
No bull thesis is complete without a rigorous accounting of what could go wrong. For gold, the primary macro risks include:
- A sustained recovery in the US dollar driven by stronger-than-expected US economic growth or a hawkish surprise from the Federal Reserve
- A faster-than-anticipated rate cutting cycle that reduces inflation anxiety and with it, gold's monetary premium
- A meaningful reversal in central bank buying behaviour, which while historically rare, cannot be ruled out if geopolitical conditions shift
Market Structure Risks
- ETF positioning becoming excessively crowded, creating a fragile technical structure vulnerable to rapid liquidation
- Geopolitical risk premiums unwinding if significant conflict de-escalation occurs in key flashpoint regions
- Liquidity-driven sell-offs where gold is liquidated to fund margin calls in other asset classes, as occurred briefly in March 2020
Key Indicators to Monitor
| Indicator | What to Watch | Bullish Signal | Bearish Signal |
|---|---|---|---|
| DXY (US Dollar Index) | Trend direction | Break below 90, targeting 80s | Recovery above 100 |
| Real US 10-Year Yield | TIPS yield | Negative or declining | Rising above 2% |
| Central Bank Purchases | Quarterly WGC data | Sustained net buying | Significant net selling |
| Gold ETF Holdings | Weekly flow data | Consistent inflows | Accelerating outflows |
| Fed Policy Signals | FOMC statements | Dovish pivot signals | Hawkish surprise |
| Gold/Silver Ratio | Ratio trend | Declining (silver outperforming) | Rising sharply |
Frequently Asked Questions: Gold Outlook 2026
What is David Sokulsky's gold price target for 2026?
Carrara Capital CIO David Sokulsky has revised his gold price target to $5,000 to $6,000 per ounce, underpinned by a structurally bearish view on the US dollar, persistent inflation, and continued sovereign demand. This represents a forward-looking scenario projection rather than a guaranteed outcome.
Why is Sokulsky bearish on the US dollar?
The thesis centres on US fiscal deterioration, rising Treasury supply undermining long-term dollar confidence, and accelerating de-dollarisation by emerging market central banks. A DXY decline into the 80s would be historically significant and strongly supportive of higher gold prices.
Could gold fall before reaching $5,000/oz?
Technical analysts have flagged a potential correction toward $3,500 to $3,600/oz before a sustainable base forms. Institutional demand, particularly from central banks, is expected to provide a floor around $3,800 to $4,000/oz even in a risk-off environment.
Is silver a better investment than gold right now?
Sokulsky's silver target of $100/oz implies he expects silver to outperform gold over the long term, supported by both industrial demand and monetary flows. However, silver carries substantially higher volatility and is therefore more suitable for investors with a higher risk tolerance.
What should investors watch to assess the health of the gold bull market?
The US dollar direction via the DXY, real US Treasury yields via TIPS, central bank purchase data from the World Gold Council, and weekly ETF flows are the most important leading indicators. A simultaneous decline in the DXY and real yields represents the most constructive combination for gold prices.
Positioning for the Next Phase of the Gold Cycle
The structural case for gold in 2026 rests on a foundation that has been building for several years: fiscal expansion without credible consolidation, de-dollarisation by sovereign institutions, persistent inflation, and a Federal Reserve navigating a difficult transition in leadership. These forces do not resolve quickly, which is precisely why the gold outlook with David Sokulsky frames this as a multi-year structural bull market rather than a tactical trade.
The distinction between short-term volatility and structural trend matters enormously for how investors should size and manage their gold exposure. A potential washout to $3,500 per ounce, if it materialises, would represent a buying opportunity within the broader thesis rather than a fundamental breakdown. Monitoring the dollar and real yields provides the most reliable ongoing framework for assessing whether the structural supports remain intact.
For ASX investors specifically, the opportunity is nuanced. Elevated AUD gold prices create favourable revenue conditions, but cost inflation means that stock selection matters as much as sector exposure. Producers with low AISC, strong reserve grades, and disciplined capital allocation are best positioned to translate the gold price environment into sustained shareholder value. For further context on the investment landscape, Carrara Capital's insights provide additional commentary on macroeconomic positioning and portfolio strategy.
Readers seeking further analysis of the gold market and commentary on ASX-listed resource companies can also explore the Expert Exchange series and related content, including the full discussion featuring Carrara Capital CIO David Sokulsky.
This article is intended for informational and educational purposes only and does not constitute financial or investment advice. Price targets and forecasts referenced throughout reflect the views of third-party analysts and should be treated as scenario analysis rather than guaranteed outcomes. Readers should conduct independent research and consult a licensed financial adviser before making any investment decisions.
Want to Capitalise on the Next Major ASX Gold Discovery Before the Broader Market?
Discovery Alert's proprietary Discovery IQ model scans ASX announcements in real time, instantly identifying significant mineral discoveries and translating complex data into actionable insights — so investors can position themselves ahead of the crowd. Explore historic discoveries and their extraordinary returns, then start your 14-day free trial at Discovery Alert to secure a genuine market-leading edge in the evolving gold cycle.