July 15, 2026
Why the Final Quarter Sets the Stage for Gold's Most Powerful Moves
Precious metals markets are rarely driven by a single variable. Instead, they respond to overlapping systems: monetary policy expectations, geopolitical stress, derivatives mechanics, and institutional positioning cycles. Of all the calendar windows that tend to concentrate these forces, the September-to-October transition stands out as one of the most historically significant. Understanding why requires looking beneath the surface of price charts and into the structural machinery of futures markets, the psychology of institutional risk management, and the macro conditions that have repeatedly converged during this two-month window.
This analysis examines the gold price in September and October through multiple lenses: verified price performance in 2025, the mechanics driving COMEX futures activity, a detailed case study from 1999, and the macro variables that determine whether seasonal tendencies translate into sustained rallies or brief spikes.
When big ASX news breaks, our subscribers know first
How Gold Actually Performed in September and October 2025
September 2025: A Record-Breaking Month Unfolds
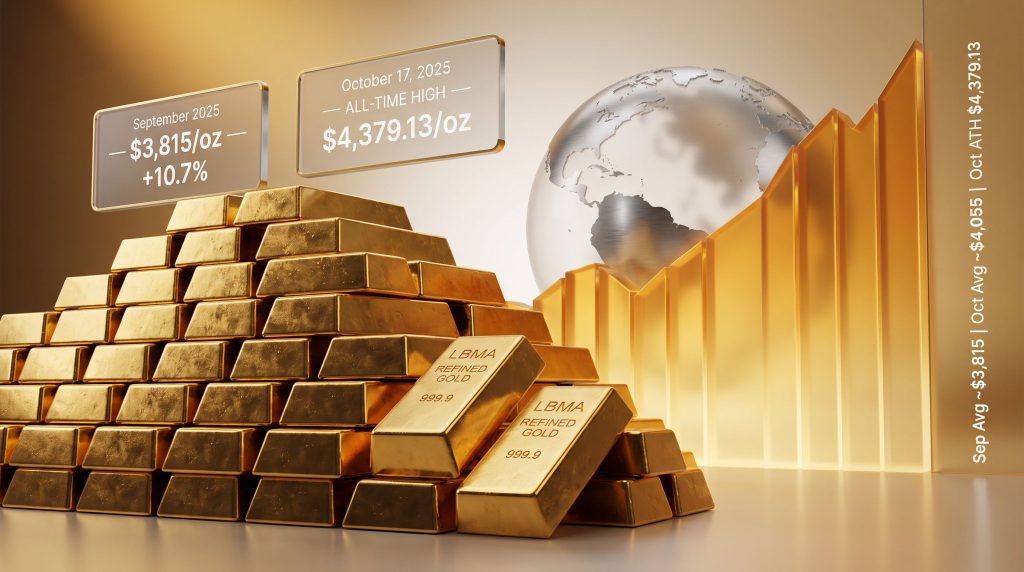
Building on a strong August base, gold entered September 2025 with considerable upward momentum. The monthly average price settled near $3,815/oz, representing a 10.7% increase from August. Late-month price action pushed gold to an intra-month high of approximately $3,873/oz, with the month closing between $3,833 and $3,858/oz depending on the benchmark used.
This was not a quiet drift higher. Intraday volatility was a persistent feature throughout the period. CPM Group's commentary from mid-July 2025 captured this dynamic in real time, noting gold swinging from approximately $3,990/oz to $4,095/oz within a single morning session following U.S. CPI data, a spread of more than $100/oz in just a few hours. For context on where prices stood during this period, gold prices today as of 30 September 2025 reflect the scale of movement across the month.
October 2025: An All-Time High Is Set
October 2025 extended September's momentum decisively. Gold surpassed its prior peak within the first week of the month, reaching approximately $3,950/oz by October 6. On October 17, 2025, gold established an all-time record high of $4,379.13/oz.
Despite a mid-month pullback to approximately $3,897/oz, the month ultimately closed above $4,000/oz, with the monthly average reaching $4,055/oz, a 10.6% month-over-month increase from September. Furthermore, the gold record highs reached during this month confirmed what many institutional analysts had long anticipated.
September vs. October 2025: Performance at a Glance
| Metric | September 2025 | October 2025 |
|---|---|---|
| Monthly Average Price | ~$3,815/oz | ~$4,055/oz |
| Month-End Close | ~$3,833–$3,858/oz | ~$3,979/oz |
| Intra-Month High | ~$3,873/oz | ~$4,379/oz (ATH) |
| Month-over-Month Change | +10.7% vs. August | +10.6% vs. September |
Two consecutive months of roughly 10.7% and 10.6% gains represent a compounding move of significant scale. For context, the price of gold moved from roughly $3,450/oz at the end of August to an all-time high above $4,379/oz by mid-October, driven by the convergence of macro forces, derivatives dynamics, and institutional demand.
Disclaimer: Historical price data and forward projections discussed in this article are for informational purposes only and do not constitute financial advice. Investors should conduct their own due diligence before making any investment decisions.
What Macro Forces Fuelled the September-October 2025 Gold Rally
The U.S. Dollar's Amplifying Role
A weakening U.S. dollar during Q3-Q4 2025 effectively reduced the cost of gold for buyers transacting in other currencies, broadening demand across global markets. This dollar weakness aligned with growing market expectations that the Federal Reserve would continue cutting interest rates, reducing the opportunity cost of holding a non-yielding asset like gold.
Why the Interest Rate Narrative Oversimplifies Gold's Behaviour
One of the most persistent misconceptions in precious metals commentary is the idea that gold moves in a simple, linear inverse relationship with interest rates. CPM Group's research challenges this framing directly.
The more accurate picture is that gold and interest rates frequently respond independently to a third variable, such as credit stress, geopolitical shock, or systemic uncertainty, rather than one mechanically causing the other. As CPM Group has consistently noted, treating this relationship as a simple on/off mechanism leads to frequent analytical errors, particularly during periods when both variables are reacting to the same underlying macro shock.
Analytical context: The June 2025 U.S. CPI data illustrated the complexity of this environment. Headline inflation fell to 3.5% (from approximately 4.2%), while core inflation declined to 2.6%, driven partly by a 9-10% decline in petroleum product prices. On a month-to-month basis, June 2025 recorded an outright price decline. However, oil prices had already recovered to approximately $80/barrel by mid-July, meaning this disinflationary reading was likely a transient phenomenon rather than a structural trend shift.
The implication for gold investors is meaningful: a temporary inflation dip that prompts Fed rate cut expectations can be supportive for gold in the short term. However, if inflation re-accelerates in subsequent months, as lagged energy prices feed back into CPI, the macro backdrop becomes considerably more complex to navigate.
Geopolitical Risk as a Structural Demand Driver
The September-October 2025 period was characterised by multiple concurrent geopolitical stress events. Ongoing hostilities involving U.S.-Iran tensions, continued conflict in Ukraine, and Middle East instability all contributed to sustained safe-haven demand throughout the period.
Domestically, political fragmentation within the United States, including a reported government shutdown commencing October 1, 2025, reinforced institutional interest in gold as a non-sovereign store of value. These compounding geopolitical risk events create what CPM Group describes as a stacking effect on gold demand, one that is difficult to unwind quickly once it takes hold.
It is important to note that some specific geopolitical scenarios referenced in CPM Group's mid-2025 commentary were framed as anticipated risks rather than confirmed events. These should be understood as scenario-based projections rather than verified outcomes.
The COMEX Futures Mechanics Behind Gold's October Seasonality
Why the August-to-December Roll Creates October Opportunity
Understanding gold's seasonal dynamics in the gold price in September and October requires a working knowledge of how institutional traders manage futures positions. Gold futures traders holding August contracts face a critical decision as that contract approaches expiry: roll positions forward to December or use intermediate contract months.
The August-to-December roll carries a spread of approximately $61/oz under the market conditions observed in mid-July 2025. Rolling from August into October, however, narrows that spread to approximately $27/oz, offering meaningful cost savings for large institutional positions. A subsequent October-to-December roll may cost an additional ~$27/oz, but the combined cost still represents a saving of $7-$9/oz versus a direct August-to-December roll.
This arithmetic is not trivial at institutional scale. A fund managing tens of thousands of futures contracts has a strong financial incentive to route through October rather than bear the full $61 spread. In addition, the LBMA and COMEX markets both play a significant role in shaping how these roll dynamics influence global price discovery.
The CME Group's Designation of October as an Active Delivery Month
The CME Group, which owns COMEX, issued a formal reminder in mid-2025 that October is designated as an active contract month for gold futures. This designation reflects a post-COVID structural shift in how institutional traders utilise the October contract, with increased open interest migration from August into October becoming a measurable trend in recent years.
The practical implication is meaningful: greater liquidity in October contracts influences price discovery and can amplify short-term volatility during the roll window. As CPM Group clarified, the CME's announcement was not a signal that the exchange had specific knowledge of unusual market conditions developing in October. It was a straightforward reminder to institutional investors that the October contract offered a cost-effective roll option.
Delta Hedging: What It Is and What It Is Not
A persistent misconception in retail precious metals commentary incorrectly classifies delta hedging activity as a form of physical gold demand. This is factually inaccurate, and the distinction matters significantly for supply-demand analysis.
Delta hedging involves offsetting risk through derivatives instruments, specifically options, futures, and forward contracts. Physical gold is not required and is not used in this process. CPM Group has been involved in delta hedging since the 1980s and has consistently corrected this error, noting that even major bullion traders have explicitly confirmed that physical metal is not involved in their hedging operations.
Technical clarification: When analysts incorrectly classify producer hedging as physical spot supply, or dehedging as physical spot demand, they introduce systematic errors into supply-demand models. This distortion can lead investors to draw incorrect conclusions about the tightness or looseness of the physical gold market.
When a large number of traders are simultaneously compelled to cover short positions during a price spike, the resulting buying pressure can create sharp, short-duration price surges. Once those forced covers are complete, the buying pressure dissipates and prices often retrace, as the 1999 episode demonstrated clearly.
The 1999 COMEX Delivery Event: A Case Study in Market Tightness and Forced Short-Covering
Setting the Scene: A Multi-Year Bear Market Bottoms Out
In mid-1999, gold was trading in the $254-$265/oz range, well into a multi-year bear market that had begun in 1997, partly triggered by the Bre-X scandal and broad central bank selling sentiment. CPM Group had stated in 1997 that gold prices below $300/oz were unsustainably low on a long-term basis, while acknowledging that the suppressed price environment could persist for up to five years.
By 1999, two years into that period, CPM Group was observing signs of physical market tightening: supply relative to demand was contracting, and some investors were beginning to view sub-$265/oz gold as a compelling long-term entry point. Total reported COMEX gold inventories at the time stood at approximately 860,000 oz, a small fraction of current inventory levels.
The Strategic Delivery: Signalling Market Dominance
In late July and early August 1999, a single major investment bank took delivery of approximately 640,000 oz of gold through COMEX futures, roughly two-thirds of total reported COMEX inventories at the time.
This move puzzled many market observers. If the bank had wanted 640,000 oz of gold, it could have accumulated that position quietly in the spot or forward market over five trading days without alerting other participants. Instead, it chose the most visible possible mechanism: the COMEX futures delivery process.
CPM Group's interpretation was that this was a deliberate act of market signalling. The bank was communicating to other participants that it held substantial physical reserves heading into a period it believed would be characterised by gold market tightness. The message was clear: if you need gold in Q4 1999 and the market is tight, we have it.
The September-October 1999 Price Spike: Mechanics Over Narrative
Gold began rising from approximately $260/oz in September 1999, accelerating gradually through $265/oz and $270/oz before spiking sharply during the first COMEX delivery week.
The price ultimately reached $339/oz, then retraced to approximately $310/oz the following session. The primary driver was not sentiment or a fundamental supply shock. It was mechanical: proprietary traders who had sold forward in options, futures, or forwards using borrowed capital were required by their lenders and credit departments to be fully hedged at the close of each trading day.
As the price rose, these traders faced compulsory short-covering. Each round of covering pushed prices higher, triggering the next round of covering, creating a cascade effect. Once all short positions were covered, the buying pressure ceased immediately, and prices retraced sharply.
The Washington Agreement: Coincidence, Not Cause
That same week happened to coincide with the IMF and World Bank annual meetings in Washington. European central banks had gathered over the preceding weekend and produced a formal agreement capping collective gold sales at a defined ceiling for the following five years, set approximately 10-20% above what the banks actually intended to sell, providing internal flexibility.
The agreement also included language restraining gold leasing activity, significant given that central banks were collectively leasing more than 100 million oz of gold at the time, providing substantial liquidity to the gold market in exchange for yield. Consequently, central bank gold demand has evolved considerably since those days, shifting from net selling to sustained accumulation in recent cycles.
| Event | Date | Gold Price Impact |
|---|---|---|
| Major bank takes COMEX delivery (~640,000 oz) | Late July/Early August 1999 | Market signalling, no immediate price spike |
| Gold begins rising from ~$260/oz | September 1999 | Gradual upward movement begins |
| Price spikes to $339/oz | Late September/Early October 1999 | Forced short-covering cascade peaks |
| Washington Agreement announced | Sunday before IMF/World Bank meeting | Coincidental timing, not the primary driver |
| Price retraces to ~$310/oz | Following session | Short-covering complete, buying pressure ends |
Many observers at the time attributed the price spike to the Washington Agreement. CPM Group's assessment, based on direct knowledge of the dynamics at play, concluded that the timing was coincidental. The price move was already underway due to the COMEX delivery mechanics and forced short-covering. The agreement announcement on Sunday simply occurred in the same news cycle as the price peak on Monday.
Fundamental Factors That Create September-October Gold Catalysts
Political Uncertainty as a Recurring Driver
U.S. election cycles, particularly those involving contested outcomes, political fragmentation, or social instability, have historically correlated with elevated gold demand. Institutional investors treat political risk as a non-diversifiable systemic exposure, often increasing gold allocations ahead of high-uncertainty electoral periods.
Divided government scenarios reduce confidence in fiscal policy coherence, reinforcing gold's role as a reserve asset uncorrelated to any single sovereign's creditworthiness.
Economic Softening and Its Dual Effect
Weakening economic data in the lead-up to Q4 typically increases the probability of central bank easing, which reduces the opportunity cost of holding gold. Simultaneously, economic deterioration elevates recession risk, a scenario in which gold's safe-haven properties attract capital rotating out of equities and credit markets.
The conditions CPM Group identified heading into Q4 2025 included:
- Weaker economic data already emerging in mid-2025
- Headline CPI declining from ~4.2% to 3.5%, driven by transient petroleum price declines
- Core CPI falling to 2.6%, with multiple economic segments showing softness
- A one-month deflationary reading on a month-on-month basis, unlikely to persist as oil recovered toward $80/barrel
- Lagged energy price effects expected to push headline inflation back higher in subsequent months
This creates a particularly supportive macro environment for gold: temporary disinflation prompts rate cut expectations, but the underlying trajectory suggests inflation will re-accelerate, a stagflation-adjacent scenario that is historically among the most bullish macro backdrops for precious metals.
Silver and Platinum: Following Gold With Higher Volatility
Silver tracked gold's directional movement through September-October 2025 with characteristically higher intraday volatility. CPM Group's short-term framework had anticipated silver could reach $54/oz during the August consolidation phase, with upside targets in the $54-$60/oz range before the Q4 surge.
Platinum and palladium also exhibited significant intraday ranges during this period, with platinum recording a single-day spread of approximately $74/oz and palladium swinging roughly $78/oz in a single session, reflecting the broader volatility environment across the precious metals complex.
The gold-silver ratio analysis during this period provides a useful secondary indicator of whether precious metals strength is broad-based or concentrated in gold specifically, with a narrowing ratio suggesting industrial and investment demand for silver is participating in the rally.
The next major ASX story will hit our subscribers first
How Investors Should Interpret Gold's September-October Pattern
Distinguishing Structural Demand From Mechanical Price Effects
Not all September-October gold rallies carry the same signal. Some are driven by genuine physical demand tightening, others by futures roll mechanics, and others by macro shock events. The 1999 episode combined all three, producing a sharp but partially self-correcting spike. The 2025 episode appears to have been driven more heavily by sustained macro and geopolitical demand, producing a more durable price advance.
Investors should assess which driver is dominant in any given year before drawing conclusions about sustainability:
- Roll-mechanics-driven rallies tend to be sharp but brief, reversing once forced covering is complete.
- Macro-fundamentals-driven rallies supported by genuine investment demand tend to be more durable and less prone to sharp retracement.
- Physical tightness-driven rallies can be sustained if the underlying supply-demand imbalance persists, but are difficult to identify in advance without detailed market inventory data.
The Consolidation-Then-Surge Pattern
CPM Group's analytical framework anticipated a sideways consolidation phase for gold through August 2025, roughly between $3,800 and $4,800/oz, before a more sustained upward move in September and October. This pattern reflects typical seasonal dynamics: institutional repositioning during summer months, followed by increased activity as Q4 approaches and year-end allocation decisions crystallise.
Investor framework: When evaluating gold's September-October outlook in any given year, consider three variables simultaneously: (1) the state of COMEX futures open interest and the cost structure of the August-to-December roll, (2) the macro backdrop for Fed policy and U.S. dollar direction, and (3) the geopolitical and political risk environment. Convergence of all three variables in the same direction has historically produced the most significant price moves in this seasonal window.
Frequently Asked Questions: Gold Price in September and October
Why does gold often rise in September and October?
Gold's tendency to strengthen during this period reflects the convergence of multiple structural forces: COMEX futures roll activity from August contracts creates increased institutional trading, geopolitical and political risk events tend to cluster in Q3-Q4, and institutional investors historically increase precious metals allocations ahead of year-end portfolio rebalancing. These forces do not always align, but when they do, the effect on the gold price in September and October can be substantial. The gold price forecast 2025 outlined many of these converging conditions well in advance.
What was the gold price in September 2025?
Gold averaged approximately $3,815/oz in September 2025, rising 10.7% from August. The month closed between $3,833 and $3,858/oz, with an intra-month high near $3,873/oz. For a detailed breakdown of price movements on individual trading days, historical metal prices from the Perth Mint offer a reliable reference point.
What was the gold price in October 2025?
October 2025 was a record-breaking month. The monthly average reached approximately $4,055/oz, up 10.6% from September, and an all-time high of $4,379.13/oz was recorded on October 17, 2025.
Does the COMEX October contract affect gold prices?
Yes, indirectly. The October gold futures contract serves as an intermediate roll destination between August and December contracts. When the August-to-December spread is wide (approximately $61/oz), rolling through October reduces that cost to approximately $54/oz in total. This increases open interest and liquidity in October contracts, which can consequently influence short-term price dynamics during the roll window.
Is the relationship between interest rates and gold prices straightforward?
No. While conventional wisdom suggests higher rates are negative for gold, the historical record is more nuanced. Gold and interest rates frequently respond independently to the same underlying macro variables rather than one directly driving the other. CPM Group has consistently argued that treating this relationship as a simple inverse mechanism leads to frequent forecasting errors.
What caused the 1999 gold price spike to $339/oz?
The spike was primarily driven by forced short-covering among leveraged proprietary traders during the COMEX October delivery period. As gold prices rose, credit departments required traders to cover short positions at the end of each trading day, creating a mechanical buying cascade. The Washington Agreement, announced the same weekend, was coincidental in timing and was not the primary driver of the price move.
Key Takeaways: Gold's September-October Structural Opportunity
- September and October represent a structurally significant window for gold price movement, shaped by futures roll mechanics, macro catalysts, and seasonal investment behaviour.
- The 2025 experience, with gold averaging $3,815/oz in September and $4,055/oz in October and reaching an all-time high of $4,379/oz, validated the thesis that Q4 entry points into gold carry asymmetric upside potential.
- Historical precedent, including the 1999 COMEX delivery event, demonstrates how physical market tightness, institutional positioning, and forced derivatives activity can combine to produce sharp, non-linear price moves.
- The distinction between roll-mechanics-driven rallies and fundamentals-driven rallies is critical for assessing whether a September-October price move is likely to be sustained or self-correcting.
- The macro environment heading into any Q4 period, including dollar trajectory, Fed policy expectations, geopolitical risk, and political uncertainty, remains the primary determinant of whether the seasonal tendency translates into a durable rally.
- Delta hedging does not involve physical metal transactions. Conflating derivatives-based hedging activity with physical supply-demand dynamics introduces systematic errors into precious metals market analysis.
Readers seeking a deeper understanding of gold market structure, futures mechanics, and precious metals research methodology may find value in exploring publicly available research from CPM Group, including their periodic market updates and annual yearbook briefings, available at cpmgroup.com.
Want to Know Which ASX Gold Stocks Could Benefit From the Next Major Discovery Cycle?
Discovery Alert's proprietary Discovery IQ model delivers real-time alerts the moment significant ASX mineral discoveries are announced, translating complex market data across 30+ commodities into clear, actionable insights for both short-term traders and long-term investors. Explore historic discovery returns on Discovery Alert's discoveries page to understand the scale of opportunity these market moments can generate, then start your 14-day free trial at Discovery Alert to position yourself ahead of the market.