
July 15, 2026
When Markets Shake Out the Weak Hands: Reading the Gold Cycle's Violent Middle Chapters
Every major gold bull market in modern financial history has contained at least one episode severe enough to convince the majority of participants that the cycle is finished. The 1970s run produced multiple corrections exceeding 40% before gold ultimately climbed 24 times from its base. The 2000s bull market, which carried the XAU mining index more than five times from trough to peak, was punctuated by drops of 25% to 40% that felt, at the time, indistinguishable from structural breakdowns. The gold price bottom and mining stocks washout dynamic is not merely reassuring to understand — it is analytically necessary for anyone attempting to separate a bull market reset from a genuine cycle termination.
The current environment sits squarely inside that uncomfortable middle chapter, and the data demands a careful, disciplined read rather than a reactive one.
When big ASX news breaks, our subscribers know first
How Severe Is the Current Mining Stocks Washout?
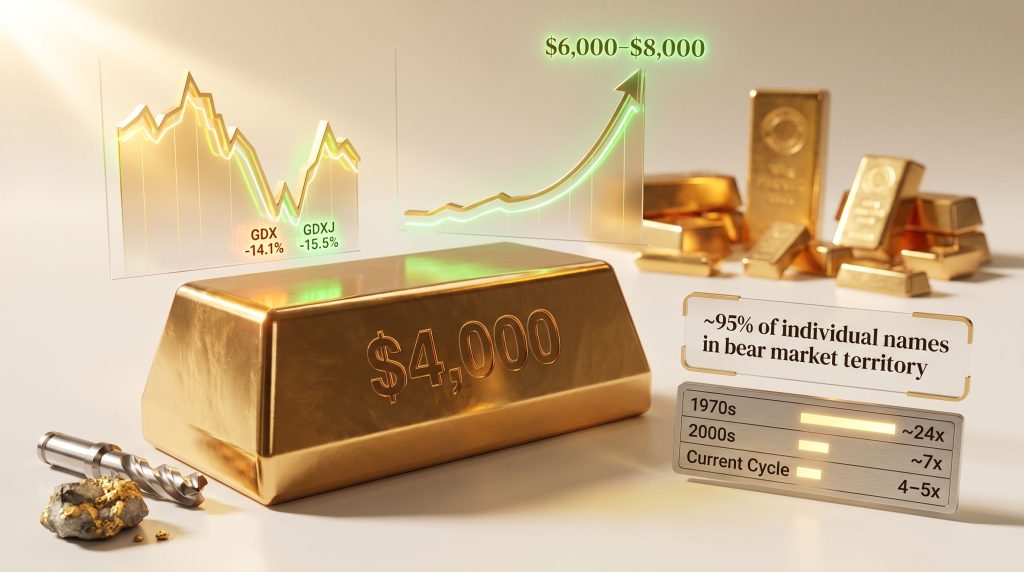
The numbers from this correction are not subtle. The GDX, which tracks large and mid-cap gold producers, declined approximately 30% to 40% from its cycle highs. The GDXJ, which focuses on junior and emerging producers, posted a single-session drop of 15.5% at its worst. GDX itself fell 14.1% in one session.
Among individual names, Newmont declined 11.5% and Barrick Mining fell 19% during the most volatile trading period. Perhaps the most striking statistical reading: approximately 95% of individual gold mining stocks entered bear market territory simultaneously, a breadth deterioration consistent with the kind of capitulation that historically defines durable lows rather than structural breakdowns.
The Leverage Paradox: Why Miners Fall Harder Than Metal
The amplification effect between gold's spot price and gold mining equity leverage is one of the least understood dynamics among newer investors entering the sector. Mining companies carry largely fixed operating cost structures. When the gold price falls, revenue compresses while costs remain relatively stable, creating a disproportionate margin squeeze.
This operational leverage means that a 10% to 11% decline in gold can translate to a 30% or greater drawdown in mining ETFs measured from peak levels. The inverse is equally powerful during recoveries, which is precisely why experienced cycle investors treat deep corrections in miners as asymmetric opportunity windows rather than reasons to exit.
Junior miners absorb additional punishment relative to major producers during these episodes. Smaller companies carry higher perceived execution risk, often lack cash flow buffers, and are disproportionately exposed to sentiment-driven selling when institutional capital withdraws from the sector. This is why GDXJ's single-session decline exceeded GDX's by a meaningful margin.
Identifying the Gold Price Bottom: Key Support Levels and Technical Signals
Among analysts tracking the gold price bottom and mining stocks washout, the $3,900 to $4,000 per ounce range has emerged as the critical support zone. The June 24th trading session has been identified by multiple cycle observers as a probable capitulation point. On that date, gold broke below the $4,000 level, a death cross formation appeared on the chart, and sentiment indicators collapsed.
According to analysts at Investing News, the key question now is how low gold can fall before structural buyers step in decisively. Price action in the weeks that followed has held above $4,000, providing some initial confirmation that the level is acting as a meaningful floor.
Technical signals that historically accompany durable lows in the gold mining sector include:
- A decisive break below the 50-day moving average followed by stabilisation
- Formation of the death cross on the gold price chart
- The GLD Optix sentiment indicator falling below 20%, reflecting extreme bearish positioning
- Futures backwardation emerging relative to spot prices, signalling professional accumulation
- Breadth deterioration reaching 90% to 95% of names in bear territory simultaneously
If gold were to sustain a close below $3,900 per ounce, technical analysis frameworks would open a path toward a deeper retracement near $3,500, representing a more significant correction within the broader bull structure. However, the primary analytical weight currently supports $4,000 as a durable floor, and price action so far has not invalidated that view.
Seasonal Patterns and the Mid-Year Bottoming Window
Seasonality in gold markets is not a guaranteed mechanism, but in years when it functions normally, the price has historically troughed between mid-July and mid-August. The current cycle may have front-run that window slightly, with late June emerging as the potential capitulation point.
What follows this bottoming window carries equal significance: Labour Day in early September is historically the point at which North American institutional capital returns from reduced summer activity. If gold has appreciated 5% to 10% and mining stocks have recovered 20% to 30% during that low-participation window, returning professionals face a classic catch-up dynamic. This re-engagement effect has historically served as one of the most powerful near-term catalysts for a sustained sector rally.
What Is Driving the Correction? A Multi-Factor Analysis
No single variable explains the severity of the current drawdown. A convergence of macro pressures has compressed the sector simultaneously.
Federal Reserve rate uncertainty has driven dollar strength and created headwinds for gold priced in US dollars. The messaging from Fed communications has leaned hawkish, though the structural debt arithmetic underlying US fiscal policy creates a compelling counter-argument to those who take that messaging at face value.
Rising energy costs have compressed miner operating margins, an additional drag that does not affect physical gold but directly impacts the profitability calculations of producing companies.
Sentiment rotation away from precious metals and toward artificial intelligence-themed investments has diverted speculative capital that might otherwise have supported gold equities. The AI investment theme has absorbed an enormous share of the speculative liquidity pool that previously flowed into the metals and mining sector.
A less widely discussed dynamic involves the emergence of the debasement trade as a mainstream Wall Street narrative. While this framing is structurally bullish for gold over the medium term, it also introduces sharp sentiment cycles. Once a theme receives a recognisable label on Wall Street, it becomes subject to momentum-driven buying and selling that amplifies both rallies and corrections beyond what fundamental valuations would justify.
Western investor participation has materially changed the volatility profile of the gold market compared to the early phase of this bull cycle. Previously, central bank gold buying from sovereign entities, particularly China, drove the primary price trend. That dynamic has evolved: Western traders are now setting the price direction while central banks absorb supply opportunistically at discounted levels. China accelerated its gold purchases meaningfully during the recent pullback, a signal that sovereign buyers view the correction as a buying opportunity rather than a structural deterioration.
Distinguishing a Bull Market Reset from a Cycle Termination
The analytical framework for separating a washout that resets a bull market from one that ends it relies on assessing whether the fundamental drivers that initiated the cycle remain intact. A checklist approach provides clarity:
| Characteristic | Current Status |
|---|---|
| Breadth deterioration exceeding 90% of names | Present |
| Identifiable capitulation trading session | Likely present (June 24th) |
| Intact long-term fundamental thesis | Confirmed |
| Futures market signals of professional accumulation | Emerging via backwardation |
| Physical demand absorbing discounted prices | Active via central bank and Asian buying |
| Sovereign debt expansion and deficit spending | Ongoing and accelerating |
| Dollar credibility concerns | Active and structurally embedded |
| Western speculative capital re-entry | Early-stage |
The fundamental case for gold rests on a set of macro imbalances that have not been resolved by the correction. Sovereign debt levels across major economies continue to expand. The structural pressure toward easier monetary conditions, when examined through the lens of debt servicing mathematics rather than central bank communications, remains as compelling as at any point in this cycle.
When the arithmetic of debt servicing obligations is examined independently of central bank meeting-to-meeting communications, the long-term trajectory toward easier monetary conditions becomes structurally difficult to avoid. Investors who focus exclusively on Fed language risk misreading the medium-term policy direction entirely.
Long-Term Gold Price Outlook: Cycle Projections and Historical Analogues
The gold market outlook for cycle analysts who model bull markets against historical precedents arrives at a wide but instructive range of long-term price targets. The following table contextualises where the current cycle sits relative to prior bull markets:
| Historical Cycle | Approximate Multiplier | Base Price | Projected Endpoint |
|---|---|---|---|
| 1970s Gold Bull Market | ~24x | ~$35 | ~$850 |
| 2000s Gold Bull Market | ~7x | ~$250 | ~$1,900 |
| Current Cycle (2015 base) | Conservative 4x to 5x | ~$1,050 to $1,500 | $6,000 to $8,000 |
The 1970s analogue is particularly instructive for its extremity. If that cycle's 24x multiplier were applied to the current base of approximately $1,050 to $1,500 set around 2015, the implied endpoint would reach figures far exceeding even the most aggressive consensus targets. This suggests that a monetary reset or some form of gold reanchoring to the global financial system would be the underlying mechanism driving such an outcome.
More conservative projections targeting the $6,000 to $8,000 range remain the primary analytical framework for this cycle. Importantly, reaching those levels does not automatically signal an exit. The resolution of the underlying macro imbalances — whether through fiscal reform, monetary policy normalisation, or a structural reset of dollar credibility — will likely define the actual cycle endpoint more reliably than price level alone.
Signposts Marking the Final Acceleration Phase
Identifying the transition into the final, fastest phase of a gold bull market involves monitoring several behavioural and structural signals:
- Broad mainstream financial media coverage turning unambiguously bullish
- Generalist equity investors rotating meaningful capital into gold and silver equities
- Mining company management teams accelerating capital expenditure and acquisition spending
- Major producers completing balance sheet repair and beginning aggressive M&A activity
- Silver significantly outperforming gold as speculative capital floods the entire complex
The blowoff top, when it arrives, typically involves parabolic price action over a compressed timeframe, accompanied by retail investor euphoria and stretched valuations across the sector. That environment is not present today. Current conditions reflect the opposite: extreme pessimism, discounted valuations, and professional accumulation occurring quietly while retail sentiment remains depressed.
The next major ASX story will hit our subscribers first
The Fed Policy Wildcard and the Debt Mathematics Argument
The Federal Reserve's communication strategy and its actual policy trajectory may diverge significantly over the medium term. The political pressure on monetary policy is real and documented. More importantly, the mathematics of US sovereign debt servicing create a structural gravity toward lower rates that operates independently of any individual policymaker's stated preferences or short-term communication objectives.
When a central bank signals hawkishness but takes no aggressive action to follow through, experienced cycle observers interpret the silence as coordination rather than independence. Rate cuts, whether arriving on schedule or delayed by quarters, remain the structural direction implied by current debt dynamics.
Hawkish Fed rhetoric delays rather than invalidates the gold thesis. Each delay compresses the eventual adjustment into a shorter timeframe, which historically accelerates the magnitude of gold's response rather than diminishing it. Furthermore, strategists at the AFR have cautioned that any deeper pullback should be viewed in the context of this broader structural backdrop rather than in isolation.
Where Smart Money Is Positioning Right Now
Several data points indicate that professional and sovereign capital is already re-engaging with the sector during the correction:
- China's central bank accelerated gold purchases last month to levels not seen in several years, absorbing supply at discounted prices
- Futures markets have shown episodes of backwardation relative to spot prices, a technical signal associated with professional accumulation and tightening physical supply
- Asian buyers broadly have treated the correction as a procurement opportunity rather than a signal of deteriorating fundamentals
The summer period of reduced institutional activity in North America creates an asymmetric window. If professional investors return after Labour Day to find the sector has already recovered meaningfully during their absence, the resulting FOMO re-engagement can generate rapid and outsized moves in both gold and mining equities.
How to Approach the Mining Sector at a Cyclical Low
The structural inefficiency of the junior mining sector is a feature that experienced investors deliberately seek rather than avoid. Unlike large-cap equity markets where thousands of analysts cover every major company in real time, the small-cap mining universe contains genuine informational edges for those willing to conduct granular research.
A disciplined framework for evaluating mining companies at cycle lows involves working through the following sequence:
- Assess the commodity price argument: Is there a credible, evidence-supported bull case for the underlying metal independent of short-term price action?
- Evaluate operational leverage: How does the specific company's cost structure respond during a gold price recovery? Higher-cost producers carry more leverage but also more risk.
- Examine capital discipline: Has management avoided overcommitting capital at cycle highs, and does the current balance sheet reflect restraint or excess?
- Consider M&A optionality: Does the project's grade, jurisdiction, and scale make it a credible acquisition target for a major producer seeking to replenish its reserve base?
- Review balance sheet health: Is debt manageable at current metal prices, and does the company have runway to wait out a prolonged recovery period if necessary?
The Coming M&A Cycle in Major Producers
Major gold producers have spent this cycle prioritising debt reduction and shareholder returns over aggressive acquisition activity. That discipline, while prudent, has come at the cost of reserve replacement. The gold sector M&A activity is expected to intensify as balance sheets strengthen and internal exploration pipelines thin, creating structural pressure to acquire junior and mid-tier assets.
Historically, the acceleration of major producer acquisitions into a rising gold price environment has been among the most powerful catalysts for small-cap mining stock re-ratings. Human nature, as cycle veterans consistently observe, eventually reasserts itself regardless of the lessons learned from prior cycles.
The bar for finding compelling individual opportunities within the junior mining sector is meaningfully higher in a broadly bullish commodity environment. When a credible bull case exists for virtually every commodity simultaneously, only companies with the realistic potential for outsized and rapid appreciation genuinely separate from the pack.
Diversification Within the Metals Complex
The current correction has not been confined to gold. Silver has significantly lagged gold's earlier rally, which cycle analysts view as a characteristic of the earlier stages of a precious metals bull market. The gold-silver ratio remains an important indicator for timing silver's catch-up phase, which historically produces returns that exceed gold's percentage gains materially.
Beyond precious metals, copper and uranium have attracted attention within the broader natural resource investment thesis. Each carries its own fundamental supply and demand drivers, and experienced resource investors evaluate each commodity and each company on its individual merits rather than applying a uniform thematic allocation across the complex.
The key analytical principle is that global liquidity is vast relative to the size of the metals and mining sector. Even a modest rotation of speculative capital from larger markets into precious metals and mining equities can produce disproportionately large price effects in a sector that remains small by global capital market standards.
FAQ: Gold Price Bottom and Mining Stocks Washout
What is a washout in gold mining stocks?
A washout refers to a rapid, broad-based decline in mining equities driven by forced selling, sentiment capitulation, and technical breakdowns, typically occurring when 90% or more of stocks in the sector enter bear market territory simultaneously. It is generally associated with the formation of a durable bottom rather than a structural breakdown of the underlying bull market.
How long do gold mining corrections typically last?
Historical data from the 2000s bull market suggests corrections of 25% to 40% lasted between 6 and 20 weeks before reversing. The current correction has already entered the timeframe consistent with prior intermediate cycle lows.
What is the difference between GDX and GDXJ?
GDX tracks large and mid-cap gold producers while GDXJ focuses on junior and emerging producers. GDXJ exhibits higher volatility in both directions due to the smaller size and elevated operational risk of its constituent companies.
Why do gold mining stocks fall more than gold itself?
Mining companies carry largely fixed operating costs. When gold prices fall, revenue declines while costs remain stable, compressing margins disproportionately. This operational leverage amplifies both gains and losses relative to the underlying metal price. Consequently, the gold price bottom and mining stocks washout pattern tends to be far more dramatic in equities than in the spot price.
What technical level are analysts watching as key support for gold?
The $3,900 to $4,000 per ounce range is widely cited as the critical support zone. A sustained close below $3,900 would increase the probability of a deeper correction toward $3,500, while continued price stability above $4,000 supports the intermediate bottoming thesis.
When do institutional investors typically re-engage with gold after summer?
Post-Labour Day in early September is historically when North American institutional capital returns from reduced summer activity. If the sector has appreciated during this low-participation window, re-engagement can create an accelerated buying dynamic with meaningful upside velocity. In addition, this seasonal dynamic has historically marked some of the most decisive turning points in the gold price bottom and mining stocks washout cycle.
Disclaimer: This article is intended for informational and educational purposes only and does not constitute financial advice. All price targets, cycle projections, and technical levels discussed represent analytical frameworks and historical analogues rather than guaranteed outcomes. Investing in gold, mining equities, and resource sector assets involves significant risk, including the potential loss of capital. Past cycle behaviour does not guarantee future results. Readers should conduct their own due diligence and consult a qualified financial adviser before making investment decisions.
Want To Be First When the Next Major Gold Discovery Hits the ASX?
Discovery Alert's proprietary Discovery IQ model delivers real-time alerts the moment significant mineral discoveries are announced on the ASX, transforming complex data across 30-plus commodities into clear, actionable insights for both traders and long-term investors. Explore how historic discoveries have generated extraordinary returns and begin your 14-day free trial today to position yourself ahead of the market before the next major move unfolds.