July 14, 2026
The Monetary Fault Line Most Investors Are Ignoring
There is a structural fault line running beneath the global financial system, and most investors are only now beginning to feel the tremors. It is not the size of the United States national debt that has changed the calculus for gold ownership. Debt has been growing for decades, and markets have absorbed it with relative calm. What has changed, fundamentally and irreversibly, is the cost of carrying that debt. The relationship between US debt interest and gold prices has entered a new phase entirely — one that every serious investor should understand.
When big ASX news breaks, our subscribers know first
The Interest Burden That Rewrites Fiscal History
From Debt Accumulation to Debt Servicing Crisis
For most of the post-World War II era, U.S. federal debt grew in ways that were broadly manageable relative to economic output. Interest payments, while rising, remained proportional enough that policymakers could treat them as a background condition rather than an existential constraint. That relationship broke down decisively after 2020.
The critical variable is not the headline debt figure but the rate at which interest obligations are compounding. Quarterly federal interest expenditure data stretching back to 1947 reveals a pattern that is unambiguous: while interest costs climbed steadily for decades, the post-2020 acceleration is without peacetime precedent. This is not a continuation of an old trend. It is a structural break.
What $1 Trillion in Annual Interest Actually Represents
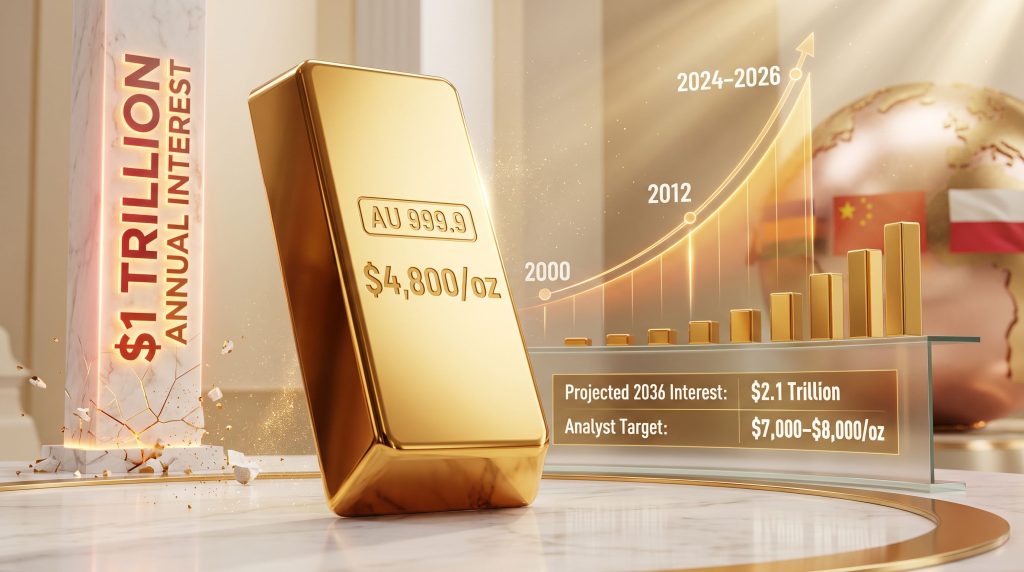
U.S. debt interest payments have now crossed the $1 trillion annual threshold, with the U.S. Treasury servicing approximately $24 billion per week in interest obligations alone. To put that in institutional context:
| Metric | Figure | Context |
|---|---|---|
| Annual interest payments (FY2026) | $1 trillion+ | Exceeds the entire U.S. defense budget |
| Monthly interest cost (H1 FY2026) | ~$88 billion | Equivalent to funding several federal agencies |
| Weekly interest obligation | ~$24 billion | Larger than the GDP of numerous small nations |
| Projected annual interest by 2036 | $2.1 trillion | Based on current debt and rate trajectory |
| Total U.S. national debt | Approaching $36-40 trillion | No structural mechanism for reversal in place |
What makes this figure particularly sobering is the comparative context. Interest payments on U.S. debt now exceed the combined annual outlays for the Department of Defense, the Department of Commerce, Homeland Security, the Department of Education, the Environmental Protection Agency, and the Small Business Administration. This is not a projection. It is the current fiscal reality.
The Credit Card Analogy That Actually Fits
The mechanics of compounding debt are familiar to anyone who has carried a high-interest credit card balance. The danger is not visible when balances are small and interest charges are modest. The danger emerges when payments begin to only cover the interest accruing each month, leaving the principal untouched and growing.
The United States has arrived at an analogous position at a scale that no analogy can fully capture. With nearly $40 trillion in outstanding debt, the federal government is increasingly borrowing new money not to fund programmes or infrastructure, but to cover interest owed on previously borrowed money. Furthermore, US inflation and debt pressures are compounding this challenge, making the debt-interest-debt cycle even more difficult to escape.
Fiscal Dominance: When Debt Obligations Override Policy
Defining the Trap
Economists use the term fiscal dominance to describe a specific and dangerous condition: the point at which the scale of sovereign debt obligations begins to constrain the independence of monetary policy. In practice, this means that central bank decisions about interest rates, money supply, and inflation management become increasingly subordinate to the need to keep debt servicing costs manageable.
When a government's interest burden becomes large enough, it effectively forces the central bank into a corner. Raising rates to fight inflation also raises borrowing costs on trillions in outstanding debt. Cutting rates to ease fiscal pressure risks reigniting inflationary pressure. There is no clean exit from this trilemma.
Why No Administration Has a Structural Incentive to Reverse Course
One of the more uncomfortable truths embedded in the current fiscal situation is that no political administration, regardless of ideological orientation, has a structural incentive to meaningfully reduce debt accumulation. Government spending is the mechanism through which political coalitions are maintained, programmes are funded, and electoral promises are kept.
Reducing spending enough to genuinely address the debt trajectory would require cuts of a magnitude that no modern administration has been willing to propose or implement. The result is a system that is self-reinforcing by design. Debt grows. Interest on that debt grows faster. New borrowing is required to service old borrowing. Understanding this dynamic is central to understanding why US debt interest and gold prices have increasingly moved in the same direction.
The Macro Mechanism Connecting Debt Interest to Gold
How Fiscal Deterioration Flows Into Precious Metals Demand
Gold does not respond directly to debt numbers printed in government reports. It responds to confidence. Specifically, it responds to eroding confidence in the purchasing power of fiat currency, the credibility of monetary institutions, and the long-term sustainability of sovereign debt structures. When those confidence signals weaken, capital begins migrating toward assets that exist outside the debt cycle.
Physical gold is the most historically durable of those assets. It carries no counterparty risk, cannot be printed into existence, and has served as a store of value across every major monetary transition in recorded history. Understanding gold in the monetary system helps explain why, as fiscal conditions deteriorate, the argument for holding gold shifts from speculative to structural.
Correlation Data: US Debt Trajectory vs. Gold Prices
| Period | Debt Trend | Gold Price Trend | Relationship |
|---|---|---|---|
| 2000-2012 | Rising sharply | Rising sharply | ~87% positive correlation |
| 2012-2018 | Moderate growth | Declining / flat | Divergence period |
| 2018-2024 | Accelerating | Recovering | Moderate positive |
| 2024-2026 | Explosive growth | Record highs ($4,800+) | 0.62-0.68 strong positive |
The 2012 to 2018 divergence is often cited as evidence that debt growth and gold prices do not reliably correlate. However, that period had a specific explanatory context: the Federal Reserve was actively normalising policy after the post-crisis era of quantitative easing, real interest rates were rising from deeply negative territory, and the U.S. dollar was strengthening. Those conditions suppressed gold's appeal relative to yield-bearing alternatives. The conditions that made the 2012 to 2018 divergence possible do not exist today in the same form. For further context, gold and bond dynamics provide additional insight into how these forces interact across economic cycles.
Gold Above $4,800: Understanding the 2026 Breakout
What Changed to Drive the Record High
Gold's move above $4,800 per ounce in 2026, representing a year-over-year gain exceeding 46%, reflects a fundamental repricing rather than speculative momentum. Three converging forces have driven institutional and sovereign demand to levels that have overwhelmed typical selling pressure:
- Dollar debasement concerns rooted in the structural growth of money supply and deficit spending
- Treasury market credibility erosion as the $1 trillion interest burden calls into question the long-term attractiveness of U.S. government debt as a safe haven
- Sovereign reserve diversification as central banks across emerging and developed markets reduce dollar-denominated holdings in favour of hard assets
This is not a retail-driven rally. The buyers accumulating gold at scale are institutions and central banks with multi-decade time horizons, not individual investors chasing momentum.
The Distinction Between Paper Gold and Physical Demand
A critical nuance frequently lost in headline price coverage is the difference between paper gold — which includes futures contracts, ETF shares, and derivatives — and physical gold, which refers to allocated bullion held outside the banking system. Spot prices in the paper market can be influenced by factors entirely disconnected from physical supply and demand, including short-selling in futures markets, margin calls during broad risk-off events, and leveraged liquidations.
This gap between paper pricing mechanics and physical demand reality explains why gold prices can decline sharply even when the underlying macro case for ownership is strengthening. According to data tracking US federal debt against gold prices, the long-run structural relationship between fiscal deterioration and gold appreciation remains compelling despite short-term dislocations.
Why Central Banks Are Buying While Retail Sells
The Institutional vs. Retail Behavioural Divide
One of the more instructive dynamics unfolding in the current gold market is the behavioural divergence between retail participants and sovereign buyers. As gold experienced a correction of approximately 25 to 30% from its 2025-2026 peak, retail investors and speculative traders were liquidating positions, responding to short-term price signals and rate rhetoric from the Federal Reserve.
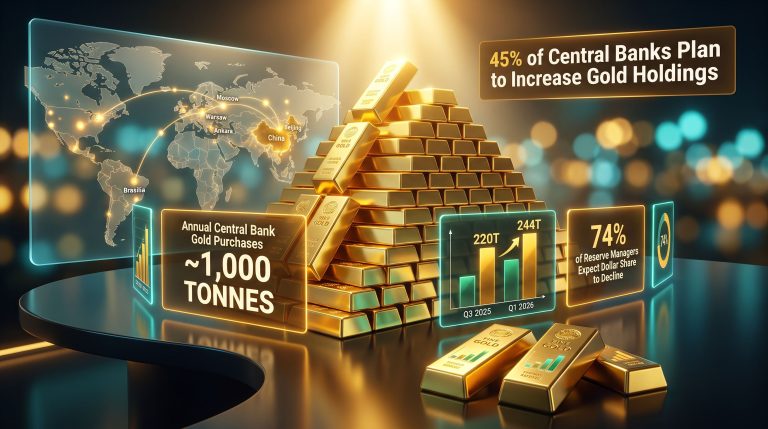
Central banks were doing the opposite. Central bank gold buying has remained robust throughout the price decline, with Poland's National Bank maintaining consistent accumulation and treating the correction as a purchasing opportunity. China's gold reserves saw their largest increase since 2023 during the same period of price weakness.
The behavioural signal from sovereign reserve managers is worth examining carefully. The very institutions responsible for issuing and managing fiat currency are accelerating their acquisition of the one asset that exists independently of fiat systems. This is not a coincidence.
What "Buying the Dip" Means at the Sovereign Level
When a nation-state's central bank buys gold during a price decline, it is not making a short-term trade. It is making a long-duration statement about where it expects monetary conditions to evolve over years and decades. Furthermore, central bank gold reserves have been growing consistently across multiple sovereign balance sheets, reinforcing the view that institutional conviction in gold's structural role is strengthening rather than weakening. Their accumulation behaviour during periods of price weakness has historically been a leading indicator of subsequent gold price appreciation.
The next major ASX story will hit our subscribers first
The 2008 Parallel and What History Suggests Next
Pattern Recognition in Precious Metals Corrections
Gold's biggest monthly decline in June 2025 since the 2008 Great Financial Crisis invites a direct historical comparison. During the 2008 crisis, gold fell from approximately $969 per ounce to $728, a drop of roughly 25 to 26% over approximately five months. The timing seemed counterintuitive. As the financial system was visibly fracturing, gold was declining. Forced liquidations, margin calls, and a temporary flight to dollar liquidity drove the price lower despite the deteriorating macro environment.
| Event | Pre-Drop High | Trough | Decline | Subsequent Outcome |
|---|---|---|---|---|
| 2008 Great Financial Crisis | ~$969/oz | ~$728/oz | ~25-26% | Multi-year bull run to $1,900+ |
| 2025-2026 Correction | ~$5,200/oz (est.) | ~$4,000/oz | ~25-30% | Central bank buying persists |
What followed the 2008 trough was a multi-year bull market that took gold from $728 to over $1,900 by 2011. The pattern — forced liquidation creating a price dislocation, followed by a sustained recovery driven by structural macro forces — is directly relevant to the current environment. As Sprott's analysis of the debt cycle highlights, gold has consistently benefited from structural fiscal deterioration over long time horizons.
The Federal Reserve Tightening Signal and Its Contradictions
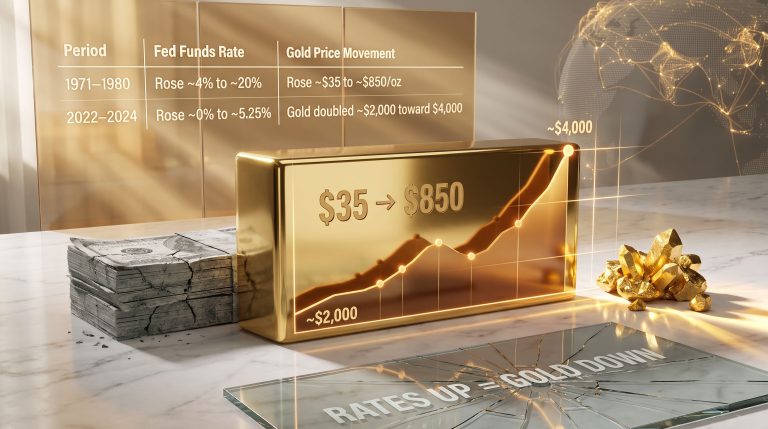
Gold's sharp decline in mid-2026 was partly triggered by signals from the Federal Reserve under Kevin Warsh indicating the possibility of further monetary tightening. Historically, rising interest rates have been bearish for gold because they increase the opportunity cost of holding a non-yielding asset while strengthening the dollar. This logic drove speculative selling.
However, the rate hike narrative carries a fundamental contradiction in the current environment. With nearly $40 trillion in outstanding debt, each upward move in interest rates mechanically increases the annual interest burden already consuming more than $1 trillion per year. 10-year Treasury yields at 4.465% are structurally incompatible with long-term debt sustainability at current debt levels. The rate hike signal may therefore represent a short-term suppression mechanism rather than a durable policy direction.
Historical Currency Resets and Gold's Role
What Every Major Monetary Transition Has in Common
History does not offer a single example of a major currency devaluation or monetary reset in which gold failed to appreciate significantly relative to the devalued currency. Whether examining the Bretton Woods breakdown in 1971, the Weimar hyperinflation, or more recent emerging market currency crises, gold has consistently served as the asset that preserves purchasing power across the transition.
The magnitude varies. In some resets, gold has repriced at six times its pre-reset value relative to the devalued currency. In others, the ratio has been far higher. The direction, however, has never been in doubt.
Physical gold's defining characteristic in this context is its position outside the debt cycle. It is not someone else's liability. It cannot be created by a central bank decision. It cannot be defaulted on. These properties are precisely why sovereign reserve managers — who understand better than anyone how fiat systems function and where they are vulnerable — are choosing to accumulate it during periods of price weakness.
Where Gold Prices Could Head Through 2036
Analyst Projections and Scenario Frameworks
Forward projections for gold prices carry significant uncertainty and should not be interpreted as guarantees. Nevertheless, structured scenario analysis based on current debt trajectories provides a useful framework for thinking about where gold's structural floor may be reset over the coming decade.
| Scenario | Debt Interest Trajectory | Gold Price Range | Primary Driver |
|---|---|---|---|
| Base Case | $1.2-1.5T annually by 2028 | $5,500-$6,500/oz | Continued central bank accumulation |
| Accelerated Case | $1.8T+ by 2030 | $7,000-$8,000/oz | Dollar confidence erosion and reserve shift |
| Structural Reset | $2.1T by 2036 | Significant repricing event | Full monetary system restructuring |
Analyst consensus around $7,000 to $8,000 per ounce scenarios by 2027 is contingent on the debt interest trajectory continuing to accelerate without meaningful fiscal correction. Given the structural incentives discussed above, that trajectory appears more likely to persist than to reverse.
The $2.1 trillion annual interest projection for 2036 is not a fringe forecast. It is the output of applying current debt growth rates and prevailing interest rate environments to existing debt structures. If that projection materialises, the structural case for US debt interest and gold prices moving in tandem will be stronger than at any point in modern monetary history.
Frequently Asked Questions: US Debt Interest and Gold Prices
Does Rising US Debt Always Push Gold Prices Higher?
Not automatically or immediately. The relationship between US debt interest and gold prices is mediated by confidence, real interest rates, and dollar strength. When real rates are positive and dollar credibility is intact, debt growth alone may not be sufficient to drive gold appreciation. The current environment is characterised by negative or near-zero real rates combined with a rapidly deteriorating fiscal position, which is a more reliable combination for gold demand.
Why Did Gold Fall Between 2012 and 2018 While Debt Was Rising?
The 2012 to 2018 period saw the Federal Reserve actively normalising policy, real interest rates recovering from post-crisis lows, and dollar strength making yield-bearing alternatives more attractive than gold. Those specific conditions suppressed gold's appeal despite rising debt. Those conditions do not exist in the same form today.
Are Central Banks Still Buying Gold in 2026?
Yes. Both Poland's National Bank and China's central bank have been active buyers during the 2025 to 2026 price correction, treating price weakness as an accumulation opportunity rather than a reason to reduce exposure.
What Happens to Gold If the US Raises Interest Rates?
Short-term rate hike signals typically create selling pressure on gold from speculative participants. However, at current debt levels, sustained rate increases would dramatically worsen the federal interest burden, ultimately accelerating the fiscal deterioration that drives structural gold demand. The short-term suppression effect has historically given way to stronger long-term appreciation.
What Is Fiscal Dominance and Why Does It Matter for Gold?
Fiscal dominance occurs when sovereign debt obligations become large enough to constrain monetary policy independence. At that point, central banks lose the ability to prioritise inflation control without simultaneously threatening debt sustainability. This condition historically resolves in favour of currency debasement, which is the core driver of long-term gold appreciation.
Key Takeaways: Gold in a High-Debt Environment
- U.S. annual debt interest has crossed $1 trillion, a threshold with no peacetime historical precedent, and the weekly cost of approximately $24 billion now exceeds the combined budgets of multiple major federal agencies
- The debt-interest-debt cycle is structurally self-reinforcing, with no viable political mechanism for reversal under current incentive structures
- Central banks in Poland, China, and across emerging markets are accumulating gold during price weakness, signalling long-duration institutional conviction that diverges sharply from retail selling behaviour
- The 2025 to 2026 correction of roughly 25 to 30% mirrors the 2008 Great Financial Crisis pattern, which preceded a multi-year bull market taking gold to $1,900+ from a trough near $728
- Analyst scenarios place gold at $7,000 to $8,000 per ounce if debt trajectories hold, with a structural repricing possible if the 2036 interest projection of $2.1 trillion materialises
- The fundamental driver of the current gold bull market is not speculative momentum but sovereign confidence erosion — the same force that has driven gold appreciation in every major monetary transition across history
This article is intended for informational and educational purposes only. It does not constitute financial advice. All price projections and scenario analyses involve significant uncertainty. Past performance of any asset, including gold, does not guarantee future results. Readers should consult a qualified financial professional before making investment decisions.
Want to Track the Next Major Mineral Discovery Before the Market Catches On?
While structural shifts in gold's monetary role reshape portfolios globally, Discovery Alert's proprietary Discovery IQ model delivers real-time alerts on significant ASX mineral discoveries — instantly translating complex data across 30+ commodities into actionable insights for both traders and long-term investors. Explore how historic discoveries have generated substantial returns on Discovery Alert's dedicated discoveries page, and begin your 14-day free trial today to position yourself ahead of the market.