July 15, 2026
When Cycles Speak Louder Than Headlines
Precious metals markets have a long history of punishing impatience and rewarding those who understand the difference between noise and structure. Bull markets rarely travel in straight lines. They breathe, retrace, shake out weak hands, and then resume their dominant direction with renewed force. The gold price forecast the pullback is over higher prices ahead thesis is gaining considerable traction among institutional analysts and technical cycle practitioners alike. What separates seasoned participants from reactive traders is the ability to recognise when a price decline is cyclical rather than structural, and to act accordingly before confirmation is fully priced in.
The mid-2026 correction in gold is a case study in exactly this dynamic. From its January 2026 peak, gold experienced a meaningful pullback that tested the resolve of even committed bulls. Yet the weight of technical evidence, combined with a shifting macroeconomic backdrop, increasingly points toward a conclusion that the correction phase has run its course. Understanding why that conclusion is being reached, and what conditions would either validate or invalidate it, is the central challenge for any investor navigating the precious metals complex right now.
When big ASX news breaks, our subscribers know first
Why This Correction Looks More Like a Pause Than a Peak
The Anatomy of a Cycle Low
Not all price declines carry the same meaning. Within a multi-year bull market, periodic corrections serve an important function: they reset sentiment, flush out speculative excess, and rebuild the technical foundation necessary for the next advance. The critical analytical task is distinguishing between a corrective pause and a genuine trend reversal.
Several structural features define a typical cycle low within a secular bull market:
- Momentum indicators reaching deeply oversold extremes that historically coincide with selling exhaustion
- Price finding support within a pre-defined target zone rather than breaking through it decisively
- Macro catalysts arriving at precisely the moment when technical conditions are most receptive
- Related assets forming simultaneous bottoms, confirming broad-based sector capitulation
The June 2026 correction in gold exhibited all four characteristics. Technical cycle analysis identified $3,941 on June 30, 2026 as the probable cycle low. What makes this reading particularly significant is that it arrived within a pre-calculated target zone, not as a surprise breakdown. When price behaves as predicted within a structured framework, it substantially increases confidence in the cycle interpretation. Furthermore, understanding gold stock market cycles helps place this correction within its proper historical context.
The CPI Catalyst and What It Actually Signals
The June 2026 Consumer Price Index reading came in at -0.4%, below consensus expectations. On the surface, this is a single monthly data point. However, in the context of gold market dynamics, its implications run considerably deeper.
Gold's primary adversary in a rising rate environment is the real yield, which is the return available on government bonds after adjusting for inflation. When inflation falls, real yields theoretically rise, increasing the opportunity cost of holding non-yielding assets like gold. Consequently, when inflation decelerates faster than expected, markets begin pricing in a more accommodative Federal Reserve, which compresses real yields and removes the primary headwind facing precious metals. The interplay between gold and bond dynamics during these transitions is particularly instructive for understanding the current environment.
A softer-than-expected CPI print does not just shift bond market pricing. It recalibrates the entire framework through which gold's opportunity cost is calculated, often accelerating a move that technical conditions had already flagged as imminent.
This is why the timing of the June CPI release was so significant. It did not create the cycle low in gold; rather, it provided the macro confirmation that technical analysts had been anticipating. The combination of a deeply oversold momentum indicator and an external catalyst is the hallmark of a durable bottom rather than a temporary bounce.
The Gold Price Forecast: What Institutional Analysis Is Projecting
Where Major Banks Stand on Gold Through 2027
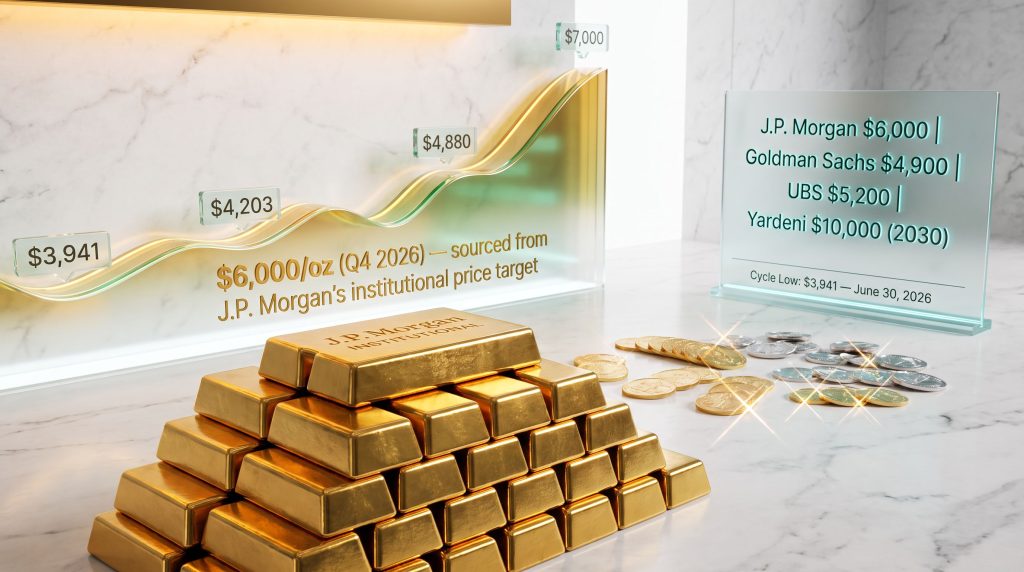
Institutional price forecasts for gold in 2026 and beyond reflect a remarkably unified directional consensus, even if the magnitude of projected gains varies considerably. The table below captures the current institutional landscape:
| Institution | Price Target | Timeframe | Primary Driver |
|---|---|---|---|
| J.P. Morgan | $6,000 / $6,300 | Q4 2026 / 2027 | Central bank demand, dollar weakness |
| Goldman Sachs | $4,900 | 2026 | Structurally bullish (revised from $5,400) |
| UBS | $5,200 / $5,400 upside | 12 months | Current dip as accumulation opportunity |
| Morgan Stanley | $4,400 | Near-term | +10% from early 2026 levels |
| Yardeni Research | $6,000 / $10,000 | 2026 / 2030 | Fiscal deficits, inflation, geopolitical risk |
The spread between Morgan Stanley's relatively conservative $4,400 target and J.P. Morgan's $6,300 projection for 2027 reflects genuine uncertainty about the pace of the rally rather than disagreement about its direction. Every major institution listed above is expressing a bullish view; the debate is simply about how aggressively and how quickly gold will move. For additional perspective, J.P. Morgan's commodities research provides a comprehensive breakdown of the structural factors driving these projections.
Technical Price Levels Defining the Next Leg Higher
Beyond institutional price targets, technical cycle analysis provides a more granular roadmap for how the recovery may unfold. Key levels to monitor include:
- $3,941 – Identified as the probable cycle low (June 30, 2026)
- $4,203 – First pivot confirmation threshold requiring a decisive close above
- $4,380 to $4,400 – Bullish reversal confirmation zone; successive closes here validate the bottom
- $4,620 to $4,880 – Near-term upside targets following a confirmed breakout
- $7,000+ – Medium-term projection within the next 12 to 18 months under a sustained bull scenario
- $3,800 to $3,900 – Last meaningful support band if the corrective phase extends further
One nuance that is frequently misunderstood by less experienced market participants is the importance of sequential confirmation rather than a single close above resistance. A single session above $4,203 is insufficient to validate the bottom. What the cycle framework requires is progressive closes that demonstrate sustained buying conviction rather than a brief excursion followed by retreat.
The Long-Duration Case: $10,000 Gold and the 2030 Thesis
The $10,000 gold price scenario, while sounding extreme to those unfamiliar with long-cycle analysis, is supported by multiple independent analytical frameworks. Yardeni Research projects gold reaching this level by 2030, citing structural deficit spending as the primary driver. Technical cycle analysis running through multi-decade frameworks targets a range of $10,000 to $15,000 by 2030 to 2031, with the peak aligned to what analysts describe as a major economic inflection point.
The macro architecture underpinning these long-duration targets includes:
- Sustained expansion of U.S. fiscal deficits reducing confidence in dollar-denominated assets
- Accelerating de-dollarisation among emerging market central banks shifting reserve composition toward gold
- A transition from the current disinflationary environment into stagflation, followed by potential deflation post-2032
- Geopolitical fragmentation maintaining elevated risk premiums across multiple global theatres
Historically, gold has performed well in both inflationary environments and the early stages of deflationary contractions. It is during the transition between these regimes that the metal typically delivers its most dramatic price appreciation.
The Gold Cycle Indicator: Reading Momentum Below the Surface
What the GCI Actually Measures
The Gold Cycle Indicator (GCI) is a proprietary momentum framework calibrated specifically for the precious metals complex. Unlike conventional technical tools such as the Relative Strength Index or MACD, which are generalised across asset classes, the GCI is designed to identify the exhaustion zones that characterise precious metals cycle behaviour.
The indicator operates across a scale where extreme low readings signal selling exhaustion and extreme high readings signal overbought conditions ripe for correction. On June 25, 2026, the GCI reached a reading of 17, one of the most deeply oversold readings in recent cycle history. As of mid-July 2026, the indicator had recovered to 38, suggesting that momentum is rebuilding from an extreme low but has not yet reached levels that would signal overbought conditions.
This recovery trajectory matters because it implies the market is still in the early-to-middle stage of a momentum recovery, not approaching the upper exhaustion zone. In cycle terms, a GCI reading above 50 would signal that bullish momentum has shifted decisively, representing a meaningful confirmation threshold for investors waiting for further validation.
Silver, Platinum, and Mining Equities: The Broader Picture
Silver's 50% Decline and What History Suggests
Silver's behaviour in the first half of 2026 has been severe by any measure. The metal declined more than 50% from its January 2026 peak before forming what technical analysis identifies as a cycle base. For those unfamiliar with silver's historical volatility, this magnitude of decline is confronting, yet it is consistent with the pattern of prior cycle bottoms.
Silver characteristically underperforms gold during the middle phases of precious metals bull markets and then dramatically outperforms during the final phase. This is partly structural: silver's dual role as both a monetary metal and an industrial commodity means that it is more sensitive to economic growth expectations, which tend to deteriorate during the same period that gold is benefiting from monetary stress. Monitoring the gold-silver ratio analysis provides valuable insight into where silver stands relative to gold within the current cycle.
Long-term price projections for silver within the current bull market framework:
- Conservative scenario: Exceeds $300 per ounce by end of decade
- Extended bull scenario: Reaches $300 to $500 by 2031
- Cycle behaviour: A 50%-plus decline followed by recovery is historically consistent with a durable multi-year floor
Platinum's Structural Case for Gold Parity
Platinum presents one of the more intellectually compelling setups within the precious metals complex. The metal filled a price gap at $1,587 and briefly dipped below the lower boundary of its target zone before stabilising. The thesis gaining traction among technical analysts is that platinum could return to parity with gold, a relationship that held consistently for decades before breaking down in the post-2011 era.
If gold ultimately reaches the $7,000 to $10,000 range projected for the end of the decade, a return to platinum parity would represent extraordinary upside potential from current levels. Platinum's dual classification as both a precious metal and a critical industrial input for hydrogen fuel cell technology adds an additional demand layer that pure monetary metals do not possess.
Mining Equities: Leverage, Cycle Lows, and Confirmation Thresholds
Gold mining equities leverage to underlying metal prices means their earnings sensitivity to gold and silver price movements is amplified relative to holding physical metal. The table below summarises the current cycle positioning of major mining equity indices:
| Index | Probable Cycle Low | First Confirmation | Final Confirmation |
|---|---|---|---|
| GDX (Senior Miners) | $71.89 | Progressive closes above $76.00 | Decisive close above $80.00 |
| GDXJ (Junior Miners) | $93.23 | Progressive closes above $100.00 | Decisive close above $107.50 |
| SILJ (Silver Juniors) | $23.73 | Strong finish above $26.00 | Progressive closes above $28.00 |
A detail worth highlighting is that GDXJ (junior miners) did not reach the lower boundary of its target zone before reversing. In cycle analysis, this is interpreted as a sign of underlying structural strength: the selling pressure was insufficient to push prices to the levels where historically buyers have had to step in by force. Senior miners (GDX) did touch their lower boundary at $71.89 before reversing, a more textbook cycle low pattern.
If gold advances toward the $7,000 range projected over the next 12 to 18 months, the earnings leverage embedded in senior mining producers could be substantial. At higher gold prices, all-in sustaining costs remain relatively fixed while revenue expands dramatically, creating significant margin expansion.
Risk Scenarios: When the Bull Case Breaks Down
The Downside Map
No forecast is complete without a clear articulation of the conditions that would invalidate it. For the bullish gold thesis, the key downside thresholds are:
| Scenario | Trigger | Gold Price Range | Interpretation |
|---|---|---|---|
| Bull Case | Fed cuts, central bank demand, geopolitical risk | $5,000 to $7,000+ | Base case for most institutions |
| Base Case | Gradual recovery, mixed macro signals | $4,400 to $5,200 | Consensus institutional range |
| Bear Case | Dollar strength, hawkish Fed pivot | $3,800 to $4,100 | Tail risk; does not end bull market |
| Extreme Bull | Fiscal crisis, de-dollarisation acceleration | $10,000 to $15,000 | Long-duration scenario by 2030 to 2031 |
A sustained close below $4,100 would signal that the corrective phase has not yet concluded. A break below $3,800 would represent a deeper retracement requiring a reassessment of the cycle framework, though even at that level, it would not necessarily terminate the broader bull market thesis.
The Macro Cycle Through 2036
The broader economic framework within which these gold price projections are embedded anticipates significant regime change over the coming decade. The current disinflationary environment is expected to transition into stagflation, then into a more severe economic contraction beginning around 2030 and potentially extending through 2036. Following that contraction, deflation becomes the dominant risk framework.
This long-duration perspective has important implications for how investors should think about positioning. Gold performs well in inflationary environments and in early deflationary scenarios where its role as a safe haven is most pronounced. However, mining equities may face earnings headwinds during a deep deflationary phase, as input cost advantages are offset by falling revenue if metal prices also decline. Staged positioning across the cycle, rather than concentration at any single point, is the approach most consistent with this framework.
The next major ASX story will hit our subscribers first
What History Says About Gold After Major Mid-Cycle Corrections
Pattern Recognition Across Previous Bull Markets
Post-correction rallies within established gold bull markets have historically produced gains of 30% to 60% from cycle lows. The 2008 to 2011 gold bull market experienced multiple corrections of 15% to 25% before the final advance to $1,900 per ounce. The 2018 to 2020 corrective cycle, which brought gold from approximately $1,360 down to $1,180, was followed by a near-doubling of the gold price within two years.
The structural similarities between those prior mid-cycle pauses and the 2026 correction are meaningful:
- Deeply oversold momentum indicators in all three cases
- Macro catalysts arriving simultaneously with technical bottoms
- Related assets forming concurrent lows, confirming sector-wide capitulation
- Institutional consensus remaining bullish despite near-term price weakness
The World Gold Council's 2026 outlook further reinforces this pattern-recognition framework, highlighting how central bank demand and macro uncertainty have historically supported gold through mid-cycle drawdowns.
Key Metrics to Monitor Going Forward
For investors tracking the gold price forecast the pullback is over higher prices ahead thesis in real time, the following thresholds represent the most important signposts:
- $4,203 – First pivot confirmation for gold price
- $4,380 to $4,400 – Bullish reversal zone requiring successive closes for validation
- $4,620 to $4,880 – Near-term upside targets following breakout confirmation
- GCI reading above 50 – Signals decisively bullish momentum shift
- GDX above $80.00 – Confirms mining sector participation in the next advance
- GDXJ above $107.50 – Final confirmation of junior miner cycle low
In addition, a comprehensive gold price forecast grounded in geopolitical and macroeconomic drivers provides essential context for evaluating whether these confirmation thresholds are likely to be achieved.
Frequently Asked Questions
Is the gold price pullback in 2026 over?
Technical cycle analysis increasingly supports the view that the correction reaching approximately $3,941 on June 30, 2026 represents the cycle low. Confirmation requires successive closes above $4,203, with stronger validation arriving above $4,380 to $4,400.
What is the gold price target for end of 2026?
Institutional projections range from $4,400 (Morgan Stanley) to $6,000 to $6,300 (J.P. Morgan and Yardeni Research). Technical cycle analysis projects a move toward $7,000 within 12 to 18 months under a sustained bull scenario.
Could gold realistically reach $10,000?
Multiple independent frameworks, including Yardeni Research's macro model and technical cycle analysis, project gold reaching $10,000 by 2030, contingent on continued fiscal deterioration, de-dollarisation trends, and sustained central bank accumulation. This long-term scenario is consistent with the gold price forecast the pullback is over higher prices ahead view expressed across major institutions.
What would invalidate the bullish gold forecast?
A sustained break below $4,100, and particularly below $3,800, would signal a deeper corrective phase than the current framework anticipates. A hawkish Federal Reserve pivot or significant and sustained U.S. dollar strengthening represent the primary macro-level risks.
How do mining stocks compare to physical gold in this cycle?
Mining stocks offer leveraged earnings exposure to gold price movements. GDX and GDXJ are forming potential cycle lows, with final confirmation thresholds at $80.00 and $107.50 respectively. If gold advances significantly toward medium-term targets, miners could outperform the metal itself due to margin expansion at higher price levels.
What is silver's role in the current precious metals bull market?
Silver historically amplifies gold's gains in the later stages of precious metals cycles. After declining more than 50% from its January 2026 peak, silver appears to be carving out a significant cycle base, with long-term price targets of $300 to $500 by 2030 to 2031 under the sustained bull scenario. Furthermore, the gold price forecast the pullback is over higher prices ahead narrative is strengthened considerably when silver begins confirming its own cycle low in tandem with gold.
Disclaimer: This article is for informational and educational purposes only and does not constitute financial advice. All price forecasts and targets referenced represent the views of named third-party institutions and analysts and are subject to change. Past price performance is not indicative of future results. Precious metals and mining equities carry significant investment risk, including the potential loss of capital. Readers should conduct their own research and consult a qualified financial adviser before making any investment decisions.
Want to Know the Moment the Next Major Gold or Silver Discovery Hits the ASX?
While institutional analysts debate gold's next price target, Discovery Alert's proprietary Discovery IQ model scans ASX announcements in real time, delivering instant alerts on significant mineral discoveries so subscribers can act ahead of the broader market — begin your 14-day free trial today, or explore Discovery Alert's dedicated discoveries page to see how historic finds in gold, silver, and beyond have generated extraordinary returns for early-positioned investors.