July 3, 2026
When Monetary Policy Meets an Uncooperative World
There are moments in monetary policy history when the tools available to central banks and the problems they face are fundamentally mismatched. Rate hikes work well against demand-driven inflation fuelled by cheap credit and overheating labour markets. They work poorly against supply shocks, geopolitical risk premiums, and energy price spirals driven by forces entirely outside the domestic credit system. The fed next meeting inflation and rate hike odds discussion arrives at precisely this kind of inflection point, where the blunt instrument of interest rate policy is being asked to solve a problem it was never designed to fix.
Understanding what the Federal Reserve will actually do on June 16-17 requires more than reading the headline CPI print. It demands a framework that accounts for monetary aggregates, global liquidity flows, the structural transformation of U.S. energy markets, and a geopolitical landscape reshaping capital allocation in ways the pre-2020 policy playbook never anticipated.
When big ASX news breaks, our subscribers know first
Why the June 2026 FOMC Meeting Carries Unusual Weight
A Crossroads in the Tightening Cycle
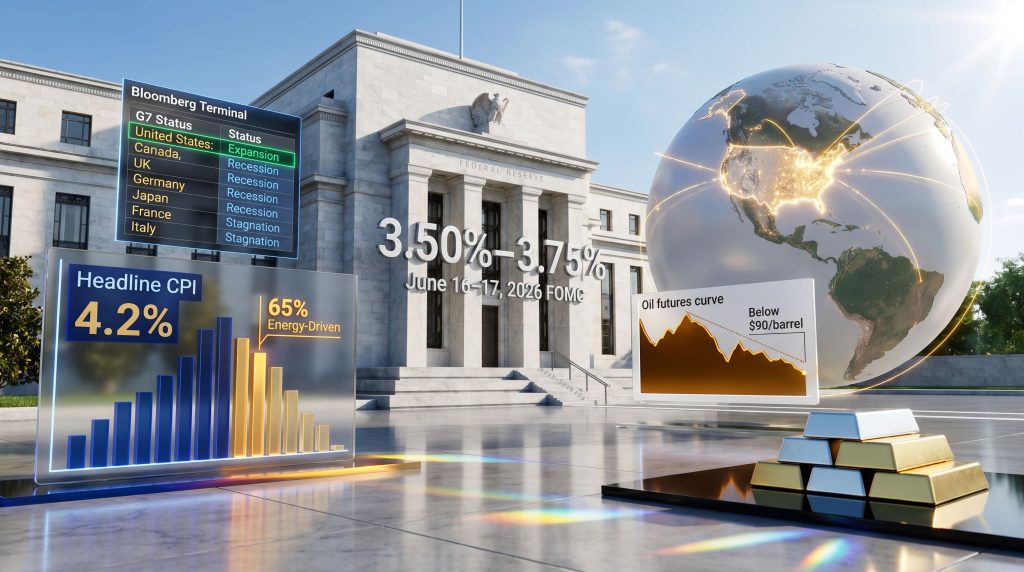
The Federal Open Market Committee heads into its June meeting with the benchmark fed funds rate sitting at 3.50%-3.75%, a level that reflects the accumulated weight of prior tightening cycles but increasingly finds itself stranded between competing macro forces. Three dynamics are colliding simultaneously: headline inflation that has re-accelerated above the Fed's 2% target, a labour market that has demonstrated unexpected resilience, and a global growth picture deteriorating at a pace that makes further tightening genuinely dangerous.
What makes the fed next meeting inflation and rate hike odds discussion particularly complex is the global context surrounding U.S. policy. While U.S. economic activity remains comparatively robust, the broader G7 landscape tells a markedly different story.
| Economy | Current Status |
|---|---|
| United States | Expansion, resilient growth |
| Canada | In recession |
| United Kingdom | Stagnation |
| Germany | Near recession |
| Japan | Bordering recession |
| France / Italy | Stagnation / near stagnation |
Of the eight largest developed economies, the United States stands alone as the one demonstrably growing. This divergence creates an asymmetric risk environment: tightening U.S. monetary policy now risks amplifying the contractionary pressures already gripping allied economies while doing little to address the underlying drivers of domestic inflation.
Kevin Warsh and a Different Policy Temperament
The arrival of a new Fed Chair adds a further layer of complexity. Kevin Warsh is historically associated with balance sheet discipline rather than aggressive rate adjustments, a disposition that shapes how the June meeting is likely to unfold. Markets watching for dramatic policy signals are likely to be disappointed. The more consequential signals will come from how Warsh frames the balance sheet discussion, not whether he reaches for the rate lever.
What the Latest CPI Data Is Actually Telling Markets
Dissecting the 4.2% Headline Figure
The headline CPI print of 4.2% initially rattled markets before a more granular reading provided important context. Core CPI, which strips out volatile food and energy components, came in below expectations, a meaningful signal that underlying price pressures across the broader economy may be moderating rather than accelerating.
The critical data point that reshapes the entire policy debate: 65% of the headline CPI increase was attributable to energy prices alone. Strip out that energy component, and the implied CPI figure drops to approximately 1.7%, a reading that would generate no serious discussion of rate hikes whatsoever.
Key Analytical Point: The headline inflation number that triggered alarm across financial media was not, in substance, a broad-based consumer price problem. It was an energy price event dressed up as a monetary policy emergency.
Why Energy Inflation Creates a Policy Trap
The nature of the inflation driver matters enormously for policy design. Rate hikes operate through the credit channel: they raise borrowing costs, cool demand, slow investment, and eventually reduce price pressures where demand is the primary driver. What rate hikes cannot do is:
- Increase crude oil production capacity
- Reduce geopolitical risk premiums embedded in energy contracts
- Fix supply chain disruptions in commodity markets
- Resolve freight cost pressures originating from international logistics bottlenecks
| Inflation Driver | Fed's Ability to Influence | Policy Implication |
|---|---|---|
| Energy (oil/gas prices) | Very limited | Rate hikes do not reduce oil supply |
| Core services inflation | Moderate | Rate-sensitive via credit and demand |
| Wage-driven inflation | Moderate | Responds to labour market cooling |
| Geopolitical risk premium | None | Outside monetary policy scope |
Crude oil price trends have since corrected below $90 per barrel, with forward-looking commodity indicators, including freight charges and raw material input costs, also trending lower. Analysts tracking these dynamics argue that the June CPI print could show a substantial deceleration, which is a primary reason market consensus currently prices a near-zero probability of a rate hike at this meeting.
Fed Next Meeting: What Are the Real Rate Hike Odds?
What CME FedWatch Is and Is Not Telling Us
Tools such as CME FedWatch and the Atlanta Fed Market Probability Tracker convert federal funds futures pricing into implied policy probabilities. Their current reading assigns an overwhelming probability to a hold at 3.50%-3.75%, with a rate hike probability sitting effectively at zero in consensus market pricing.
However, treating that zero as a definitive answer misreads the nuance of the current environment. Economists with a more granular view of the data argue the true hike probability is low but not zero, for reasons the headline data obscures.
The Case for a Non-Zero Hike Probability
Several factors support a minority view that the Fed's calculus is more finely balanced than futures markets suggest:
- Labour market resilience – Employment data that appeared sluggish in early 2026 strengthened rapidly through February and March, even against the backdrop of elevated geopolitical risk
- Beige Book reversal – Initial softness in jobless claims and ADP employment figures reversed sharply, removing what had been a key argument for the hold camp
- Structural inflation persistence – A subset of FOMC participants holds that underlying price pressures are more persistent than month-on-month headline readings indicate
- Unemployment below historical average – Labour force participation and overall unemployment remain below the 2018-2019 average, suggesting the employment mandate is essentially satisfied
The Monetary Aggregates Framework: A More Sophisticated Policy Lens
Rather than anchoring the analysis solely to CPI and unemployment, a more sophisticated approach examines the three pillars of monetary conditions simultaneously:
- M2 Money Supply Growth has stalled in recent months, indicating reduced inflationary fuel moving through the pipeline
- Money Velocity has softened slightly, signalling that even the existing money supply is circulating less actively through the economy
- Credit Growth is not expanding at the pace a genuinely robust economic expansion would typically produce
Analytical Callout: When money supply growth stalls, money velocity weakens, and credit growth plateaus at the same time, the traditional justification for rate hikes becomes difficult to sustain, regardless of what headline inflation figures suggest on their surface.
What Happens If the Fed Hikes in June? A Risk Scenario Analysis
The Credit Transmission Problem
The mechanical discussion around a 25 basis point hike tends to focus on its direct cost impact. That framing misses the more consequential risk. At the current rate level, a further hike does not simply raise borrowing costs by a small margin. It changes bank behaviour.
When the spread between government bond yields and the risk-adjusted return on commercial lending narrows or disappears, banks face a rational economic incentive to hold government securities rather than extend credit to businesses and households. The result is not a marginal tightening. It is a potential credit contraction that disproportionately impacts small and medium enterprises (SMEs), which lack access to capital markets and depend almost entirely on bank lending for operational and growth financing.
Scenario Model: A 25bps hike that triggers even a 5-8% contraction in SME bank lending over the following two quarters would likely generate downstream employment and consumer spending impacts that more than offset any inflation reduction achieved, particularly given that energy-driven CPI is already correcting independently of monetary policy.
Rate Hikes Cannot Solve an Energy Problem
Tightening monetary policy in response to an energy-price-driven headline inflation number creates a specific category of policy error: it punishes credit-dependent sectors of the domestic economy for a price shock they did not cause and cannot control. Furthermore, the broader effects of trade wars and supply chains on commodity pricing sit entirely outside the reach of the federal funds rate. This asymmetry sits at the core of the institutional economist argument for holding rates steady.
What Kevin Warsh Is Expected to Communicate on June 17
Reading Between the Lines of the Press Conference
Market participants searching for dramatic signals at Warsh's first major press conference as Fed Chair are likely to find a deliberately measured tone. The expectation among economists is that his statement will:
- Emphasise that core inflationary pressures remain subdued
- Describe the labour market as solid but facing specific challenges
- Avoid any language that could be read as politically directional in either direction
- Signal commitment to prudent policy normalisation without telegraphing aggressive moves
The Balance Sheet: The Real Policy Signal
The more important policy question at the June meeting may not be the rate decision at all. It concerns the Fed's balance sheet, which has expanded significantly in recent months with estimates of approximately $600 billion in indirect and direct liquidity support referenced by liquidity researchers tracking Fed operations.
The structural context here is important. U.S. Treasury auctions are currently coming in at 2.3x to 2.5x oversubscribed, indicating exceptionally robust global demand for U.S. sovereign debt. This demand environment creates a rare opportunity to accelerate balance sheet normalisation without disrupting broader liquidity conditions.
Strategic Insight: Accelerating balance sheet reduction while holding rates steady represents an optimal policy combination for the June meeting. It tightens financial conditions at the margin, signals policy credibility to global markets, and avoids the blunt-force credit transmission risks of a formal rate hike.
This approach aligns with Warsh's historically documented preference for balance sheet discipline and provides a mechanism for meaningful normalisation that does not require the political and economic risks of a rate move.
The next major ASX story will hit our subscribers first
Global Liquidity Dynamics and the Dollar's Dominant Position
Why U.S. Assets Are Capturing the World's Liquidity
The unusual market configuration observed in recent months, specifically, equities near record highs while bonds, gold as a safe haven, and silver underperform simultaneously, reflects something larger than domestic policy dynamics. Global money supply growth is not a purely American phenomenon. The Eurozone is expanding money supply at roughly three times the pace of its underlying economic growth.
China is generating substantial monetary expansion. Consequently, this global liquidity surge, combined with a risk-off mentality driven by geopolitical concerns, means a disproportionate share of that capital is concentrating in U.S. dollar-denominated assets. This explains the S&P 500 and NASDAQ remaining near record highs even as other asset classes struggle.
The Dollar-Oil Correlation Reversal
One of the most structurally significant shifts in global commodity markets is the breakdown of the traditional inverse relationship between the U.S. dollar and crude oil prices. Historically, a stronger dollar correlated with lower oil prices, as oil is dollar-denominated and a stronger currency effectively makes oil cheaper for foreign buyers, reducing demand.
That relationship has fundamentally changed because the United States has become the world's largest oil and gas producer and exporter. The dollar now benefits simultaneously from safe-haven capital flows and from petrodollar recycling as U.S. energy exports generate foreign exchange revenues that flow back into dollar-denominated assets. Dollar strength and oil price strength are no longer in opposition. They can reinforce each other.
Dedollarisation: A Bull Market Construct Confronting Reality
Why the Thesis Has Effectively Stalled
The dedollarisation narrative that dominated much of the 2022-2024 financial commentary, anchored in BRICS reserve diversification strategies and yuan-denominated energy trade agreements, has encountered a fundamental stress test. Declining trust in the US dollar was widely predicted, yet the verdict from that stress test is instructive.
In periods of acute geopolitical and financial stress, developing economies consistently revert to U.S. dollars for transactions, debt servicing, and reserve management. The practical experience of countries navigating currency crises, oil import obligations, and sovereign debt pressures revealed that yuan, rubles, and rupees lack the liquidity depth, legal security, and convertibility that dollar infrastructure provides when conditions deteriorate.
Reports of countries in Southeast Asia facing dramatically elevated effective oil prices during the 2026 geopolitical escalation illustrated in stark terms what dedollarisation theorists had underweighted: liquidity disappears precisely when it is most needed, unless it is denominated in dollars.
Key Takeaway: Dedollarisation was structurally a bull market construct. It assumed perpetual stability and failed to account for the moment when developing economies face genuine payment pressure and discover that alternative currencies cannot perform the functions the dollar performs under stress.
The Gold-as-Transaction-Medium Experiment
China's efforts to establish physical gold vaults in strategic partner locations, including arrangements in Saudi Arabia, represent an attempt to offer convertibility assurance to trading partners without requiring full capital account liberalisation. The premise is logical: if yuan-denominated transactions are backed by accessible physical gold, counterparties have greater assurance of value.
However, the execution faces formidable practical barriers. Storage logistics, cross-border legal complexity, settlement infrastructure, and the sheer physical inconvenience of large-scale gold transactions make meaningful monetary substitution highly impractical at scale. Furthermore, the gold-bond dynamics at play suggest that central banks reducing treasury holdings to accumulate gold are likely to resume that accumulation trend once geopolitical risk premiums normalise.
Oil Price Outlook: Technical and Fundamental Warning Signs
A Chart Structure That Demands Caution
The crude oil futures market is generating multiple technical warning signals that experienced commodity traders describe as particularly concerning. The futures curve is in deep backwardation, a structure where near-term contracts trade at a premium to long-dated ones, and that backwardation has been steepening while the back end of the curve falls. This is not a bullish structure.
Price momentum shows a classic bearish configuration:
- Each successive price high is lower than the preceding high
- Each successive price low is lower than the preceding low
- Geopolitical headlines that previously triggered significant price spikes are generating increasingly muted market reactions, signalling that the risk premium embedded in oil is deflating
The Overleveraged Position Risk
A structural vulnerability exists in current oil market positioning that may amplify any downside move beyond what fundamentals alone would justify. A significant volume of leveraged long crude oil positions were established at price levels around $95 per barrel, substantially above current prices. As these positions generate margin pressure, forced liquidation could create a self-reinforcing downside spiral.
This dynamic mirrors what drove the gold sell-off earlier in the year, when an accumulation of heavily leveraged bullish positions unwound rapidly once equity drawdowns triggered margin calls across portfolios. The oil market may be approaching a similar inflection point.
Risk Warning: The combination of bearish price momentum, a deteriorating technical structure, overleveraged long positioning entered at elevated prices, and a deflating geopolitical risk premium creates conditions for a potentially sharp and disorderly downside move in crude oil prices. Technical analysis of key support levels suggests that a breach of critical support could produce a move of considerable magnitude, with limited natural price floors immediately visible below current levels.
Investment Strategy Implications for the Current Macro Environment
Navigating the Post-FOMC Landscape
The broader investment positioning framework that emerges from this macro analysis reflects several intersecting themes:
| Asset Class | Near-Term Outlook | Rationale |
|---|---|---|
| U.S. Equities (profitable tech) | Constructive | Global liquidity concentration in USD assets |
| Defensive / Value Equities | Selectively attractive | Earnings resilience and re-rating potential |
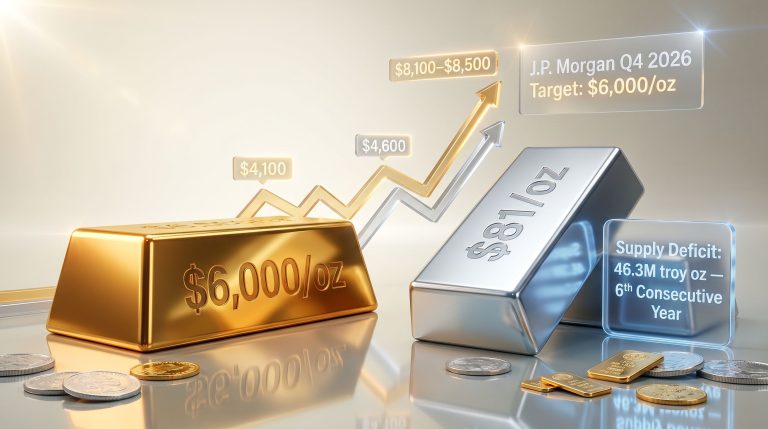
| Gold and Silver | Accumulate on weakness | Long-term money supply growth and sovereign debt expansion |
| Sovereign Bonds (long duration) | Underweight | Persistent inflation risk and balance sheet normalisation |
| Crude Oil | Cautious / reduce exposure | Bearish momentum and overleveraged positioning |
| U.S. Dollar | Reduce net long | Geopolitical risk premium likely to fade |
The Sovereign Debt Maturity Wall
A significant and underappreciated inflation catalyst is building in the background of the Fed debate. A substantial volume of developed-economy sovereign debt is approaching maturity in the coming months. Refinancing obligations at current interest rate levels will require either new issuance at elevated yields or some form of central bank accommodation, both of which carry inflationary implications through different transmission channels.
This dynamic forms the structural foundation for a long-term constructive view on gold and silver as hedges against monetary debasement, even where near-term price action remains choppy due to temporary liquidity drains.
Mega-IPO Events as Temporary Liquidity Drains
Near-term pressure on gold, silver, and other risk assets is partly explained by a phenomenon that receives insufficient attention in mainstream commentary. Large-scale IPO events of the magnitude seen in mid-2026, including valuations in the $1.77 trillion range with capital raises of approximately $75 billion, absorb significant investable capital in concentrated windows of time. This creates genuine near-term selling pressure across asset classes as global investors reallocate portfolios to participate.
Once these capital allocation events resolve, historical patterns suggest a normalisation of investment positioning, with previously undervalued or overlooked assets potentially recovering as liquidity returns to broader market circulation. Economists view these temporary dislocations as accumulation opportunities for long-term holders of precious metals and quality equities rather than signals of structural breakdown.
Frequently Asked Questions: The June 2026 FOMC Meeting
When is the next Fed meeting?
The Federal Open Market Committee is scheduled to meet on June 16-17, 2026. The rate decision and accompanying press conference will take place on June 17. You can verify the full schedule via the Federal Reserve's official FOMC calendar.
What is the current Fed funds rate?
The benchmark policy rate currently stands at 3.50%-3.75%, unchanged from the prior meeting cycle.
Will the Fed raise rates at the June 2026 meeting?
Market-implied probability tools currently assign a near-zero probability to a June rate hike. However, economists note the true probability is not zero. The labour market's unexpected resilience and the persistence of headline inflation mean a minority of FOMC participants may advocate for tightening. The consensus, supported by monetary aggregate analysis and the energy-driven nature of recent CPI data, strongly favours a hold. The fed next meeting inflation and rate hike odds, as priced by futures markets, reflect this overwhelming lean toward inaction.
What could force an unexpected rate hike?
A surprise acceleration in core CPI, a significant rebound in wage growth data, or a sharp deterioration in long-term inflation expectations could shift the calculus toward a hike. The current trajectory of energy prices, money supply growth, and credit conditions argues against this outcome at the June meeting.
What is the Fed likely to do with its balance sheet?
Given that Treasury auctions are coming in at 2.3x to 2.5x oversubscribed, the June meeting may see signals of accelerated or at minimum maintained balance sheet normalisation. This approach would allow the Fed to tighten financial conditions at the margin without deploying the rate lever and its associated credit transmission risks.
How does the stalling dedollarisation trend affect the Fed's options?
A reversal in dedollarisation momentum reinforces global demand for dollar-denominated assets, reducing the urgency of aggressive rate tightening to defend the currency. The dollar's demonstrated dominance under geopolitical stress strengthens the Fed's flexibility to prioritise domestic economic stability over currency defence.
Key Signals to Watch at the June 16-17 FOMC Meeting
- Rate decision: An overwhelming consensus expects a hold at 3.50%-3.75%. Dissenting votes, if any emerge, will be closely scrutinised for signals about internal FOMC dynamics
- Press conference tone: Expect measured language emphasising core inflation moderation, a nuanced labour market assessment, and a deliberate absence of political signalling in either direction
- Balance sheet guidance: Any signal of accelerated normalisation would represent a meaningful hawkish development that does not require a rate hike
- Dot plot revisions: Upward adjustments to the 2026 rate path would signal that rate cuts remain firmly off the table and that the hiking cycle may not be fully concluded
- Energy inflation framing: Given that approximately 65% of the recent CPI acceleration was energy-driven, how Warsh characterises that dynamic will reveal whether the Fed views the current inflationary episode as transitory energy disruption or something more persistent
- Forward guidance language: Any shift in the conditionality of future decisions will be parsed carefully by bond markets, currency traders, and equity investors simultaneously
The fed next meeting inflation and rate hike odds may appear settled at first glance, yet the layered macro dynamics outlined above confirm that the June 2026 FOMC meeting carries genuine complexity beneath its seemingly straightforward surface.
Readers seeking additional perspectives on Federal Reserve policy, inflation dynamics, and global macro strategy may find value in financial commentary available through the Soar Financially YouTube channel, where discussions with institutional economists and market strategists covering these themes are regularly published.
Want to Know Which ASX Discoveries Could Thrive in a Shifting Rate Environment?
Discovery Alert's proprietary Discovery IQ model delivers real-time notifications on significant ASX mineral discoveries, instantly translating complex data across 30+ commodities into clear, actionable insights for investors navigating today's volatile macro landscape. Explore how historic mineral discoveries have generated extraordinary returns on Discovery Alert's dedicated discoveries page, and begin your 14-day free trial today to position yourself ahead of the market.