July 3, 2026
The Hidden Architecture of Real Interest Rates and Hard Asset Demand
Every major gold bull market in modern financial history has shared a common structural foundation: the erosion of real interest rates. Understanding this mechanism is more useful than tracking any short-term price move, because it explains not just what gold does, but why it does it at the precise moments it does.
The real interest rate is the return an investor earns on fixed-income assets after adjusting for inflation. When that figure turns negative, the fundamental argument against holding gold collapses entirely. Gold pays no yield, but neither does cash when inflation is consuming its purchasing power faster than interest can replace it. That basic arithmetic has driven more capital into precious metals than any geopolitical crisis or central bank announcement ever could.
What makes the current environment particularly instructive is not just that real rates have been volatile, but that the expectations around them have been shifting dramatically and in short timeframes. That volatility is the engine driving gold's extraordinary price swings in both directions.
When big ASX news breaks, our subscribers know first
How the Fed Pivot and Gold Rally Became the Defining Trade of This Cycle
The sequence of events that produced gold's historic run deserves careful reconstruction, because the popular narrative glosses over the structural forces underneath the headlines.
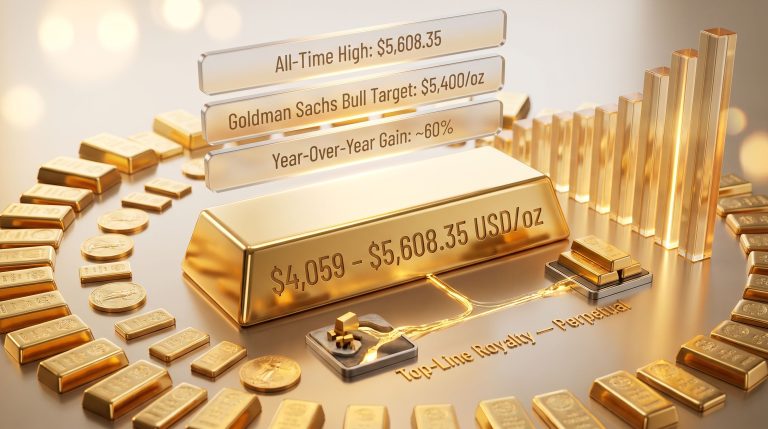
Gold's surge to a record high above $4,470 per ounce during 2025 was not primarily a fear trade or a geopolitical hedge. It was the direct consequence of a Federal Reserve pivot toward rate cuts colliding with a weakening US dollar at a moment when central banks globally were aggressively accumulating the metal. The three forces arrived simultaneously, compressing available supply while expanding demand from multiple directions at once.
The following table illustrates how each key market variable contributed to both the 2025 surge and the subsequent 2026 correction:
| Market Variable | 2025 Surge Effect | 2026 Correction Effect |
|---|---|---|
| Fed Policy Stance | Rate cuts reducing yields | Rate hike expectations returning |
| US Dollar Index | Declining, boosting global demand | Strengthening, suppressing prices |
| Core PCE Inflation | Elevated but falling, dovish Fed | Sticky at ~3.4%, hawkish signal |
| Central Bank Buying | Aggressive accumulation globally | Continued buying offset by ETF outflows |
| Institutional Sentiment | Bullish inflows, momentum-driven | Bearish rotation, technical breakdown |
| Geopolitical Risk Premium | Elevated safe-haven demand | Partial easing reducing urgency |
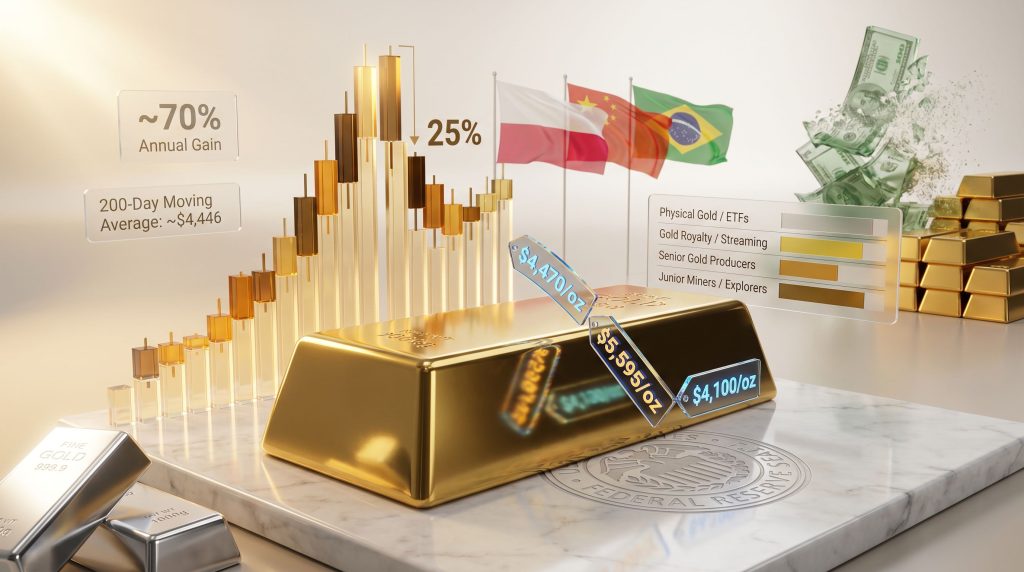
From its January 2026 peak of $5,595 per ounce, gold declined approximately 25% into a range of $4,022 to $4,200. The metal also breached its 200-day moving average, now acting as resistance at approximately $4,446 — a widely monitored technical threshold that institutional trading desks use to assess trend health. Year-to-date in 2026, gold is down approximately 3%, a figure that reads as transition rather than breakdown when viewed against the longer cycle.
What the New Fed Chair's Portugal Comments Actually Triggered
At the European Central Bank's annual forum in Portugal, Federal Reserve Chair Kevin Warsh indicated that inflation risks had moderated. This single statement was characterized by JPMorgan's trading desk as sufficient to reignite the debasement trade — the thesis that dollar purchasing power will decline and hard assets will appreciate relative to fiat currency.
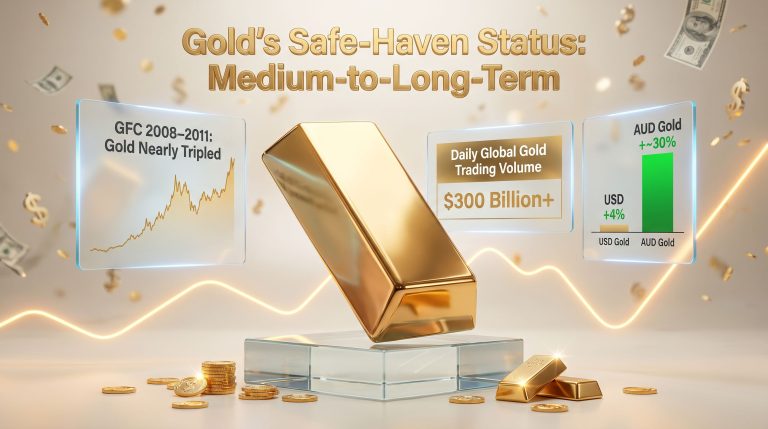
Gold's response was immediate: a move above $4,100 per ounce representing more than 2% in a single session. Silver outperformed gold during this move, rising approximately 4% — consistent with silver's well-documented historical pattern of lagging the initial trend before accelerating once momentum is confirmed.
The jobs data released shortly after reinforced the pivot narrative. Only 57,000 new jobs were created against consensus expectations of approximately 113,000, while labour force participation fell to a five-year low. Markets rapidly repriced the probability of a July rate hike downward, and the US dollar recorded its worst single-session performance in two months. For gold, this combination of a softening labour market and a central bank chair signalling reduced inflation concern represents precisely the macro setup that has historically produced the most sustained precious metals advances.
A Fed pivot delivers two bullish catalysts for gold simultaneously: it reduces the yield appeal of competing assets and weakens the dollar, lowering the opportunity cost of holding gold while increasing its purchasing power appeal to international buyers.
Why Gold's Worst Quarter in 13 Years Is the Wrong Frame Entirely
When gold finished a recent quarter down approximately 13% — its worst three-month performance in over 13 years — financial media moved quickly to declare the bull market over. That framing deserves significant scrutiny. According to The Australian, gold's steep quarterly decline followed directly from Federal Reserve commentary, underscoring how sensitive the metal remains to central bank signalling.
Historical precedent, however, offers a far more instructive lens. During the 1970s inflationary cycle, gold fell 50% over nine months, dropping from approximately $200 per ounce to $100 per ounce. The investor community that capitulated at that trough missed one of the most significant wealth-building opportunities of the 20th century: a subsequent recovery from $100 to $850 per ounce over six years — a move of 750% from the correction low.
The deeper lesson from that cycle is rarely discussed: investors who liked gold at $200 abandoned it at $100, selling precisely when the structural case was strengthening, not weakening. The short-term price and the long-term thesis were pointing in completely opposite directions.
During the 1970s inflationary era, the US dollar lost approximately 75% of its purchasing power over a decade. Gold moved from $35 per ounce to $850 per ounce over that same period — not because gold became intrinsically more valuable, but because the dollar became dramatically less so.
This framework, drawn from analysis by experienced multi-cycle resource investors, suggests the directional argument for gold does not require precise price targets to be actionable. Furthermore, if the dollar loses 50 to 75% of its purchasing power over the next decade — a scenario that finds historical precedent and is supported by current fiscal trajectories — gold's role as a safe haven and inflation preserver becomes its primary investment thesis regardless of short-term volatility.
The Divergence That Western Investors Missed
While Western retail and institutional investors were reducing gold ETF exposure across two consecutive months of outflows, the world's central banks never stopped buying. This divergence between speculative positioning and structural accumulation is one of the most analytically significant signals in the current cycle.
Central bank purchasing represents sovereign-level conviction about long-term dollar debasement. It is largely price-insensitive and strategically motivated — buyers at this level are not trading momentum or reacting to quarterly performance data. The major buyers include Poland, China, and Brazil, among others, reflecting a geographically distributed consensus among reserve managers about the long-term trajectory of dollar-denominated assets.
Portfolio managers overseeing multi-billion-dollar wealth management mandates have identified this divergence as the most structurally bullish feature of the current gold market. Consequently, the average North American and Western retail investor has not yet returned to gold in meaningful size, which suggests the demand ceiling for this cycle remains well above current levels.
The Bond Market Signal That Matters More Than the Gold Price
Experienced fixed-income and macro investors with significant assets under management consistently identify the bond market, rather than the gold price itself, as the primary timing indicator for precious metals positioning. The relationship between gold and bond dynamics across economic cycles makes this signal particularly reliable for longer-term investors.
The mechanism runs through what markets call bond vigilantes — large institutional holders of government debt who begin selling when they lose confidence in a government's fiscal management. When that selling accelerates, long-end yields rise not because of economic strength but because of credibility erosion. This is the environment where gold's upside potential accelerates most dramatically, because it signals that the market is withdrawing confidence from the sovereign currency system itself.
The current environment features Core PCE inflation at 3.4%, which sits above the Fed's 2% target and constrains how aggressively the central bank can pivot toward easing. This tension between political pressure to cut rates and the inflation constraint is itself a signal worth monitoring. Historically, the resolution of that tension has favoured short-term political considerations over long-term currency stability — and that resolution is what drives the most powerful phases of gold bull markets.
Reading Yield Curve Signals for Gold Positioning
The yield curve provides two distinct bullish pathways for gold, through different mechanisms:
- Inverted yield curve: Signals economic stress and anticipates rate cuts. Historically bullish for gold as real yields move lower.
- Steepening yield curve driven by long-end selling: Signals rising inflation expectations and declining dollar credibility. Also bullish for gold, but through a different channel — fiscal stress rather than growth weakness.
- Key distinction: Gold responds to the direction of real yields, not the level of nominal yields. A nominal yield of 5% with inflation running at 5.5% is structurally equivalent to a zero-yield environment for gold positioning purposes.
- Monitoring tool: When institutional capital rotates from growth sectors into utilities, consumer staples, and healthcare, it signals defensive repositioning — a precursor to broader safe-haven demand that often precedes gold's strongest moves.
Are Gold Mining Stocks the Most Mispriced Asset in the Market?
One of the most analytically striking features of the current cycle is the gap between gold's actual price and the price implied by gold mining equity valuations. Research from Bank of America has identified that gold mining stocks are currently priced as though gold trades at approximately $3,350 per ounce — hundreds of dollars below where the metal is actually changing hands.
This discount creates a logical question: is the equity market anticipating a major gold price correction, or has it simply failed to reprice to reflect sustained elevated metal prices? For investors constructive on gold through the latter part of this decade, this valuation gap represents a potentially significant asymmetric opportunity.
The operational leverage inherent in mining equities amplifies this dynamic considerably:
When gold prices rise substantially, mining company free cash flow expands at a disproportionate rate because production costs are largely fixed. A $500 per ounce increase in the gold price can translate into a far larger percentage increase in earnings per share than the metal move alone would suggest — the mechanism that historically drives mining stocks to outperform physical gold in the later stages of bull markets.
Comparing Investment Vehicles Across the Gold Exposure Spectrum
| Investment Vehicle | Gold Price Sensitivity | Operational Risk | Bull Market Leverage |
|---|---|---|---|
| Physical Gold / ETFs | Direct (1:1) | None | Low |
| Gold Royalty / Streaming | High (leveraged) | Low | High |
| Senior Gold Producers | High (leveraged) | Medium | High |
| Junior Miners / Explorers | Very High | Very High | Very High |
Why Royalty and Streaming Companies Occupy a Structurally Distinct Position
Royalty and streaming companies provide upfront capital to mine developers in exchange for the right to purchase a fixed percentage of future production at predetermined prices. This model delivers gold price upside while significantly reducing exposure to the operational risks that erode returns in direct mining investments: cost inflation, equipment failures, workforce disruptions, and capital expenditure overruns.
Major operators in this space — including Wheaton Precious Metals and Franco-Nevada — are frequently cited by experienced resource investors as the preferred vehicle for those seeking gold exposure with structurally lower volatility. For investors who want to participate in the leveraged upside of gold's next move without accepting the binary risk profile of junior miners, the royalty and streaming segment offers a compelling middle ground.
Silver's Behavioural Pattern and What It Confirms About Precious Metals Momentum
Silver's recent session performance — rising approximately 4% while gold moved 2% — is not merely a coincidence. It reflects a well-documented behavioural pattern: silver characteristically underperforms gold in the early stages of a precious metals advance before accelerating sharply once broader momentum is established.
Technical analysis of silver's current chart structure suggests potential retracement toward $40 per ounce as a high-conviction re-entry zone for longer-term positioning, with upside scenarios extending to $165 to $175 per ounce if structural momentum develops. These targets carry significant uncertainty and should be understood as scenario-based projections rather than forecasts.
The gold-to-silver ratio — measuring how many ounces of silver are required to purchase one ounce of gold — provides a secondary valuation signal. Historically elevated ratios, indicating silver cheapness relative to gold, have preceded periods of silver outperformance. Monitoring this ratio alongside the directional trend in real yields gives precious metals investors a more complete picture of positioning timing.
The next major ASX story will hit our subscribers first
Three Scenarios for Gold Through Year-End 2026
The path forward for gold is not singular. Three distinct scenarios define the range of outcomes for the second half of 2026, each with different probability drivers and investment implications:
Scenario 1: Fed Capitulation (Most Bullish)
- Deteriorating labour market forces emergency rate cuts before year-end
- Dollar weakens materially; real rates fall below zero
- Gold targets $5,000 per ounce; mining equities re-rate significantly higher
- Probability driver: unemployment acceleration, credit market stress
Scenario 2: Extended Consolidation (Base Case)
- Fed holds rates steady as sticky inflation prevents a decisive pivot
- Gold consolidates in the $4,000 to $4,300 range
- Mining equities remain discounted; central bank buying provides a price floor
- Probability driver: Core PCE remaining above 3%, resilient labour market data
Scenario 3: Liquidity Shock (Near-Term Bearish, Medium-Term Bullish)
- A technology or AI sector correction triggers broad margin calls
- Gold is sold first as a liquid asset; short-term decline toward $3,600
- Policy response of quantitative easing and rate cuts subsequently drives gold sharply higher
- Probability driver: credit market deterioration, tech sector leverage unwinding
It is worth noting that in a liquidity-inspired market crack, selling is not driven by investors making rational decisions — it is driven by margin requirements forcing liquidation of whatever assets carry a tradeable bid. Gold, as one of the world's most liquid assets, often finds itself sold in the first wave of deleveraging even when the macroeconomic case for owning it is strengthening. The subsequent policy response — historically without exception involving artificially low interest rates and asset purchase programmes — then becomes the most powerful catalyst for gold's recovery and advance. Indeed, gold and silver have historically rallied most forcefully precisely when the Fed pivots back toward easing.
Across all three scenarios, the structural debasement thesis for gold resolves constructively over a two to five year horizon if fiscal trajectories continue along their current path. The primary variable is not direction but timing.
Early Warning Indicators Worth Monitoring
- Bond market behaviour: Rising long-end yields driven by selling pressure rather than growth optimism signal fiscal stress — historically the most powerful gold catalyst
- Sector rotation patterns: Sustained capital flows from technology into utilities, consumer staples, and healthcare indicate institutional risk reduction and precede safe-haven demand
- Dollar Index trend: A sustained break below key technical support levels removes the primary headwind for gold
- ETF flow reversal: Western institutional money returning to gold ETFs after the recent outflow cycle would confirm a trend change
- Fed communications: Any shift in language toward labour market concern over inflation concern signals the pivot is approaching
- Silver outperformance: When silver begins consistently outpacing gold on up-days, it historically signals that the broader precious metals trend has matured and is attracting wider participation
Frequently Asked Questions: Fed Pivot and Gold Rally
What exactly is a Fed pivot and why does it matter for gold?
A Fed pivot refers to a change in the Federal Reserve's monetary policy direction, typically from raising interest rates to cutting them. This matters for gold because lower rates reduce the yield advantage of bonds and cash, making gold comparatively more attractive. A pivot also typically weakens the US dollar, which increases gold's purchasing power appeal to international buyers and amplifies demand simultaneously from multiple directions.
Why did gold fall 25% from its peak despite the bullish macro narrative?
Gold's correction from its January 2026 peak reflects a shift in rate expectations rather than a change in the underlying debasement thesis. When economic data came in stronger than anticipated and inflation remained sticky, markets repriced the probability of rate cuts downward, strengthening the dollar and reducing gold's near-term appeal. Structural buyers continued accumulating throughout this period, but speculative positioning unwound sharply.
What is the debasement trade?
The debasement trade is an investment thesis built on the expectation that government fiscal deficits, debt monetisation, and quantitative easing will progressively erode the purchasing power of fiat currencies. Investors positioned for debasement typically hold gold, silver, and real assets as a hedge against this erosion, with the thesis gaining conviction as fiscal trajectories become increasingly difficult to reverse.
How do gold mining stocks differ from owning physical gold?
Physical gold provides direct, one-to-one exposure to the gold price with no counterparty risk. Gold mining stocks offer leveraged exposure: when gold prices rise, mining company profits can increase disproportionately because production costs are largely fixed. However, mining stocks carry additional risks including operational challenges, management quality, geopolitical risk in mining jurisdictions, and capital allocation decisions that can significantly diverge from the metal's own performance.
Why does the bond market matter more than the gold price for timing?
The bond market reflects institutional confidence in government fiscal management. When that confidence erodes and bond vigilantes begin selling long-dated government debt, it signals a loss of faith in the sovereign currency system — the precise environment where gold's upside potential accelerates most dramatically. The gold price itself is a lagging expression of conditions that the bond market prices first.
Key Takeaways: Structuring a View on the Fed Pivot and Gold Rally
- The 2025 fed pivot and gold rally were directly linked through the real interest rate mechanism, with gold surging above $4,470 per ounce as rate cuts, dollar weakness, and central bank accumulation converged simultaneously
- The 2026 correction to $4,022 to $4,200 reflects reversed rate expectations, not a structural change in the debasement thesis that underpins the long-term bull case
- Gold's 200-day moving average at approximately $4,446 now acts as resistance; a sustained break above this level would signal trend resumption to technically-oriented market participants
- Mining equities priced as though gold trades at ~$3,350 per ounce represent a potentially significant valuation discount relative to current spot prices
- The bond market, not the gold price itself, is the most reliable leading indicator for the next major precious metals move
- Silver's outperformance during recent sessions is consistent with its historical pattern of lagging then accelerating, providing secondary confirmation of precious metals momentum
- All near-term scenarios eventually resolve constructively for gold if the structural debasement framework is correct; the critical variable for investors is positioning sizing and time horizon management
Disclaimer: This article is intended for informational and educational purposes only and does not constitute financial advice. All price targets, scenario projections, and forward-looking statements involve significant uncertainty and should not be relied upon as the basis for investment decisions. Past performance in any asset class, including gold and gold mining equities, does not guarantee future results. Readers should consult qualified financial professionals before making any investment decisions.
Want to Know When the Next Major ASX Mineral Discovery Hits the Market?
Discovery Alert's proprietary Discovery IQ model scans ASX announcements in real time, delivering instant alerts on significant mineral discoveries — turning complex data across more than 30 commodities into clear, actionable opportunities for both short-term traders and long-term investors. Explore historic discoveries and their exceptional returns, then begin your 14-day free trial at Discovery Alert to position yourself ahead of the broader market.