June 21, 2026
Why Ferro-Chrome Pricing Defies Commodity Convention
Commodity markets are built on standardisation, yet ferro-chrome has always operated by a different set of rules. Understanding ferro-chrome pricing methodology matters not just for traders and procurement professionals but for anyone attempting to interpret cost structures in the stainless steel supply chain. While iron ore trades in dollars per dry metric tonne and copper moves in dollars per metric ton of refined metal, ferro-chrome pricing is denominated in US dollars per pound of contained chromium within the alloy. This is not a quirk of tradition but a reflection of economic logic: the end-user is buying chromium atoms destined for a stainless steel melt.
Furthermore, the stainless steel market relies heavily on this pricing framework to assess chromite mining economics and evaluate the competitive position of ferro-chrome producing regions. The way price benchmarks are constructed, validated, and governed shapes how billions of dollars of physical commodity contracts are settled each year.
When big ASX news breaks, our subscribers know first
The Chromium-Unit Pricing Foundation
The $/lb Cr denomination normalises transactions across a market where alloy grades vary substantially. A shipment of 50% Cr ferro-chrome and a shipment of 67% Cr ferro-chrome cannot be meaningfully compared on a per-tonne basis because the chromium delivery efficiency is entirely different. By expressing price per pound of contained chromium, buyers and sellers immediately understand the cost of acquiring each chromium unit regardless of the physical alloy grade being traded.
This convention carries a deeper implication for how ferro-chrome is positioned within the wider ferroalloy market. Unlike ferro-manganese or ferro-silicon, where the alloy grade range is typically narrower and per-tonne pricing remains practical, ferro-chrome spans a meaningful grade spectrum. The three primary commercial categories in active global trade today are:
- 50% Cr material, predominantly traded into Chinese stainless steel mills via CIF Chinese port delivery
- 60 to 64.9% Cr material, serving European stainless producers on a CIF Europe basis
- 65 to 70% Cr material, targeting European mills with tighter silicon specifications on a delivered Europe basis
The iron component within ferro-chrome carries almost no independent economic value in the stainless steel context. Steel mills are already working with iron-based feedstocks, so the iron fraction of ferro-chrome is essentially a carrier medium. What they are paying for is chromium delivery efficiency, and the pricing convention reflects that reality precisely.
How Secondary Specifications Adjust the Base Price
While chromium content drives the primary price calculation, several specification variables create measurable adjustments above or below the chromium-normalised base:
-
Carbon content: Standard high-carbon grades carry 6 to 8.5% C and represent the bulk of stainless steelmaking demand. Low-carbon ferro-chrome, required for specialty and superalloy applications, commands meaningful premiums given the additional processing required during production.
-
Silicon ceiling: The distinction between a maximum 1.5% Si threshold (applied to higher-grade European material assessed under MB-FEC-0021) and a maximum 3% Si threshold (for MB-FEC-0020 European CIF material) creates genuine grade stratification. Tighter silicon control requires more precise smelting conditions and translates into a structural price premium.
-
Delivery terms: CIF pricing incorporates ocean freight and marine insurance into the benchmark reference, while delivered pricing includes inland transport to the mill gate. These layers add cost that becomes embedded in assessed benchmark levels.
-
Volume and counterparty profile: Large-volume transactions with well-capitalised counterparties may clear at modest discounts to assessed spot levels, influencing how Price Reporting Agencies calibrate benchmark assessments when normalising observed deals.
The Conversion Formula: Translating $/lb Cr Into Usable Cost Data
The standard industry formula converts ferro-chrome's per-pound-of-chromium price into a per-metric-ton equivalent, allowing direct cost modelling within procurement and financial systems:
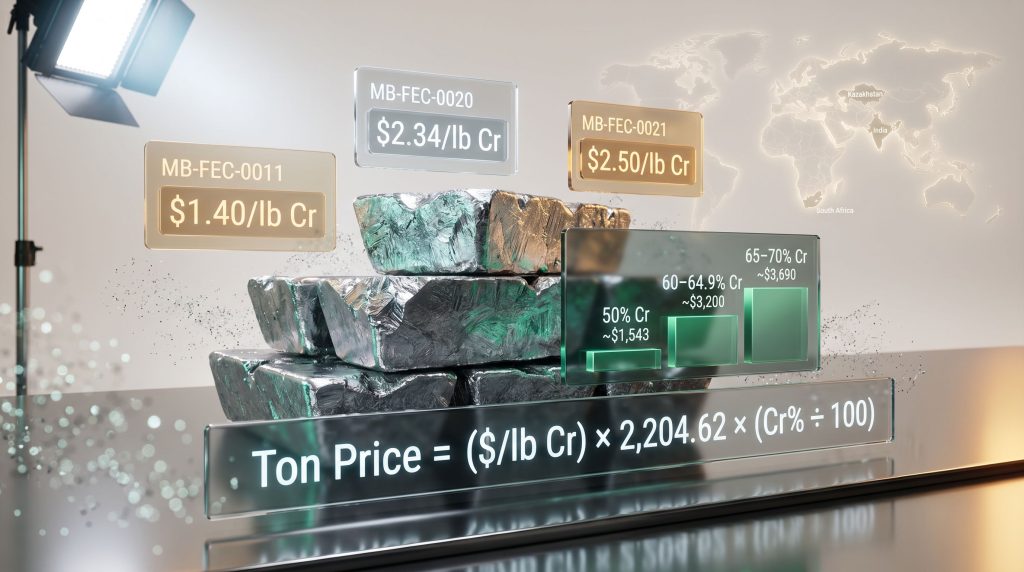
Metric Ton Price = ($/lb Cr) x 2,204.62 x (Cr% / 100)
The constant 2,204.62 represents the precise number of pounds in a metric tonne. Using approximate figures distorts the calculation, which is why the full decimal value is the industry standard. Applying this formula across the three primary grade categories produces the following approximate per-tonne equivalents:
| Grade Category | $/lb Cr | Chromium % | Approx. $/Metric Ton |
|---|---|---|---|
| 50% Cr (China CIF import) | ~$1.40 | 50% | ~$1,543 |
| 60–64.9% Cr (Europe CIF) | ~$2.34 | 62% | ~$3,197 |
| 65–70% Cr (Europe delivered) | ~$2.50 | 67% | ~$3,693 |
Note: Price figures shown are illustrative approximations for formula demonstration purposes only and do not represent current market levels. Actual assessed prices should be obtained from current Fastmarkets publications.
One underappreciated aspect of this formula is how it amplifies the price impact of grade differences. Moving from 50% to 67% Cr grade while holding the $/lb Cr rate constant increases the per-tonne cost by approximately 34% purely due to chromium content. In practice, higher-grade material also trades at a higher $/lb Cr rate, compounding the per-tonne premium significantly.
Global Benchmark Architecture: The Three Assessments That Govern Physical Trade
Fastmarkets, operating as an IOSCO-compliant Price Reporting Agency, maintains three ferro-chrome assessments that function as the primary reference points for physical market contracts across Asia and Europe. As confirmed through Fastmarkets' annual methodology review process, which closed its consultation period on April 27, 2026, the active assessments are:
| Assessment Code | Grade Specification | Carbon | Silicon | Delivery | Unit |
|---|---|---|---|---|---|
| MB-FEC-0011 | 50% Cr import | Standard | Standard | CIF main Chinese ports | $/lb contained Cr |
| MB-FEC-0020 | Basis 60–64.9% Cr | 6–8.5% C | Max 3% Si | CIF Europe | $/lb Cr |
| MB-FEC-0021 | Basis 65–70% Cr | 6–8.5% C | Max 1.5% Si | Delivered Europe | $/lb Cr |
Each benchmark serves a distinct regional market with genuinely different supply chain requirements. MB-FEC-0011 functions as the primary signal for the world's largest ferro-chrome import destination. The China steel market generates price signals that ripple across the entire global supply chain. When Chinese mills reduce purchase volumes or shift procurement timing, it is the MB-FEC-0011 assessment that registers the adjustment first.
MB-FEC-0020 and MB-FEC-0021 capture European stainless procurement dynamics, where grade stratification is more pronounced. European mills typically operate with tighter metallurgical specifications than their Asian counterparts, which explains why two separate European assessments exist rather than a single blended European reference. The split between 60 to 64.9% Cr and 65 to 70% Cr material reflects actual procurement category differences within European mill purchasing departments.
How Fastmarkets Constructs Each Assessment
The data collection and validation process behind each benchmark follows a structured sequence aligned with IOSCO principles:
-
Transaction data collection: Producers, merchants, and consumers submit completed deal data covering price, grade, volume, and delivery terms.
-
Bid and offer canvassing: During periods where completed transactions are limited, active bids and offers from credible, identified market participants are incorporated to maintain assessment continuity.
-
Specification normalisation: Raw data is adjusted to align with the benchmark specification. A deal executed at 62% Cr is adjusted to reflect the 60 to 64.9% Cr basis. Deals at non-standard silicon or carbon levels are further adjusted.
-
Editorial triangulation: Pricing analysts cross-reference multiple data streams, identify statistical outliers, and confirm directional consistency across market intelligence sources before finalising assessments.
-
Publication: Final assessments are published according to scheduled cycles, with the frequency determined by market liquidity conditions.
Fastmarkets confirmed in its May 2026 consultation closure notice that it received industry responses specifically addressing the specifications of MB-FEC-0011, and indicated it may conduct a separate focused consultation on those specifications in due course. This reflects how the annual review process functions as a live feedback mechanism rather than a procedural formality.
The Forces That Actually Move Ferro-Chrome Prices
Understanding ferro-chrome pricing methodology requires understanding what physically drives the numbers that populate these benchmarks. Three cost components dominate the production side of the equation:
| Production Cost Component | Approximate Share of Total Cost | Price Sensitivity |
|---|---|---|
| Chrome ore feedstock | 40–50% | High: ore price changes transmit directly to offer prices |
| Electricity consumption | 25–35% | High: smelting requires approximately 3–4 MWh per metric tonne produced |
| Labour and overhead | 15–25% | Moderate: varies significantly by producing country |
South African ferroalloys dominate both chrome ore mining and ferro-chrome smelting, creating a concentrated supply-side risk profile for the global market. Eskom electricity tariff escalations in South Africa have historically transmitted directly and rapidly into ferro-chrome offer prices, since smelters cannot absorb sustained increases in a cost component representing roughly a quarter to a third of their total production cost without adjusting their price positions.
On the demand side, the relationship between ferro-chrome and stainless steel is essentially singular. Over 90% of global ferro-chrome production flows into stainless steel manufacturing, which means stainless mill operating rate data is arguably the most important forward indicator available to ferro-chrome market participants. When stainless production schedules expand, ferro-chrome procurement activity rises across all three benchmark markets simultaneously.
Kazakhstan and India represent secondary production centres with distinct cost structures that periodically influence global competitive dynamics, particularly when South African supply tightens or energy costs spike. The presence of these alternative supply sources provides a ceiling on how far South African producers can push offer prices before buyers shift purchasing toward alternative origins.
The Structural Shift in European Ferro-Chrome Price Discovery
The discontinuation of the traditional European quarterly ferro-chrome benchmark, which had served as a negotiated reference between major European stainless producers and their ferro-chrome suppliers for decades, created a pricing governance gap that the market has been filling with a mosaic of alternative frameworks.
The post-benchmark pricing environment in Europe now encompasses three parallel reference mechanisms operating simultaneously:
- PRA spot assessments from agencies including Fastmarkets, providing transaction-derived reference prices on a regular publication schedule
- Digital platform transaction indices, where executed trades on electronic trading venues are algorithmically normalised to produce spot price references
- Bilateral spot contracts that incorporate PRA assessments as embedded index anchors in pricing formulas
The emergence of algorithmic normalisation through digital trading platforms represents a genuinely new development in ferro-chrome price governance. Where traditional PRA methodology incorporates editorial judgement as a deliberate component of benchmark construction, algorithmically derived indices remove that layer of subjectivity entirely. Whether this represents an improvement in price accuracy or simply a different set of assumptions embedded at the platform design level is a question the market is still working through.
Several major European stainless producers have moved toward incorporating platform-derived indices alongside traditional PRA references in their procurement frameworks. This hybrid approach reflects a practical acknowledgement that no single price discovery mechanism has yet established sufficient liquidity and credibility to serve as the sole European reference.
The next major ASX story will hit our subscribers first
IOSCO Compliance and the Regulatory Architecture of Ferro-Chrome Benchmarks
The governance framework surrounding ferro-chrome benchmarks has become considerably more rigorous since commodity price benchmark integrity came under sustained regulatory scrutiny globally. Fastmarkets operates under IOSCO (International Organization of Securities Commissions) principles for Price Reporting Agencies, which impose structured requirements across several dimensions:
| IOSCO Principle | Application to Ferro-Chrome Pricing |
|---|---|
| Governance | Independent oversight of pricing editorial decisions, separated from commercial functions |
| Benchmark quality | Specifications designed to reflect actual physical transaction norms in each market |
| Methodology transparency | Documented, publicly accessible methodology statements for each assessment |
| Accountability | Formal complaint and appeals mechanisms available to market participants |
| Conflicts of interest management | Separation of commercial revenue activities from editorial pricing decisions |
The annual methodology review process is a direct IOSCO requirement. Fastmarkets' most recent consultation cycle, covering MB-FEC-0011, MB-FEC-0020, and MB-FEC-0021, ran with a closing date of April 27, 2026. The process allows producers, consumers, traders, and other market participants to submit written feedback on pricing specifications, assessment frequency, data sufficiency standards, and delivery term definitions.
Contracts indexed to IOSCO-compliant benchmarks carry meaningfully stronger legal enforceability and counterparty acceptance than those referencing non-compliant or internally constructed price indices. Consequently, for long-term supply agreements between ferro-chrome producers and stainless steel mills — where contract values can run into hundreds of millions of dollars over multi-year terms — the governance quality of the reference benchmark is not a secondary consideration. The global iron ore market faces similar regulatory governance pressures, illustrating how benchmark integrity has become a cross-commodity concern.
Frequently Asked Questions on Ferro-Chrome Pricing Methodology
What does $/lb Cr mean in ferro-chrome pricing?
The $/lb Cr notation means that the price is expressed as US dollars per pound of chromium physically contained within the ferro-chrome alloy. This normalises pricing across different chromium grade categories, allowing buyers and sellers to compare the cost of chromium delivery regardless of the total alloy composition.
How is the ferro-chrome conversion formula applied in practice?
Multiply the $/lb Cr figure by 2,204.62 (pounds per metric tonne) and then by the chromium content expressed as a decimal. For 62% Cr material priced at $2.34/lb Cr: $2.34 x 2,204.62 x 0.62 equals approximately $3,197 per metric tonne.
What distinguishes MB-FEC-0020 from MB-FEC-0021?
MB-FEC-0020 covers 60 to 64.9% Cr material with a maximum 3% Si ceiling on a CIF Europe basis, while MB-FEC-0021 applies to higher-grade 65 to 70% Cr material with a tighter maximum 1.5% Si threshold on a delivered Europe basis. The two assessments reflect genuine grade stratification in European stainless mill procurement requirements.
Why do Chinese and European ferro-chrome benchmarks diverge?
The China CIF benchmark covers lower-grade 50% Cr import material aligned with Chinese mill preferences and reflects Chinese port delivery logistics. European benchmarks cover higher-grade material and incorporate European freight and handling costs. Furthermore, demand profiles, freight economics, and metallurgical grade requirements differ substantially between the two regions.
How does chrome ore pricing feed into ferro-chrome benchmark assessments?
Chrome ore represents approximately 40 to 50% of ferro-chrome production costs. When ore prices rise due to South African supply constraints or elevated Chinese seaborne ore demand, producers adjust their offer prices upward, and those revised offers feed into PRA data collection processes and ultimately register in published benchmark assessments. The global crude steel outlook provides additional context on how upstream commodity cost pressures transmit through ferrous metal supply chains.
What is the significance of Fastmarkets' 2026 annual methodology review for ferro-chrome?
The review confirmed that all three active ferro-chrome assessments remain under active governance oversight. Notably, Fastmarkets received industry responses specifically addressing the specifications of MB-FEC-0011, the China CIF benchmark, and indicated it may conduct a separate focused consultation on those specifications. This signals potential evolution in how the China import benchmark is defined, which could have meaningful implications for contracts currently referencing that assessment code.
For those seeking further technical detail, CRU's bulk ferroalloys methodology documentation provides a useful comparative reference on how competing price reporting agencies approach ferro-chrome benchmark construction. This is a developing situation and market participants should monitor Fastmarkets' methodology notices for updates.
Disclaimer: This article is intended for informational and educational purposes only and does not constitute financial, investment, or trading advice. Price figures referenced are illustrative approximations only. Readers should consult current Fastmarkets price assessments and independent professional advisers for commercial decision-making. Market conditions, benchmark specifications, and regulatory frameworks are subject to change.
Want To Stay Ahead of Major ASX Mineral Discoveries Before the Broader Market Does?
Discovery Alert's proprietary Discovery IQ model delivers real-time alerts on significant ASX mineral discoveries, translating complex commodity data across more than 30 sectors into clear, actionable insights for both short-term traders and long-term investors. Explore Discovery Alert's dedicated discoveries page to understand how historic mineral discoveries have generated substantial market returns, and begin your 14-day free trial today to secure a genuine market-leading advantage.