August 24, 2026
The Income Trap Hidden Inside a Fixed Payout Ratio
Most investors focus on dividend yield as a headline number. But for shareholders in commodity-exposed miners, what matters far more is the mechanical relationship between earnings volatility and a fixed payout ratio. When a company commits to distributing a set percentage of profits regardless of how those profits fluctuate, the dividend becomes a mirror image of the commodity cycle rather than a stable income stream.
This dynamic sits at the heart of any serious Fortescue dividend forecast analysis. For investors evaluating Fortescue Ltd (ASX: FMG) purely on income grounds, understanding why the dividend moves matters as much as knowing where it is likely to land. Furthermore, the iron ore price trends underpinning this analysis add another layer of complexity that income-focused investors cannot afford to ignore.
When big ASX news breaks, our subscribers know first
What the FY26 Dividend Result Actually Reveals
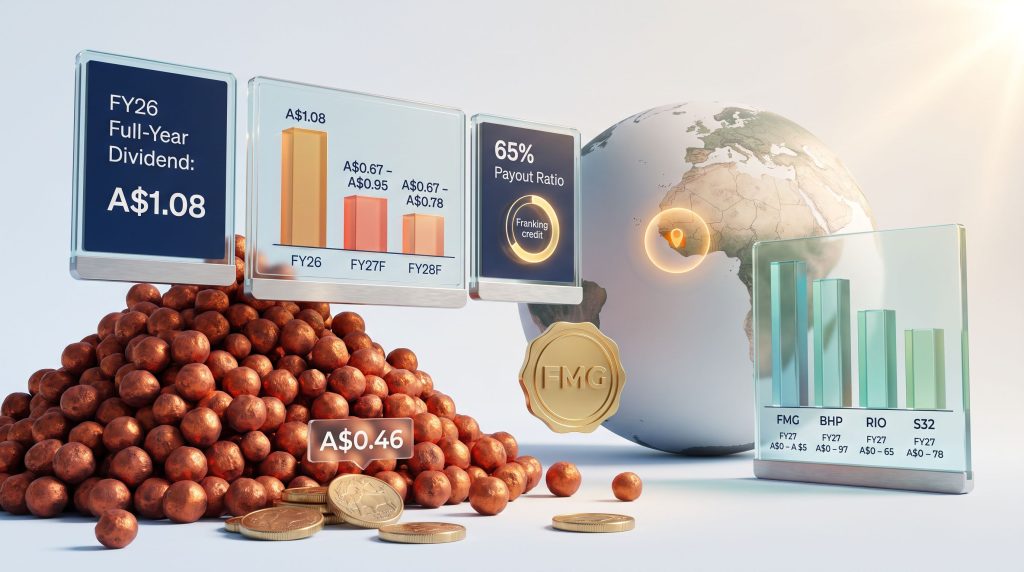
Fortescue declared a fully franked final dividend of A$0.46 per share for FY26, bringing the full-year payment to A$1.08 per share. On the surface, that represents only a modest 2% decline from FY25's annual payment. However, the final dividend itself fell approximately 23% compared to FY25's final payment, a more significant contraction that reflects the directional pressure building on earnings.
The nuance here is instructive. Both FY25 and FY26 maintained a 65% dividend payout ratio, so the framework was consistent. The problem was what happened to the earnings base underneath that framework.
In US dollar terms, Fortescue's underlying earnings per share actually grew by approximately 3% in FY26, driven primarily by a 7% increase in realised iron ore prices. Yet in Australian dollar terms, underlying EPS declined by 2%, because AUD appreciation eroded the translation of USD revenues back into the currency in which dividends are paid.
This currency translation effect is frequently underappreciated by retail investors. A miner can post operationally stronger results while simultaneously delivering a lower AUD dividend, purely because of exchange rate movements outside management's control.
Why the Fortescue Dividend Forecast Points Lower Through FY27 and FY28
Iron Ore Supply: The Simandou Factor
The single most consequential variable shaping the Fortescue dividend forecast over the next two to three years is the trajectory of seaborne iron ore prices. Consequently, the most structurally significant threat to that price comes from West Africa, where the Simandou deposit in Guinea represents one of the largest undeveloped high-grade iron ore resources ever identified.
Unlike many of the lower-grade deposits that define Western Australian production, Simandou ore grades are exceptionally high, potentially exceeding 65% Fe content. This matters because high-grade ore commands a premium in the seaborne market, particularly from Chinese steel mills seeking to optimise blast furnace productivity and reduce sintering emissions under tightening environmental regulations.
As Simandou progressively ramps up shipments over the coming years, it will add meaningful new supply to a market already characterised by disciplined but substantial output from Australian and Brazilian producers. Some market analysts have identified US$90 per tonne as a plausible downside scenario for iron ore if African supply expansion outpaces demand recovery. Indeed, the iron ore surplus risks associated with this dynamic could prove more severe than current consensus assumes.
Key supply-side pressures on the iron ore price outlook include:
- Progressive ramp-up of Simandou production adding high-grade seaborne tonnes
- Continued output discipline from major Australian producers including Fortescue, BHP, and Rio Tinto
- Brazilian production recovery from Vale following operational disruptions in prior years
- Fortescue's own African project in Gabon, which remains considerably smaller in scale than Simandou
Chinese Steel Demand: A Structural Rather Than Cyclical Problem
On the demand side, the picture is arguably more complex than a simple price-cycle argument. China accounts for roughly 70% of global seaborne iron ore trade, and its steel demand is facing structural headwinds that go beyond typical cyclical slowdowns. The China steel and iron ore outlook highlights how the country's property sector deleveraging is reshaping long-term demand assumptions.
The Chinese property sector, which historically consumed enormous volumes of steel-intensive construction materials, is undergoing a prolonged deleveraging cycle. The era of rapid urbanisation-driven construction growth appears to be moderating structurally, not just temporarily. This reduces the probability of a sharp demand-led iron ore price recovery without a significant offsetting increase from infrastructure or green-economy steel applications.
It is worth noting that commodity price analysts have repeatedly underestimated iron ore price resilience during previous supply expansion cycles. Fortescue bulls would point to this track record as reason for caution against overly bearish projections.
The AUD/USD Amplifier Effect
A factor that deserves separate treatment in any Fortescue dividend forecast is the Australian dollar's role as an earnings amplifier or drag. Because Fortescue's revenues are priced globally in US dollars while dividends are declared and paid in Australian dollars, every movement in the AUD/USD exchange rate directly alters the company's dividend-paying capacity, even when iron ore prices and production volumes are unchanged.
A rising Australian dollar compresses AUD-denominated revenues without any change in operational performance. This was precisely the mechanism that reduced FY26's AUD dividend relative to what USD-denominated earnings growth would otherwise have suggested.
Fortescue Dividend Forecast Table: FY26 to FY30
The following table presents a scenario-based synthesis of available broker consensus estimates. These figures should be treated as indicative projections rather than guaranteed outcomes, given the inherent uncertainty in commodity price forecasting.
| Financial Year | Dividend Per Share (A$) | Indicative Yield (Excl. Franking) | Indicative Yield (Incl. Franking) |
|---|---|---|---|
| FY26 (Declared) | A$1.08 (actual) | ~6.0% | ~8.6% |
| FY27 (Forecast) | A$0.67 – A$0.95 | ~3.7% – 5.3% | ~5.3% – 7.5% |
| FY28 (Forecast) | A$0.60 – A$0.78 | ~3.3% – 4.3% | ~4.7% – 6.2% |
| FY29–FY30 (Forecast) | A$0.81 – A$0.89 | ~4.5% – 5.0% | ~6.4% – 7.1% |
All yield figures are indicative only and calculated based on approximate share price levels at the time of writing. Actual yields will vary with share price movements. All forecasts represent consensus estimates and are subject to material revision.
Three Dividend Scenarios: Bear, Base, and Bull
Bear Case: Iron Ore Slides Toward US$90 Per Tonne
If Simandou ramps faster than the market currently prices and Chinese steel demand fails to recover meaningfully, iron ore could slide toward the lower end of analyst projections. Under this scenario:
- FY27 dividends could fall toward A$0.67 per share or potentially lower
- Management may opt to reduce the payout ratio from 65% toward 50% to protect balance sheet flexibility
- Capital expenditure commitments across copper and energy divisions would intensify the earnings-to-dividend compression
- Franking credit benefits would partially cushion the impact for Australian resident investors
Base Case: Iron Ore Stabilises in the US$95 to US$105 Range
Under a base case where iron ore prices find support around the mid-US$90s to low US$100s per tonne and the AUD/USD rate remains relatively contained:
- FY27 dividends are most likely to land in the A$0.80 to A$0.90 per share range
- The 65% payout ratio is broadly maintained
- Franking-adjusted yields remain competitive relative to broader ASX industrials
Bull Case: Commodity Resilience and Diversification Contribution
If iron ore prices outperform consensus expectations, as they have done during several prior supply-expansion cycles, and Fortescue's copper and energy divisions begin generating incremental earnings contributions ahead of schedule:
- FY27 dividends could approach A$0.95 per share
- A recovery trajectory toward FY26 levels becomes plausible by FY29 to FY30
- Positive sentiment re-rating could support the share price and compress the yield metric
Fortescue's Diversification Strategy and What It Means for Dividends
Beyond Iron Ore: The Long Game in Copper and Energy
Fortescue is actively pursuing diversification away from its iron ore-dominant earnings base. The company's growth interests span copper exploration across several jurisdictions, green hydrogen and energy initiatives through its Fortescue Energy division, and iron ore development in Gabon, though the Gabon project operates at a scale that is not comparable to Simandou.
The strategic logic is sound. A more diversified earnings base would reduce the company's sensitivity to any single commodity cycle, providing greater dividend stability over time. Copper, in particular, carries a structurally positive long-term demand outlook driven by electrification and critical minerals and energy transition infrastructure buildout globally.
However, the critical question for income-focused investors is timing. Most current broker models assign limited near-term earnings credit to Fortescue's energy and copper divisions within the FY27 to FY28 forecast window. The meaningful diversification contribution to dividend sustainability is more likely a FY29 to FY30 story at the earliest, contingent on project execution and commodity market conditions.
Capital Expenditure as a Hidden Dividend Headwind
Funding diversification is not free. Higher capital expenditure commitments across energy infrastructure and mining development compete directly with shareholder returns in the near term. If capex demands intensify beyond current projections, management may face pressure to reduce the payout ratio from 65% toward 50%, which would compress absolute dividend payments even if underlying earnings hold steady.
This creates a scenario some analysts describe as a double compression: lower iron ore earnings meeting a lower payout ratio simultaneously, potentially driving FY27 or FY28 dividends toward the bottom of the forecast range without requiring any single catastrophic development.
The next major ASX story will hit our subscribers first
How Fortescue Compares to Other ASX Resources Dividend Payers
For investors evaluating Fortescue within a broader income portfolio context, comparative yield data provides useful framing. Furthermore, Australia's iron ore advantage relative to global peers remains a key consideration when assessing the resilience of ASX-listed miners' dividend profiles. The following table illustrates how FMG's projected yield profile stacks up against major ASX peers on a consensus basis.
| Company | Est. FY27 Yield (Excl. Franking) | Franking Status | Earnings Diversification |
|---|---|---|---|
| Fortescue (FMG) | ~3.7% – 5.3% | Fully Franked | Low (iron ore dominant) |
| BHP Group (BHP) | ~4.0% – 5.5% | Fully Franked | High (copper, coal, potash) |
| Rio Tinto (RIO) | ~4.5% – 6.0% | Partially Franked | High (aluminium, copper) |
| South32 (S32) | ~3.0% – 4.5% | Partially Franked | Moderate (base metals mix) |
The comparative table highlights that Fortescue's franking-adjusted yield remains competitive on a headline basis. However, its concentrated iron ore exposure creates materially higher earnings volatility than diversified peers like BHP and Rio Tinto, which carry significant copper and other base metal revenue streams that partially insulate dividends from iron ore price weakness.
The Franking Credit Advantage: Why Australian Investors Should Look Beyond the Headline Yield
Understanding Full Franking in Practice
Fortescue's dividends carry full franking, which represents a significant tax advantage for Australian resident shareholders that is frequently undervalued in simple yield comparisons. According to Fortescue's investor relations disclosures, the mechanism works as follows:
- Fortescue pays corporate income tax at the 30% rate on profits before distributing dividends
- Shareholders receive a franking credit representing the tax already paid at the corporate level on their behalf
- The grossed-up yield is calculated by dividing the dividend by (1 minus the corporate tax rate of 30%)
- For illustrative purposes, a 65-cent dividend carries an approximate grossed-up equivalent of 92.9 cents, representing the full pre-tax distribution value
- Australian investors apply the franking credit against their personal tax liability, potentially reducing or eliminating additional tax owed on the dividend income
The SMSF Amplification Effect
For investors holding Fortescue shares inside a self-managed superannuation fund, the franking credit benefit is amplified further. SMSFs in pension phase pay zero tax on investment income, meaning franking credits are fully refundable as cash from the Australian Taxation Office. SMSFs in accumulation phase pay only 15% tax, creating a substantial refundable credit on fully franked dividends.
This makes the effective yield of a fully franked Fortescue dividend meaningfully higher for SMSF investors than the headline figure suggests, and it is a dimension of the investment case that income-focused superannuation investors should incorporate into their analysis.
Frequently Asked Questions: Fortescue Dividend Forecast
What is the Fortescue dividend forecast for FY27?
Consensus analyst estimates for the FY27 annual Fortescue dividend range from approximately A$0.67 to A$0.95 per share, representing a meaningful reduction from the FY26 declared total of A$1.08. The primary drivers of this expected decline are lower forecast iron ore prices and increased capital expenditure requirements across diversification projects.
What is Fortescue's dividend payout ratio?
Fortescue maintained a 65% dividend payout ratio in both FY25 and FY26. Some analyst models project this ratio could be trimmed toward 50% if capital expenditure demands intensify or if earnings contract more significantly than the base case assumes.
What is the biggest risk to the Fortescue dividend through FY28?
The most significant structural risk is a sustained decline in iron ore prices driven by new high-grade African supply entering the seaborne market without a proportionate increase in global steel demand. A strengthening Australian dollar amplifies this risk by reducing the AUD translation value of USD-denominated revenues.
Are Fortescue dividends fully franked?
Yes. Fortescue's dividends have historically been fully franked, providing material tax benefits for Australian resident shareholders, particularly those investing through superannuation structures where franking credits can be refunded in whole or in part.
Could the Fortescue dividend recover by FY29 or FY30?
Some longer-dated broker forecasts suggest a modest recovery toward A$0.81 to A$0.89 per share by FY29 to FY30, contingent on iron ore price stabilisation and progressive earnings contribution from copper and energy divisions.
Key Takeaways for Income-Focused Investors
| Factor | Assessment |
|---|---|
| Near-Term Dividend Trajectory (FY27–FY28) | Declining relative to FY26 |
| Franking Credit Benefit | Strong advantage for Australian resident investors |
| Iron Ore Price Sensitivity | High, dominant earnings driver |
| Diversification Earnings Contribution | Limited within FY27–FY28 window |
| Payout Ratio Stability | At risk of reduction from 65% to ~50% |
| AUD/USD Exposure | Secondary but meaningful earnings risk |
| FY29–FY30 Recovery Potential | Moderate, contingent on multiple factors |
For investors whose primary objective is stable or growing income over the next two years, the current consensus Fortescue dividend forecast trajectory suggests a period of compressed distributions rather than income growth. The fully franked dividend does provide a meaningful yield buffer, particularly for superannuation investors, and the longer-dated recovery narrative from FY29 onward remains plausible if diversification execution proceeds and iron ore markets find support.
Investors with higher iron ore price conviction and longer time horizons may find the franking-adjusted yield at current levels adequate compensation for the commodity risk they are accepting. Those seeking more stable near-term income may find that more diversified ASX resources peers offer a more predictable distribution outlook through FY28.
This article is intended for general informational and educational purposes only and does not constitute financial advice. All dividend forecasts represent analyst consensus estimates and are subject to material revision. Past dividend payments are not indicative of future distributions. Investors should seek independent financial advice tailored to their personal circumstances before making investment decisions.
Want to Spot the Next Major ASX Mineral Discovery Before the Broader Market Does?
While Fortescue's dividend outlook remains tied to iron ore price cycles and currency movements, Discovery Alert's proprietary Discovery IQ model scans ASX announcements in real time, instantly identifying significant mineral discoveries across more than 30 commodities and turning complex data into actionable investment insights — explore historic discoveries and their returns, then begin your 14-day free trial to position yourself ahead of the market.