August 5, 2026
The Hidden Complexity Inside a 4% Fair Value Cut
Valuation reductions rarely make headlines when they appear modest on the surface. A 4% adjustment to a fair value estimate sounds almost routine in equity research. Yet when that cut is driven by the simultaneous deterioration of three separate model inputs across a single reporting period, the analytical signal it carries is considerably more powerful than the percentage implies. This is precisely the situation playing out with one of Australia's most closely watched iron ore producers, where a Fortescue fair value cut on Iron Bridge problems is forcing investors to reconsider assumptions that have quietly underpinned the bull case for years.
Understanding why this matters requires stepping back from the headline numbers and examining the structural mechanics at work beneath them.
When big ASX news breaks, our subscribers know first
What the Valuation Architecture Actually Reveals
How Analysts Model Large-Cap Iron Ore Producers
Discounted cash flow models for major iron ore producers are built around three dominant variables: the volume of product shipped, the unit cost required to produce and deliver each tonne, and the capital expenditure needed to sustain and grow that output. When equity analysts revise a fair value estimate, the significance of that revision depends heavily on whether one variable moved or several moved together.
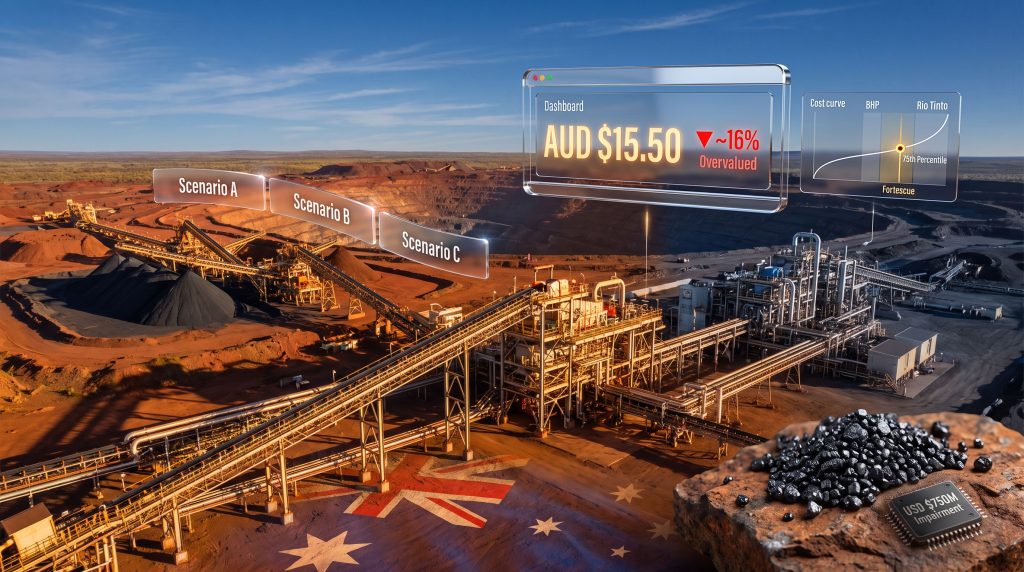
Morningstar's revised fair value of AUD $15.50 per share for Fortescue (ASX: FMG) reflects downward pressure applied across all three of these variables in the same assessment period. Forecast Iron Bridge production was lowered by 22% to approximately 8.6 million metric tonnes (Fortescue's attributable share). Hematite unit cash costs were revised upward by roughly 1% to approximately USD $21 per metric ton, the midpoint of guidance spanning USD $20.50 to USD $21.75. Capital expenditure expectations were also lifted across the forward forecast period.
When volume, cost, and capital expenditure assumptions all move in the same adverse direction within a single modelling cycle, the compounding effect on discounted cash flow outputs is disproportionate to what any single variable adjustment would produce in isolation.
This compounding dynamic is what transforms an apparently minor fair value reduction into a meaningful analytical statement about the operational and competitive trajectory of the business.
Iron Bridge: The Magnetite Bet That Hasn't Paid Off Yet
Why the Project Was Central to Fortescue's Long-Term Thesis
Iron Bridge is a magnetite iron ore joint venture located in Western Australia's Pilbara region, with Fortescue holding a 69% ownership stake. The project was designed to produce high-grade magnetite concentrate grading at approximately 67% iron content, which is substantially richer than Fortescue's standard hematite product.
The strategic logic behind Iron Bridge was straightforward but important. Fortescue's core hematite operations produce ore grading at 57% to 58% iron, which sits below the 61% to 62% iron fines benchmark that global steel mills use as their reference price. Understanding the distinction between magnetite vs hematite is essential here, as this grade differential is not merely cosmetic. Lower-grade ore creates real inefficiencies for steel producers:
- Higher proportions of gangue material (waste) must be transported and processed at the mill's expense
- Greater energy and coking coal consumption per unit of steel produced
- Reduced blast furnace productivity per charge
- Increased sinter plant processing requirements
These downstream cost burdens translate directly into a realised price discount for Fortescue. Over the decade ending June 2025, the company achieved an average realised price approximately 22% below the prevailing 62% iron ore benchmark. That is a persistent, structurally embedded competitive disadvantage.
Iron Bridge was designed to address this by providing high-grade concentrate that could be blended with Fortescue's standard hematite output to lift the portfolio average toward 58% to 59% iron. Even a one percentage point improvement in average grade can narrow the realised price discount meaningfully, improving margins across the entire shipped volume.
The Gap Between Design Capacity and Actual Delivery
| Metric | Original Design Target | Current Status |
|---|---|---|
| Nameplate annual capacity | 22 million tonnes per year | Target withdrawn |
| Fortescue's attributable share (near-term) | ~15 million tonnes | Revised to ~8.6 million tonnes |
| Production forecast reduction | N/A | 22% cut in analyst models |
| Pre-tax impairment charge | N/A | |
| Timeline to nameplate capacity | FY2028 | Unspecified, indefinitely extended |
The project has encountered persistent ramp-up difficulties. Magnetite processing is inherently more complex than hematite mining. Unlike direct-shipping hematite ore, magnetite concentrate requires extensive beneficiation, including crushing, grinding, magnetic separation, and filtration, before it reaches an exportable product specification. Furthermore, pipeline infrastructure challenges have also contributed to the delays, with slurry transportation adding operational variables that hematite producers do not face.
The withdrawal of the 2028 nameplate capacity target and the booking of a pre-tax impairment charge of approximately USD $750 million represent a significant recalibration of what the project can realistically deliver and when.
The Q4 FY2026 Numbers: A Double-Pressure Scenario
Operational Results and Their Valuation Consequences
The most recent quarterly operational data captures a picture of volume softness coinciding with cost escalation, the most damaging combination from a unit economics perspective.
| Operational Metric | Q4 FY2026 Result | Change |
|---|---|---|
| Quarterly shipments | 52 million metric tonnes | Down 5% vs. prior Q4 |
| Full-year shipments | ~190 million metric tonnes | Up ~1% year-on-year |
| Unit cash costs (Q4) | USD $19.40 per metric ton | Up 19% quarter-on-quarter |
| FY2027 hematite cost guidance midpoint | ~USD $21.00 per metric ton | Above prior consensus |
| FY2027 total shipment forecast | ~200 million metric tonnes | Down from ~205 million prior |
The 19% quarterly spike in unit cash costs is analytically significant not simply because of its magnitude, but because of the context in which it occurred. Fixed infrastructure costs, including processing facilities, port infrastructure, and rail networks, do not compress proportionally when volumes fall. When fewer tonnes move through the same fixed-cost base, the cost per tonne rises automatically. Add rising variable costs on top of that dynamic and the margin compression is amplified considerably.
Three Scenarios for Iron Bridge's Recovery Path
Scenario A: Accelerated Ramp-Up (Bull Case)
Under the most optimistic plausible trajectory, Iron Bridge achieves nameplate capacity of 22 million tonnes per year during FY2028. Blending delivers a portfolio grade improvement to approximately 59% iron, the realised price discount narrows below 20%, and capital expenditure normalises post-ramp. Free cash flow generation would strengthen materially from FY2029 if iron ore spot prices remain above USD $90 per metric ton.
Scenario B: Prolonged Delay (Base Case)
Fortescue's attributable Iron Bridge production remains in the range of 8 to 10 million tonnes per year through FY2027 and FY2028. Unit cash costs for the project stay elevated due to fixed-cost underutilisation. Group capital expenditure remains above historical norms. Consequently, iron ore price decline pressures compound with operational challenges as iron ore prices gradually moderate from current levels of approximately USD $100 toward a long-run marginal cost-based estimate of approximately USD $75 per metric ton from 2030.
Under this scenario, fair value remains anchored near AUD $15.50, implying the stock trades at approximately 16% above intrinsic value at current market prices, according to Morningstar's assessment.
Scenario C: Structural Impairment (Bear Case)
If Iron Bridge fails to reach commercially viable nameplate capacity within an acceptable timeframe, further write-downs beyond the initial approximately USD $750 million pre-tax impairment become possible. The blending strategy fails to deliver its intended grade uplift. Meanwhile, China steel demand softens faster than consensus expects, and new seaborne supply including the Simandou project in Guinea and incremental Vale volumes from Brazil accelerates price compression. Dividend sustainability comes under meaningful pressure as free cash flow contracts.
Fortescue's Position on the Global Cost Curve
Why Cost Curve Positioning Matters More Than Many Investors Appreciate
Fortescue ranks as the world's fourth-largest iron ore exporter but operates at approximately the 75th percentile of the global cost curve. This positioning deserves careful consideration from investors accustomed to treating all large iron ore producers as broadly equivalent.
| Metric | Fortescue (FMG) | BHP | Rio Tinto |
|---|---|---|---|
| Cost curve position | ~75th percentile | Top quartile | Top quartile |
| Typical iron ore grade | 57-58% Fe | 61-62% Fe | 62%+ Fe |
| Morningstar moat rating | No moat | Wide moat | Wide moat |
| 10-year avg price discount | ~22% below benchmark | At/above benchmark | At/above benchmark |
| Business diversification | Iron ore + early-stage copper/green energy | Broadly diversified | Broadly diversified |
Being at the 75th percentile of the cost curve means Fortescue is among the first producers to experience meaningful margin compression when iron ore prices decline. Producers in the lowest cost quartile can absorb price weakness over extended periods; however, producers near the 75th percentile face a rapidly narrowing margin buffer as prices approach their unit cost floor.
Fortescue's cost curve position is partly a legacy of its extraordinary capacity build-out history. Expansion from 55 million metric tonnes in fiscal 2012 to approximately 170 million metric tonnes by fiscal 2016 was an unprecedented pace of growth, executed near the peak of the China construction cycle. Building capacity when input costs, equipment prices, and engineering rates are elevated creates a higher capital cost per unit of output that persists on the balance sheet for the life of those assets.
The next major ASX story will hit our subscribers first
The Iron Ore Price Debate: Market vs. Analyst Assumptions
Why the Gap Between Spot Prices and Long-Run Estimates Is the Core Valuation Question
Current market pricing of Fortescue shares implies investor confidence that iron ore at approximately USD $100 per metric ton will persist for considerably longer than long-run marginal cost analysis supports. In addition, the iron ore market pressures created by evolving trade dynamics add further complexity to price forecasting.
Morningstar's modelling assumes iron ore prices moderate toward approximately USD $75 per metric ton from 2030, based on estimates for the long-run marginal cost of production. Two structural forces underpin this view:
On the demand side:
- China's fixed-asset investment intensity is maturing as infrastructure stock approaches developed-economy density levels
- Urbanisation rate deceleration reduces the incremental steel demand generated per unit of GDP growth
- Steel consumption per capita in China is approaching saturation levels seen historically in Japan and South Korea before their own demand peaks
On the supply side:
| New Supply Source | Estimated Capacity Addition | Timeline |
|---|---|---|
| Simandou (Guinea) | Up to ~150 million tonnes/year at full build | Phased from mid-2020s |
| Vale recovery (Brazil) | Incremental volumes from Brazilian operations | Ongoing |
| Other Pilbara expansions | Moderate additions | FY2026-FY2028 |
The simultaneous arrival of large-scale Simandou supply and Chinese demand moderation creates a structural ceiling on sustained iron ore pricing that makes current market assumptions increasingly difficult to validate within long-run valuation frameworks.
What Would Change Fortescue's Moat Rating?
The Three Conditions Required to Shift the Competitive Assessment
Fortescue's no-moat rating from Morningstar reflects three structural disadvantages that have proven resistant to management intervention:
- Product grade inferiority: Ore grading 57% to 58% iron against a 61% to 62% benchmark creates a persistent realised price discount that cannot be addressed through operational efficiency alone
- Cost curve positioning: Operating near the 75th percentile creates asymmetric margin risk during price downturns relative to peers with lower cost structures
- Capital intensity legacy: The rapid capacity build near the peak of the China boom embedded a higher capital cost per tonne of output than peers who built capacity at lower points in the cost cycle
For a moat rating upgrade to be justified analytically, analysts would need to see:
- Sustained Iron Bridge delivery at nameplate capacity, demonstrating the blending strategy is operationally viable at scale
- A structurally durable reduction in the realised price discount to below 15%
- Material EBITDA contributions from copper and clean energy initiatives, demonstrating genuine diversification
- Cost curve positioning improving to the 60th percentile or better on a sustained basis
Capital Expenditure: The Valuation Drag That Compounds Quietly
Why Elevated Capex Is More Damaging Than Revenue Softness Alone
Iron Bridge's delayed ramp-up extends the period of elevated sustaining capital requirements across more financial years than original models anticipated. This matters for income-oriented investors because capital expenditure competes directly with dividends and buybacks for free cash flow allocation.
Discretionary spending on green energy and copper exploration further complicates the capital allocation picture. These initiatives represent optionality with potentially significant long-term value, but they consume near-term free cash flow that would otherwise support shareholder returns. Furthermore, Australia's iron ore industry context is important here, as the broader sector faces its own cost and capital pressures that compound Fortescue's project-specific challenges.
Investors who hold Fortescue primarily for its income potential should track the sequencing of Iron Bridge completion capital against discretionary green energy expenditure, as the order of priority between these competing claims will materially determine near-term dividend coverage capacity.
Key Metrics to Monitor Going Forward
The Four Indicators That Will Define the Bull or Bear Outcome
Investors seeking to track whether the bull or bear scenario is gaining traction should focus on these four data points across upcoming reporting periods:
- Iron Bridge monthly production rates: Any sustained ramp toward 10 or more million attributable tonnes per annum would confirm recovery momentum and support the base-case scenario
- Group unit cash costs vs. guidance range: Delivering costs at or below USD $20.50 per metric ton, the lower end of guidance, would partially offset volume shortfalls in margin terms
- Capital expenditure vs. guidance: Any overrun on capital spending guidance would apply additional downward pressure on the discounted cash flow model
- Iron ore spot price trajectory: The gap between spot prices near USD $100 and the long-run analyst assumption near USD $75 represents the single largest source of divergence between current market valuations and intrinsic value estimates
Frequently Asked Questions
Why Was the Fair Value Estimate Reduced to AUD $15.50?
The reduction reflects the compounding effect of three simultaneous adverse revisions: lower near-term Iron Bridge shipment volumes, higher life-of-mine unit cash cost assumptions for Iron Bridge, and increased group capital expenditure forecasts. Each variable individually would produce a modest impact; together, their combined effect on the discounted cash flow model is amplified beyond what headline percentage terms suggest. This is the core reason the Fortescue fair value cut on Iron Bridge problems carries more analytical weight than the 4% headline figure implies.
How Does Magnetite Differ From Hematite, and Why Does It Matter?
Hematite is a direct-shipping ore requiring minimal processing, which makes it cheaper to produce but lower in grade at the point of export. Magnetite requires extensive beneficiation including grinding, magnetic separation, and dewatering to produce a concentrate product. The resulting concentrate is significantly higher in iron grade, around 67% for Iron Bridge, making it valuable for blending. However, the processing complexity creates greater operational risk and capital intensity compared with hematite mining.
What Is the Significance of the 75th Percentile Cost Curve Position?
Producers near the 75th percentile of the global cost curve operate with materially thinner margin buffers than low-cost quartile producers. When iron ore prices decline, high-cost-curve producers see their margins compress much faster, and they approach breakeven much sooner, than industry leaders. This positioning also means Fortescue generates lower returns on capital than peers across the full price cycle, which is a primary driver of the no-moat competitive rating.
Is Fortescue's Dividend Sustainable If Iron Bridge Continues to Underperform?
Dividend sustainability depends on free cash flow generation, which is simultaneously pressured by elevated capital expenditure, rising unit costs, and any iron ore price moderation. Fortescue has historically maintained generous payout ratios, but investors should recognise that the combination of Iron Bridge underperformance and a softening price outlook creates compounding pressure on the free cash flow base that dividend payments draw from. The Fortescue fair value cut on Iron Bridge problems is, consequently, not merely a valuation exercise but a direct indicator of the risks surrounding income generation capacity.
This article is intended for informational purposes only and does not constitute financial advice. Past performance is not indicative of future results. Readers should conduct their own independent research or consult a licensed financial adviser before making investment decisions. Fair value estimates and analyst commentary referenced herein are based on publicly available Morningstar research and are subject to change. All financial projections involve inherent uncertainty and actual outcomes may differ materially from those described.
Want to Catch the Next Major ASX Mineral Discovery Before the Market Does?
While Fortescue's Iron Bridge challenges highlight the complexity of large-cap resource investing, Discovery Alert's proprietary Discovery IQ model scans ASX announcements in real time, delivering instant alerts on significant mineral discoveries — from magnetite to copper — so subscribers can identify actionable opportunities ahead of the broader market. Explore historic examples of exceptional discovery returns and begin your 14-day free trial today to position yourself at the forefront of the next major find.