August 4, 2026
The Quiet Revolution Reshaping Global Iron Ore Supply
For most of the past two decades, the global iron ore trade has been shaped by a small number of producers operating at a scale that seemed almost impossible to replicate. Building the rail networks, port infrastructure, and mining capacity to ship hundreds of millions of tonnes annually takes generations of capital deployment and operational refinement. Yet the Pilbara region of Western Australia has repeatedly defied those expectations, and the Fortescue 200 million tonne iron ore production milestone achieved in FY2026 is the latest proof of that.
Understanding why this number matters requires looking past the headline figure and examining the geological, financial, and strategic layers underneath it. Furthermore, iron ore price trends play a critical role in contextualising the commercial significance of this achievement.
When big ASX news breaks, our subscribers know first
What the 200 Million Tonne Threshold Actually Represents
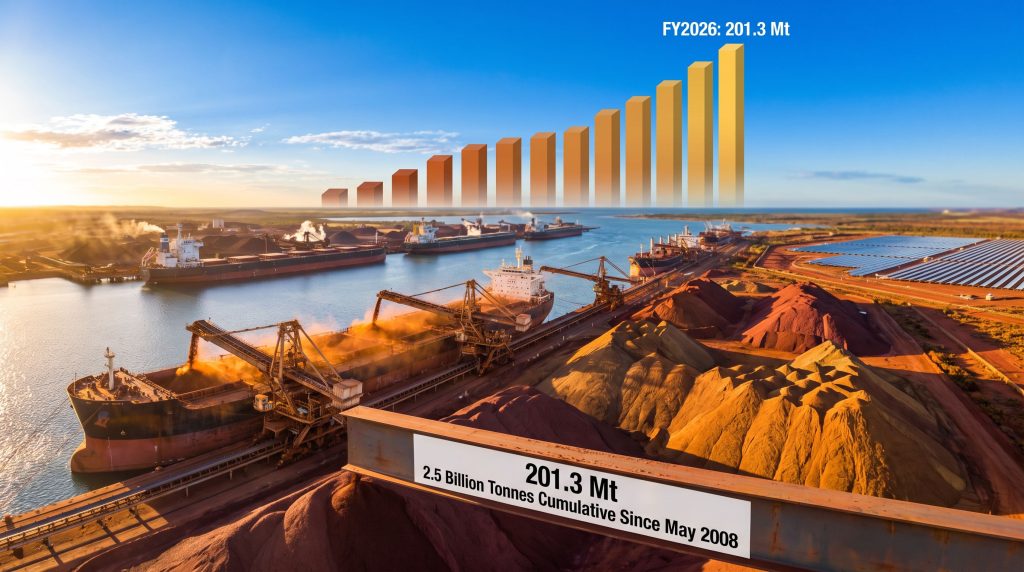
Crossing the 200 million tonne annual shipment mark is not simply a round-number celebration. It reflects a fundamental shift in production architecture. Fortescue recorded 201.3 million wet metric tonnes (wmt) in total shipments for FY2026, with a strong final quarter contributing 52.7 Mt to seal the record. Iron ore production for the year reached 246 million tonnes, a figure that sits considerably above shipment volumes due to inventory management cycles, port logistics timing, and the distinction between run-of-mine ore and export-ready product.
To contextualise the volume from a physical standpoint, 200 million tonnes is roughly equivalent to filling approximately 30,000 Olympic-sized swimming pools. Across its operational life since first export in May 2008, Fortescue has now surpassed 2.5 billion cumulative tonnes of iron ore shipped, a generational accumulation driven by a compressed growth timeline that older industry participants took far longer to achieve.
The company now facilitates more than 1,000 ore carrier loadings per year through its three ship loaders at Port Hedland, one of the most congested and high-throughput bulk commodity terminals on the planet.
| Milestone | Year | Detail |
|---|---|---|
| First iron ore export | May 2008 | Fortescue enters the global iron ore market |
| FY2026 annual shipments | 2026 | 201.3 Mt, first time above 200 Mt |
| FY2026 iron ore production | 2026 | 246 million tonnes |
| Cumulative exports | 2026 | 2.5 billion tonnes since first shipment |
| Q4 FY2026 shipments | 2026 | 52.7 Mt, critical to annual record |
Key Insight: The gap between production (246 Mt) and shipments (201.3 Mt) in FY2026 is not a sign of operational inefficiency. It reflects normal inventory build, port scheduling constraints, and the natural lag between ore extraction and vessel loading at scale.
Iron Bridge Magnetite: Why Grade Matters More Than Volume
One of the less-discussed dimensions of Fortescue's FY2026 result is the strategic importance of Iron Bridge, the company's magnetite operation in the Pilbara. Iron Bridge shipped 9 Mt of concentrate in FY2026, representing a 27% year-on-year increase, with FY2027 guidance pointing to 11 Mt to 14 Mt as the ramp-up continues.
The distinction between magnetite and hematite is worth unpacking for those less familiar with iron ore types and deposits:
- Hematite is the dominant ore type across the Pilbara and typically grades between 56% and 62% iron content after basic crushing and screening.
- Magnetite requires more intensive processing, including grinding and magnetic separation, to produce a high-grade concentrate, but the resulting product typically grades above 67% iron (Fe).
- Higher-grade iron ore reduces the coke consumption and energy requirements in blast furnace steelmaking, making it more valuable to steel mills facing tightening emissions constraints.
- In Asian steel markets, particularly in China, Japan, and South Korea, premiums for high-grade ore above 65% Fe have been structurally supported by increasingly stringent environmental performance standards at steel mills.
This dynamic makes Iron Bridge more than a volume growth story. It represents a product quality upgrade within Fortescue's portfolio, one that targets a distinct and premium pricing tier in export markets. The FY2026 guidance range of 11 to 14 Mt from Iron Bridge implies a 22% to 56% volume increase over FY2026 levels, which will be among the most closely watched operational metrics during the coming fiscal year.
The Iron Bridge Impairment: Accounting Reality vs. Asset Value
Fortescue confirmed a non-cash post-tax impairment of approximately US$525 million on Iron Bridge in FY2026, following a review of the asset's revised ramp-up schedule. This figure generated significant investor attention, but the context matters considerably.
Investor Consideration: Non-cash impairments on large-scale magnetite projects during ramp-up phases are well-precedented in the industry. They reflect changes in the timing of projected cash flows used in discounted valuation models, not deterioration in the physical ore body or underlying demand for the product. With FY2027 shipment guidance still targeting a material volume increase from Iron Bridge, the asset remains central to Fortescue's premium product strategy.
Cost Discipline in a High-Inflation Environment
Maintaining cost control across a Pilbara operation of this scale, during a period of elevated global diesel prices and labour market tightness, represents a material operational achievement. Fortescue held its full-year Hematite C1 unit cost at US$18.74 per wmt, landing within market guidance.
The C1 cost metric is an industry-standard measure that captures direct cash costs of mining and processing, including mining, processing, administration, and port and rail charges, but excludes depreciation, royalties, and sustaining capital. It is the primary benchmark used to compare operational efficiency across Pilbara producers.
FY2027 Hematite C1 cost guidance of US$20.50 to US$21.75 per wmt reflects anticipated escalation in energy, diesel, and labour inputs rather than structural inefficiency. The average realised Hematite price across FY2026 was US$91 per dry metric tonne (dmt), providing a substantial margin buffer against the projected cost rise.
| Financial Metric | FY2026 Figure |
|---|---|
| Hematite C1 unit cost | US$18.74/wmt |
| Average realised Hematite price | US$91/dmt |
| Cash balance | US$5.1 billion (AU$7.8 billion) |
| Net debt | US$0.8 billion |
| Annual capital expenditure | US$3.6 billion |
| Iron Bridge non-cash impairment (post-tax) | ~US$525 million |
| FY2027 C1 cost guidance | US$20.50 to US$21.75/wmt |
Where Fortescue Sits in the Global Producer Hierarchy
Reaching 201.3 Mt in annual shipments places Fortescue firmly inside a very exclusive group of iron ore producers operating at this scale. The competitive landscape looks like this:
| Producer | Approximate Annual Shipments | Key Differentiator |
|---|---|---|
| Rio Tinto (Pilbara) | ~330 to 340 Mt | Largest Australian exporter; long-established infrastructure |
| Vale (Brazil) | ~310 to 330 Mt | World's largest producer; Carajás high-grade reserves |
| BHP (WA operations) | ~250 to 260 Mt | Integrated supply chain; blended product suite |
| Fortescue | 201.3 Mt (FY2026) | Fastest growth trajectory; green grid integration underway |
What differentiates Fortescue's position is not just current volume, but the pace at which it reached this scale. Rio Tinto and BHP built their Pilbara systems over decades of incremental investment. Fortescue compressed a comparable growth arc into roughly 18 years, starting from a standing start in 2008. That compression reflects both the quality of its Pilbara ore bodies and an operational culture oriented toward throughput maximisation. In addition, Australia's iron ore leadership in global markets owes much to this kind of accelerated development model.
Port Hedland: The World's Largest Bulk Export Bottleneck
All of Fortescue's export volumes pass through Port Hedland in Western Australia, which holds the distinction of being the world's largest bulk commodity export terminal by annual throughput. Managing more than 1,000 ore carrier loadings per year through three ship loaders demands precision logistics coordination across an integrated system of pit-to-port rail, stockyard management, and vessel scheduling.
Port Hedland is also a shared infrastructure environment, with Fortescue, BHP, and Roy Hill all operating within the same port precinct. Throughput capacity at the port is therefore a system-wide constraint, not solely a Fortescue-specific variable, making operational efficiency at the mine and rail level critical to maximising vessel loading rates.
The Green Grid Strategy: Cost Hedge or Structural Advantage?
Fortescue's decarbonisation programme, known internally as the Real Zero target, is often framed through an environmental lens. But there is a compelling operational economics argument that receives less attention: diesel price exposure is one of the most significant and volatile components of C1 costs across Pilbara mining operations.
CEO Dino Otranto has publicly acknowledged that sustained volatility in global diesel prices strengthens the commercial logic for removing fossil fuel dependence from Fortescue's mining operations. The green grid is therefore functioning simultaneously as an ESG commitment and a long-term cost structure hedge. Consequently, advances in hydrogen iron ore reduction technology are also shaping how the broader industry approaches emissions reduction at scale.
Construction has commenced on the 690MW Turner River solar farm, which Fortescue describes as the final major solar installation required to achieve Real Zero operational decarbonisation across the Pilbara. The phased rollout of this infrastructure is designed to progressively displace diesel consumption across the mine fleet, processing facilities, and port operations.
| Renewable Infrastructure | Capacity | Strategic Role |
|---|---|---|
| Turner River Solar Farm | 690 MW | Final solar build for operational Real Zero target |
| Existing Pilbara solar installations | Multiple sites | Progressive diesel displacement already underway |
| Green grid at full buildout | TBC | Full operational renewable energy coverage |
Beyond internal cost management, Fortescue has indicated that the green grid infrastructure could eventually enable renewable energy supply to third parties beyond its own operational boundaries, opening a potential new revenue stream from excess generation capacity. This positions the energy infrastructure not purely as a cost item but as a potential commercial asset in its own right.
The next major ASX story will hit our subscribers first
Macro Significance: What This Means for Australia's Export Economy
Iron ore remains Australia's single largest export commodity by value, and Fortescue's FY2026 record reinforces the Pilbara's ongoing dominance as the world's most productive iron ore province. At a realised price of US$91/dmt, Fortescue's 201.3 Mt shipment volume implies gross revenue exposure exceeding US$18 billion for the fiscal year, a figure that flows through to Australian corporate tax receipts, Western Australian royalty payments, and broader national trade balance metrics.
The structural importance of this cannot be overstated. Australia's trade surplus with China and other Asian steel-producing nations is substantially underpinned by Pilbara iron ore exports. However, the dynamics of the China steel and iron ore market present both ongoing opportunities and material risks that producers must navigate carefully.
For investors, the FY2026 result also highlights a nuanced point about production guidance mechanics. Fortescue's FY2027 shipment guidance range of 197 Mt to 207 Mt straddles the 200 Mt threshold from below, suggesting the company is managing market expectations carefully rather than projecting dramatic volume acceleration. The midpoint of that range implies a production rate broadly consistent with FY2026, with volume upside dependent largely on how quickly Iron Bridge scales through its guided 11 to 14 Mt range.
Disclaimer: This article contains forward-looking statements and financial projections sourced from company guidance. Actual outcomes may differ materially from guidance figures due to commodity price movements, operational conditions, cost inflation, and broader macroeconomic factors. This article is informational only and does not constitute financial advice.
FY2026 Performance: Key Metrics at a Glance
- 201.3 Mt in annual shipments, the first time Fortescue has exceeded 200 Mt
- 246 Mt in total iron ore production for FY2026
- 2.5 billion tonnes in cumulative exports since May 2008
- US$18.74/wmt Hematite C1 unit cost, within full-year guidance
- US$91/dmt average realised Hematite price across FY2026
- US$5.1 billion cash balance as at year end (AU$7.8 billion)
- US$0.8 billion net debt position
- US$3.6 billion in capital expenditure deployed during FY2026
- ~US$525 million non-cash post-tax Iron Bridge impairment recognised
- 690MW Turner River solar farm under construction
- FY2027 guidance: 197 to 207 Mt total shipments, 11 to 14 Mt from Iron Bridge
Frequently Asked Questions
What does the Fortescue 200 million tonne iron ore production milestone mean in practical terms?
It marks the first fiscal year in Fortescue's history where annual shipments exceeded 200 Mt, placing the company among the world's top four iron ore exporters by volume and cementing the Pilbara's position as a globally dominant supply region. Furthermore, Fortescue's 200 million tonne achievement has been widely recognised as a landmark moment for the Australian resources sector.
Why does Fortescue's production figure differ so significantly from its shipment figure?
Production captures all ore extracted and processed, while shipments reflect what physically departs Port Hedland on vessels. The gap in FY2026, roughly 45 Mt, is attributable to inventory stockpiling, port scheduling, and the timing between mine output and vessel loading cycles.
What makes Iron Bridge strategically important beyond its current volume contribution?
Iron Bridge produces magnetite concentrate with iron grades typically above 67% Fe, compared to Fortescue's standard hematite product which grades in the 56% to 62% Fe range. Higher-grade concentrate commands pricing premiums in Asian steel markets and supports steel mills seeking to reduce emissions intensity per tonne of steel produced.
Is the Iron Bridge impairment a signal of project distress?
Not from a resource or demand perspective. The approximately US$525 million non-cash impairment reflects a revision to the ramp-up schedule used in the asset's discounted cash flow valuation model. The ore body and commercial fundamentals remain unchanged, and FY2027 guidance projects a significant increase in Iron Bridge shipment volumes.
How does the green grid strategy affect Fortescue's cost structure?
Diesel is one of the largest and most volatile cost inputs in Pilbara mining operations. Replacing diesel consumption with solar-generated electricity structurally reduces exposure to global fuel price movements, which Fortescue's leadership has identified as a key driver of anticipated C1 cost escalation in FY2027. The 690MW Turner River solar farm is the final major piece of that energy transition infrastructure.
Want to Stay Ahead of the Next Major ASX Mineral Discovery?
While Fortescue's 200 million tonne milestone illustrates the extraordinary value unlocked by large-scale resource development, the most transformative returns in the sector often begin with a single significant discovery — and Discovery Alert's proprietary Discovery IQ model delivers real-time alerts the moment such discoveries are announced on the ASX, turning complex mineral data into actionable investment insights. Explore historic discovery returns on Discovery Alert's dedicated discoveries page and begin your 14-day free trial to position yourself ahead of the broader market.