May 12, 2026
The Hidden Architecture of a Mining Giant's Comeback
Underground cave mining operates on a fundamentally different timeline than open-pit extraction. When a block cave system collapses, the remediation process is not simply a matter of clearing debris — it requires systematic geotechnical reassessment, structural reinforcement of draw points, and a methodical reactivation sequence that prioritises worker safety over production velocity. This technical reality sits at the heart of why the Freeport Grasberg recovery 2027 forecast has generated so much market commentary, and why understanding the mechanics of the recovery matters far more than debating headline timelines.
Grasberg is not just a large mine. It is one of the most geologically exceptional ore bodies ever discovered — a porphyry copper-gold deposit of extraordinary grade and scale located in the highlands of Papua, Indonesia. Its recovery trajectory is, consequently, a material variable in global copper production trends that commodity analysts, energy transition planners, and equity investors cannot afford to misread.
When big ASX news breaks, our subscribers know first
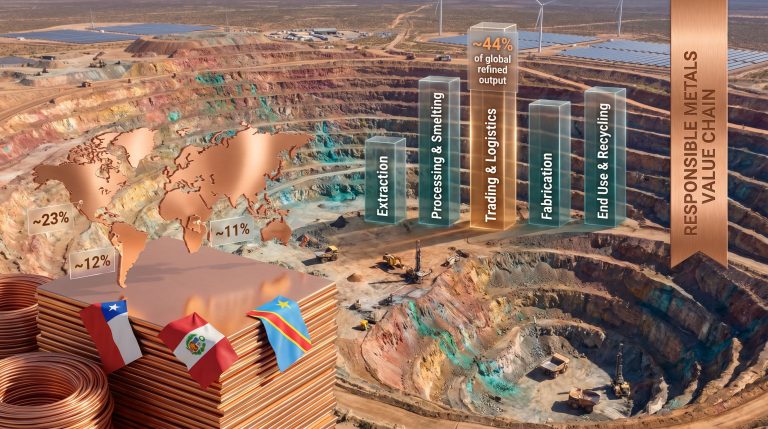
Why Grasberg's Scale Makes Its Downtime a Global Supply Event
Ranking as the world's second-largest copper-producing operation, Grasberg produces two critical commodities simultaneously: copper and gold. This dual-output structure is not merely a financial bonus. It fundamentally shapes the economics of the operation in ways that single-commodity mines cannot replicate.
When fully operational, Grasberg targets approximately 1.7 billion pounds of copper and 1.6 million ounces of gold annually. To contextualise this: global copper mine production totals roughly 22 million tonnes per year, meaning Grasberg alone represents a measurable share of worldwide output from a single site. Removing that volume from the supply equation, even partially, creates ripple effects across smelter feed schedules, concentrate markets, and refined copper inventories — further widening the global copper supply gap.
The September 2025 Landslide: What Actually Happened Underground
On September 8, 2025, approximately 800,000 tonnes of wet material collapsed within the Grasberg Block Cave (GBC), the primary high-volume production zone within the broader Grasberg minerals district. Seven workers lost their lives. Operations were immediately suspended, and Freeport-McMoRan declared force majeure, triggering an estimated insurance claim of approximately $1 billion.
The technical significance of the collapse location cannot be overstated. Block cave mining relies on gravity-driven fragmentation of ore masses, where undercutting a large ore body causes it to progressively collapse into drawpoints below. When wet, saturated material enters this system unexpectedly, it does not merely disrupt current production. It compromises the structural integrity of the entire cave geometry, requiring complete geotechnical re-evaluation before reactivation can proceed safely.
Following the suspension, operations were redirected to two unaffected underground zones:
- Deep Mill Level Zone (MLZ): A separate underground production area capable of sustaining partial output during GBC downtime
- Big Gossan: A secondary ore body providing supplementary feed volume
Limited restarts commenced in late October 2025, though production from these alternative zones represented only a fraction of the site's full capacity.
Decoding the 2027 Recovery Forecast: What Freeport Actually Said
The confusion surrounding Grasberg's recovery timeline stems from a fundamental disclosure gap between corporate-level guidance and subsidiary-level communications. On April 23, 2026, Freeport-McMoRan released its quarterly earnings materials containing revised mine plans and ramp-up progress. This disclosure anchored the company's official position: pre-incident production levels were potentially achievable by end of 2027, with full rated capacity targeted for early 2028.
Then, on May 11, 2026, Freeport issued a clarifying statement confirming that its recovery timeline remained a 2027 forecast, directly disputing media reports characterising the restart as delayed into 2028. The company stated that ramp-up progress and revised mine plans had already been publicly disclosed in connection with its April 23 earnings release, and described subsequent media framing as misleading.
The 2027 versus 2028 debate is less a factual contradiction and more a definitional question. Whether recovery means approaching historical output volumes or achieving verified 100% rated operational capacity, both timelines can coexist, depending on which benchmark is being measured.
The Phased Recovery Framework: Three Operational Stages
Understanding what recovery actually looks like at Grasberg requires mapping the site's operational progression across three distinct stages:
| Recovery Stage | Timeline | Capacity Target | Operational Focus |
|---|---|---|---|
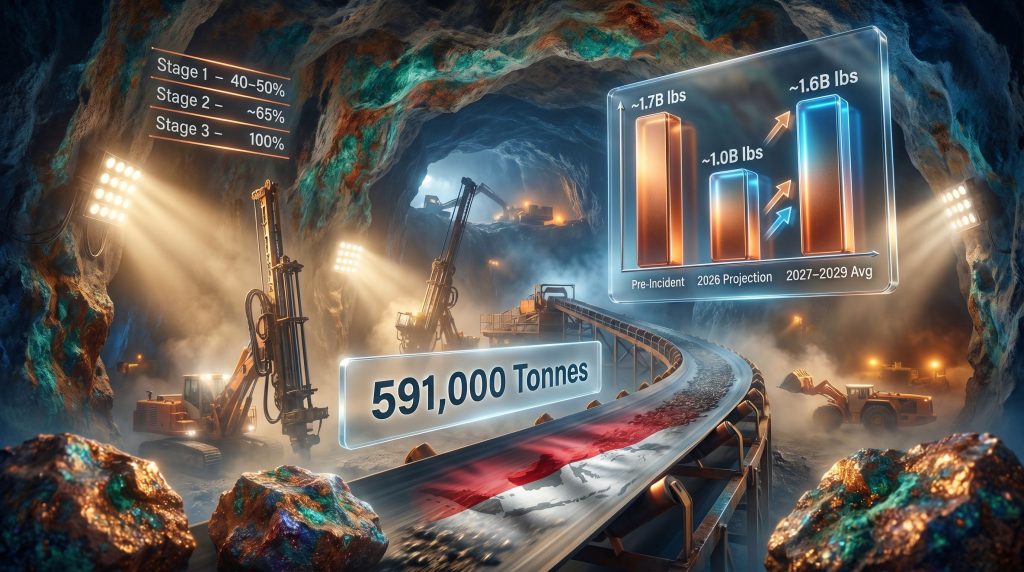
| Stage 1: Partial Restart | Late Oct 2025 to Q1 2026 | 40 to 50% | MLZ and Big Gossan operations |
| Stage 2: GBC Phased Re-entry | Q2 2026 to H2 2026 | ~65% | GBC remediation and phased ramp initiation |
| Stage 3: Full Restoration | 2027 to Early 2028 | 100% | GBC full capacity at pre-incident output |
This staged model reflects a critical operational nuance: output volume recovery and capacity certification are distinct milestones. A mine can approach its historical production rate before regulators and engineers formally verify that the full engineered capacity has been restored. This is precisely why both the 2027 and 2028 timeframes appear in different official communications without either being technically inaccurate.
Quantifying the Copper the Market Has Already Lost
The production disruption at Grasberg has carved a substantial hole in global copper supply that markets have been absorbing since late 2025. Furthermore, examining the numbers reveals the true magnitude of the impact:
| Metric | Pre-Incident Forecast | 2026 Projected Output | 2027 to 2029 Average Target |
|---|---|---|---|
| Copper Output | ~1.7 billion lbs | ~1.0 billion lbs | ~1.6 billion lbs |
| Gold Output | ~1.6 million oz | ~0.9 million oz | ~1.3 million oz |
| Capacity Utilisation | 100% | 40 to 65% | ~90 to 95% |
| Deficit vs. Forecast | Baseline | ~35% below | ~6% below peak |
Independent market analysis estimates the cumulative copper supply loss attributable to the GBC disruption at approximately 591,000 tonnes through 2026. To frame this in accessible terms, that volume is roughly equivalent to the annual copper consumption of a mid-sized industrialising economy.
The gold co-production loss is equally significant. A reduction from approximately 1.6 million ounces to roughly 0.9 million ounces annually does not merely affect FCX's revenue. Gold co-production at Grasberg plays a structural role in reducing the effective all-in sustaining cost of copper production. When gold output falls, the copper business must absorb a greater share of the mine's operating and capital costs, compressing margin and influencing how analysts model the operation's financial breakeven.
What the 591,000-Tonne Loss Means for Market Dynamics
The critical forward-looking question is not whether this supply has been lost — it already has been absorbed by the market. The operative uncertainty now centres on whether 2027 output growth from Grasberg arrives quickly enough to ease structural tightness in copper markets that were already running lean before the September 2025 incident.
Global copper markets entered the disruption period with limited inventory buffer. The London Metal Exchange and Shanghai Futures Exchange combined warehouse stocks had been declining through 2024 and into 2025, driven by accelerating demand from electric vehicle manufacturing, grid infrastructure expansion, and data centre build-out. However, Grasberg's absence from the supply equation at this particular moment amplified the impact of a disruption that might otherwise have been partially absorbed by existing stockpiles. Understanding the underlying copper price drivers helps contextualise why this single disruption carries such outsized market weight.
Three Scenarios for the 2027 to 2028 Output Path
The trajectory of Grasberg's production recovery is not a single-line forecast. It is a probability distribution across credible operational scenarios, each with distinct implications for copper pricing and FCX's financial performance.
Scenario 1: Accelerated Recovery (Bull Case)
In this scenario, GBC remediation completes ahead of the current schedule during Q2 2026. Ramp-up velocity exceeds published guidance, enabling 80% or greater capacity achievement by Q4 2026. Pre-incident production levels are restored by mid-2027, delivering copper supply relief to markets roughly six months earlier than the base case implies.
Market implications: Earlier-than-expected Grasberg volumes would arrive as a downward price catalyst for copper in H2 2027, particularly if concurrent supply-side projects in South America and Africa also progress on schedule.
Scenario 2: Base Case Recovery (FCX Guidance-Aligned)
GBC phased restart proceeds through H2 2026 as planned. The mine reaches approximately 65% capacity by year-end 2026, with pre-incident output levels approached by end of 2027. Full rated capacity is achieved in early 2028 as originally scheduled.
Market implications: Copper supply tightness persists through 2026 and into 2027. Gradual supply normalisation through 2027 supports an elevated price environment, though upside pressure moderates as recovery progress becomes visible in quarterly production reports.
Scenario 3: Delayed Recovery (Bear Case)
Additional geotechnical complications — whether from unexpected rock mechanics in the GBC remediation zone, adverse weather, or regulatory interventions — extend the recovery timeline. 2027 output remains materially below pre-incident levels, with full capacity restoration pushed firmly into late 2028 or beyond.
Market implications: Sustained copper supply tightness, amplified by concurrent demand growth from energy transition sectors, would support elevated copper prices for an extended period. In addition, the resulting copper supply crunch could intensify pressure on already-strained global inventories.
Bear case scenarios in block cave mining carry higher-than-typical probability compared to surface mining disruptions. Underground cave systems involve complex rock mechanics that are difficult to model precisely, and remediation timelines in these environments have historically surprised to the downside at other major operations globally.
Disclaimer: The scenario analysis above represents forward-looking projections based on current operational guidance and publicly available information. Actual outcomes may differ materially from any of these scenarios. This content does not constitute financial advice.
The Indonesia Dimension: Sovereign Ownership and Communication Complexity
One underappreciated driver of the 2027 versus 2028 narrative divergence is the governance structure of PT Freeport Indonesia itself. The Indonesian government holds a 51.2% stake in PTFI through its state mining holding company MIND ID, meaning the operation is majority-owned by a sovereign entity. This ownership structure creates a situation where PTFI management and FCX corporate leadership may communicate to different stakeholder audiences with different sensitivities.
PTFI operates under a Special Mining Business Licence (IUPK) framework, which subjects the operation to Indonesian regulatory oversight at the ministry level. When statements from a PTFI director suggested a 2028 full restart, and FCX corporate subsequently characterised this framing as misleading, the divergence may reflect more than simple miscommunication. It may, in fact, reflect the inherent tension between a US-listed parent company managing equity market expectations and an Indonesian majority-owned subsidiary navigating domestic regulatory relationships.
For investors, this stakeholder communication complexity is a persistent risk factor worth incorporating into confidence intervals around the Freeport Grasberg recovery 2027 forecast.
The next major ASX story will hit our subscribers first
Broader Copper Market Implications Through 2027
Grasberg's recovery trajectory does not operate in a vacuum. The mine's return to full output will land in a copper market shaped by several converging forces:
- Energy transition demand acceleration: Electric vehicle production, utility-scale battery storage, and grid modernisation programmes are driving structural copper demand growth across North America, Europe, and Asia
- Constrained greenfield pipeline: Few large-scale copper projects beyond existing operations are scheduled to enter production before 2028, limiting supply-side flexibility
- Concentrate tightness: Reduced Grasberg output has tightened the global copper concentrate market, affecting smelter utilisation rates and treatment charge economics
- Gold co-production economics: Recovery of Grasberg's gold output from approximately 0.9 million ounces toward 1.3 million ounces by 2027 to 2029 will gradually reduce FCX's effective copper production costs, improving the operation's competitive cost position
The interaction between these forces and the Freeport Grasberg recovery 2027 forecast creates a window of sustained copper market tightness through at least mid-2027, followed by gradual normalisation as GBC volumes ramp. Analysts and traders tracking the copper price outlook should assign significant weight to Grasberg's quarterly production reports as leading indicators of whether the base case or bear case scenario is materialising. Furthermore, interpreting drilling results from adjacent exploration programmes may offer additional context for assessing the longer-term resource base underpinning the site's future output.
Frequently Asked Questions: Grasberg Recovery Forecast
Is the Grasberg mine fully operational in 2026?
No. As of mid-2026, the Grasberg minerals district is operating at approximately 40 to 65% of its pre-incident capacity. The Grasberg Block Cave, which serves as the primary high-volume production zone, remains in a phased restart process following the September 2025 landslide event.
What is Freeport-McMoRan's official 2027 production forecast for Grasberg?
FCX projects the 2027 to 2029 average annual output at approximately 1.6 billion pounds of copper and 1.3 million ounces of gold, approaching but not fully matching the pre-incident peak targets of 1.7 billion pounds of copper and 1.6 million ounces of gold annually.
Will Grasberg reach 100% capacity in 2027 or 2028?
FCX's guidance indicates pre-incident production levels are potentially achievable by end of 2027, while full rated operational capacity is targeted for early 2028. The distinction reflects the operational difference between output volume recovery and verified capacity certification.
How much copper supply has the Grasberg disruption removed from global markets?
Independent market analysis estimates a cumulative copper supply loss of approximately 591,000 tonnes through 2026 as a direct consequence of the GBC disruption and extended partial-capacity operations.
What caused the September 2025 production disruption?
A major underground landslide on September 8, 2025, involving approximately 800,000 tonnes of wet material within the Grasberg Block Cave, resulted in seven worker fatalities, triggered an immediate operational suspension, and led to a force majeure declaration by Freeport-McMoRan.
Key Takeaways for Investors and Market Watchers
- The 2027 recovery forecast is operationally credible under the base case scenario, contingent on GBC remediation proceeding without additional geotechnical complications
- The 591,000-tonne cumulative supply loss through 2026 has already been absorbed by markets, making 2027 recovery velocity the primary remaining variable in copper supply modelling
- The 2027 versus 2028 timeline debate is definitional, not contradictory — output volume recovery and rated capacity certification are separate operational milestones that can occur on different schedules
- Gold co-production recovery from roughly 0.9 million ounces toward 1.3 million ounces provides a secondary financial tailwind to FCX's cost structure as the mine normalises
- Indonesia's sovereign ownership structure through MIND ID introduces a layer of stakeholder communication complexity that investors should factor into confidence intervals around published timelines
- The bear case carries non-trivial probability given the complexity of underground block cave remediation and the limited engineering precedent for rapid recovery from a landslide event of this scale
This article is intended for informational purposes only and does not constitute investment or financial advice. All production forecasts, scenario projections, and market analysis are based on publicly available information current to May 2026 and are subject to change. Readers should conduct independent research and consult qualified financial advisers before making investment decisions.
Want to Stay Ahead of Major Commodity Discoveries Before the Market Moves?
While Grasberg's recovery highlights how pivotal large-scale copper and gold operations are to global supply dynamics, Discovery Alert's proprietary Discovery IQ model scans ASX announcements in real time to identify significant mineral discoveries the moment they are made public — explore historic examples of exceptional discovery returns and begin your 14-day free trial to position yourself ahead of the broader market.