July 23, 2026
When a Single Mine Can Move Global Markets
Underground cave mining operates on timescales that most industries would find unrecognisable. A block cave operation requires years of development before the first tonne of ore flows, and when something goes wrong deep inside that geological column, the consequences ripple outward through commodity markets, smelter schedules, and investor portfolios with equal force. That dynamic is precisely what makes Freeport second quarter earnings Grasberg recovery so consequential for anyone watching the global copper supply picture heading into 2027.
Grasberg, nestled in the highlands of Papua, Indonesia, is not simply a large mine. It is one of the few operations on earth capable of single-handedly shifting the global copper and gold supply balance in a given quarter. When its output contracts sharply, the effects are measurable in LME inventory movements, treatment charge negotiations, and the forward curves that traders use to price physical metal months in advance.
When big ASX news breaks, our subscribers know first
How Did Freeport Perform Financially in Q2 2026?
Adjusted Earnings, Net Income and Per-Share Breakdown
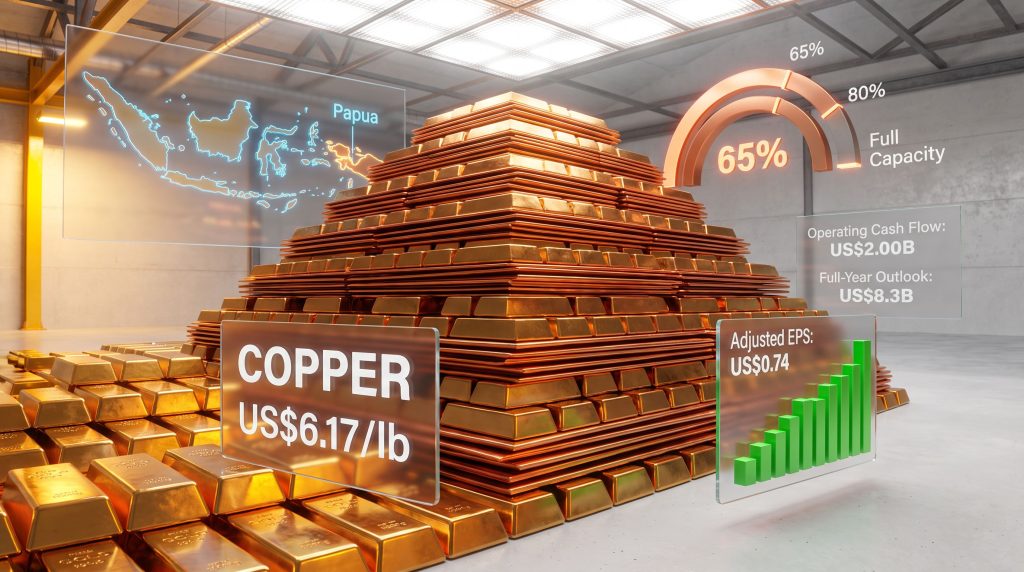
The headline numbers from Freeport's second quarter surprised to the upside. Adjusted net income reached US$1.1 billion, translating to US$0.74 per share and comfortably exceeding the FactSet consensus estimate of US$0.62 per share. Freeport beat first-quarter profit expectations on higher copper prices, and the Q2 result continued that trend. Reported net income attributable to common shareholders came in at US$984 million, or US$0.68 per share.
The gap between adjusted and reported figures reflects US$96 million in post-tax charges excluded from the adjusted result, primarily idle facility costs and remediation obligations arising from the September 2025 mudflow incident at PT Freeport Indonesia (PTFI).
| Financial Metric | Q2 2026 |
|---|---|
| Adjusted Net Income | US$1.10B |
| Reported Net Income | US$984M |
| Adjusted EPS | US$0.74 |
| Reported EPS | US$0.68 |
| Operating Cash Flow | US$2.00B |
| Capital Expenditure | US$1.10B |
What Drove the Beat: Price Realization vs. Volume Shortfall
The earnings beat was almost entirely a commodity price story. Copper's realized price of US$6.17 per pound during Q2 2026, compared to US$4.54 per pound in the same period of 2025, represents a 35.9% year-over-year increase that overwhelmed a meaningful volume shortfall from Indonesia. This is a critical distinction for investors: Freeport did not beat expectations because it produced more copper — it beat because each pound it did sell was worth dramatically more.
Understanding the broader copper price growth drivers helps contextualise why Freeport's realized prices remained so elevated throughout the period. Gold at US$4,520 per ounce and molybdenum at US$28.75 per pound further compounded the benefit, reinforcing the role that Grasberg's dual-metal economics play in blended revenue generation.
The Role of Insurance Proceeds in Operating Cash Flow
Operating cash flow of US$2.0 billion for the quarter carries an important asterisk. Embedded within that figure is US$700 million in pre-tax insurance income connected to the September 2025 PTFI mudflow event. Net of US$600 million in working capital movements and tax payments, the underlying cash generation was still robust. However, investors evaluating the quality of cash flow should note that insurance-related receipts are by definition non-recurring.
The presence of a US$700 million insurance settlement within a single quarter's operating cash flow serves as a reminder that headline cash flow figures in mining require careful decomposition. One-time items, inventory timing, and tax payment phasing can all create significant noise around underlying operational performance.
How Did Copper, Gold and Molybdenum Prices Amplify Q2 Results?
| Commodity | Q2 2026 Realized Price | Q2 2025 Realized Price | Change |
|---|---|---|---|
| Copper | US$6.17/lb | US$4.54/lb | +35.9% |
| Gold | US$4,520/oz | Not disclosed | N/A |
| Molybdenum | US$28.75/lb | Not disclosed | N/A |
Why Copper Price Realization Above US$6.00/lb Is a Structural Inflection Point
A realized copper price above the US$6.00 per pound threshold is not merely a financial milestone for Freeport. It signals a broader structural condition in the copper market where supply constraints, rising energy transition demand, and multi-year underinvestment in new mine development are converging. Furthermore, the ongoing copper supply crunch continues to exert upward pressure on prices globally.
For a company of Freeport's scale, each US$0.10 per pound movement in copper price translates to hundreds of millions of dollars in annual revenue, making price realization arguably more important than short-term volume fluctuations during a recovery period.
Gold as a Margin Amplifier: Grasberg's Dual-Metal Economics
Grasberg's porphyry copper-gold deposit is unusual in the global mining landscape for the sheer scale of its gold endowment relative to copper. Unlike many porphyry deposits where gold is a minor byproduct credit, at Grasberg the gold stream is economically significant enough to materially alter project economics, fund capital expenditure, and provide a natural hedge when copper prices soften.
The realized gold price of US$4,520 per ounce in Q2 2026 amplified returns at a time when copper volumes were constrained by the ongoing ramp-up.
Molybdenum's Contribution to Blended Revenue Diversification
Molybdenum, often overlooked in copper mining narratives, provides meaningful revenue diversification across Freeport's US and South American operations. As a critical input for high-strength steel alloys used in energy infrastructure and industrial applications, molybdenum pricing at US$28.75 per pound in Q2 2026 contributed to the company's blended revenue base in a way that partially insulates overall financial performance from pure copper price movements.
What Is the Current State of Grasberg Block Cave Recovery?
Understanding the September 2025 Mudflow Incident and Its Operational Consequences
The September 2025 mudflow at PTFI was an external incident that caused significant disruption to underground haulage infrastructure at Grasberg Block Cave. Block cave mining depends on the controlled and continuous gravity-driven flow of broken ore from the extraction level through drawpoints, crushers, and haulage tunnels to the surface processing facilities. Any disruption to the material handling chain has cascading effects on throughput that can persist for months or years.
Remediation and restoration of the affected production zones was completed ahead of a late-March 2026 timeline, enabling the ramp-up of Blocks 2 and 3 to commence at the end of the first quarter of 2026. Ongoing improvements to the material handling system at the Grasberg haulage level were still underway during Q2 2026, reflecting the technical complexity of restoring a large-scale underground cave to full operational rhythm.
Q2 2026 Indonesia Production vs. Prior Year: The Volume Gap
The scale of the production impact becomes clear in a direct year-on-year comparison:
| Production Metric | Q2 2026 (Indonesia) | Q2 2025 (Indonesia) | Decline |
|---|---|---|---|
| Copper Production | 205M lbs | 359M lbs | -42.9% |
| Gold Production | 184K oz | 311K oz | -40.8% |
| Copper Sales | 153M lbs | 443M lbs | -65.5% |
| Gold Sales | 118K oz | 518K oz | -77.2% |
The sales decline is even more pronounced than the production decline, which leads directly to the question of where the gap went.
Why the Sales-to-Production Gap in Indonesia Reflects Smelter Inventory Deferrals
Approximately 100 million pounds of copper and 50,000 ounces of gold produced during the period were not sold but instead deferred into inventory at PTFI's downstream smelting operations. This distinction matters for investors: production is occurring, but the timing of when that metal moves through the smelter and into saleable form does not always align perfectly with production periods.
Consequently, the inventory build effectively shifts revenue recognition into future quarters, which means H2 2026 sales figures should benefit from the catch-up as smelter throughput normalises alongside rising mine production rates.
What Is Freeport's Grasberg Recovery Timeline Through 2027?
Phased Recovery Milestones:
- H2 2026: Approximately 65% of full operating capacity targeted
- Mid-2027: Approximately 80% of full capacity expected
- End-2027: Approach to full nameplate capacity anticipated
According to Freeport's official update on Grasberg restart plans, the company remains committed to restoring full production capacity within this phased framework, though operational variables continue to influence the precise trajectory.
Key Risks to the Recovery Timeline: Technical, Regulatory and Operational Variables
The phased recovery timeline carries inherent uncertainty. Block cave mines are geomechanically complex systems where the behaviour of the caving column, the integrity of drawpoints, and the performance of haulage and crushing infrastructure must all perform within design parameters simultaneously. Key risk factors include:
- Unexpected geotechnical events such as drawpoint collapses or hang-ups that interrupt ore flow
- Performance of newly rehabilitated material handling equipment under increasing throughput loads
- Regulatory requirements specific to Indonesian mining operations at PTFI, including permit conditions and government oversight of the operational restart
- Labour availability and training for underground crews returning to full operational intensity
- Potential for secondary mudflow or ground instability events in the same geological zone
How Grasberg's Ramp Trajectory Compares to Other Major Underground Cave Mining Recoveries
Large-scale block cave recoveries after unplanned events are rare enough that direct historical comparisons are limited. However, general industry experience indicates that underground cave systems rarely snap back to full production on a linear trajectory. The relationship between drawpoint development, cave propagation, and surface infrastructure capacity creates natural bottlenecks that tend to produce an S-curve recovery profile rather than a straight line.
Freeport second quarter earnings Grasberg recovery guidance — targeting 65% capacity by end-2026, 80% by mid-2027, and full capacity by end-2027 — is consistent with this established pattern.
How Are Freeport's Americas Operations Compensating for Indonesia's Shortfall?
United States Operations: Stability as a Strategic Buffer
| US Operations Metric | Q2 2026 | Q2 2025 |
|---|---|---|
| Copper Production | 332M lbs | 336M lbs |
| Copper Sales | 312M lbs | 308M lbs |
The near-perfect stability in US copper output demonstrates the operational maturity of Freeport's American asset base. Key producing operations including Morenci, Bagdad, Safford, Sierrita, Chino, Tyrone, and Miami collectively represent one of the most geographically diversified copper portfolios in the world, spanning Arizona and New Mexico. The US portfolio also encompasses smelting, refining, and rod manufacturing infrastructure that adds downstream value capture to raw mine output.
South American Operations: Cerro Verde and El Abra Performance
| South America Metric | Q2 2026 | Q2 2025 |
|---|---|---|
| Copper Production | 249M lbs | 268M lbs |
| Copper Sales | 245M lbs | 265M lbs |
South American production softened modestly due to two well-understood factors: lower-grade ore sequencing and reduced heap leach output. In addition, the Chile copper supply gap underscores how critical consistent South American output is to balancing global copper markets during periods of disruption elsewhere.
Cerro Verde in Peru and El Abra in Chile's Antofagasta Region are the primary contributors to South American output, and both operations are central to Freeport's longer-term growth strategy in the region.
The next major ASX story will hit our subscribers first
What Is the El Abra Expansion Project and Why Does It Matter?
El Abra's Strategic Position in Freeport's Long-Term Growth Pipeline
El Abra sits in one of the world's most copper-rich geological corridors, the Atacama Desert of northern Chile. The existing operation is a large-scale, low-grade open-pit mine producing copper cathode through a solvent extraction and electrowinning (SX-EW) process applied to heap leached material. The proposed expansion would fundamentally transform El Abra's processing model by adding large-scale milling and flotation capacity capable of treating sulphide ore that existing leach infrastructure cannot economically process.
The Proposed Large-Scale Concentrator: Scope and Potential Output
The conceptual design for the El Abra expansion is modelled on the concentrator configuration deployed at Cerro Verde, which itself underwent a major expansion in 2016 that roughly tripled that operation's throughput capacity. If El Abra follows a comparable pathway, the incremental copper production potential of more than 700 million pounds per year would effectively transform El Abra from a mid-sized producer into one of the largest copper mines in the world.
Environmental Permitting Status in Chile
In March 2026, El Abra submitted an Environmental Impact Assessment (EIA) to Chilean regulatory authorities. This is a foundational step in Chilean mining permitting, but it represents the beginning rather than the end of a process that typically extends over multiple years and involves detailed review, community consultation, and the potential for conditions or modifications to be imposed on the project design.
Investment Threshold Context:
Preliminary internal estimates suggest El Abra's expansion economics are supported at a copper incentive price below US$4.00 per pound, a threshold well beneath current spot and realized prices. These estimates remain subject to permitting outcomes, updated capital cost estimates, market conditions, and formal capital allocation decisions. They should not be treated as committed guidance.
Decision Gate Factors: Permits, Market Conditions and Capital Prioritisation
A final investment decision on El Abra will ultimately depend on the resolution of the EIA process, which in Chile can be influenced by environmental assessments of water usage in the Atacama region, biodiversity impact reviews, and social consultation requirements with indigenous communities. Capital allocation decisions will also need to weigh El Abra against the ongoing Grasberg recovery capital needs and other portfolio priorities.
How Is Freeport's Leaching and Technology Initiative Performing?
What the Leaching Innovation Program Targets and How It Works
Freeport's leaching technology initiative targets copper recovery from ore types and stockpile configurations that conventional heap leaching underperforms. For instance, the copper leaching process has seen significant innovation industry-wide, and Freeport's program reflects that broader shift. The initiative combines several distinct technical approaches:
- Operational enhancements to solution distribution, flow rates, and irrigation scheduling on existing leach pads
- Data analytics to identify under-performing zones within large heap structures and optimise acid application
- Proprietary additive testing involving chemical agents designed to accelerate the kinetics of copper dissolution from sulphide-bearing ore fractions that resist standard acid leaching
- Thermal treatment of stockpiles using controlled heat application to drive chemical reactions that unlock copper from refractory mineral structures
The last two points represent a meaningful technical departure from conventional heap leach practice. Standard heap leaching works well on oxide copper minerals but is largely ineffective on primary sulphide minerals like chalcopyrite, which accounts for the majority of copper in most porphyry deposits.
Q2 2026 Incremental Output From Leaching Initiatives
| Period | Incremental Copper From Leaching |
|---|---|
| Q2 2026 | 47M lbs |
| H1 2026 (cumulative) | 101M lbs |
| Annualized Target (end-2026) | 300M lbs/year |
Why 300 Million Lbs of Annual Leaching Output Would Be Equivalent to a Mid-Tier Mine
An annualized leaching contribution of 300 million pounds places this initiative in the same output range as a standalone mid-tier copper mine. Furthermore, what makes it strategically distinctive is the absence of new mine development capital, permitting timelines, or greenfield construction risk.
The incremental copper is being extracted from resources already within Freeport's existing operational footprint, using infrastructure that is largely already in place. A similar development philosophy underpins the major copper-gold project approach of maximising returns from known geological resources. The capital efficiency of this approach, if technical targets are achieved, would be highly attractive relative to the cost of building equivalent greenfield capacity.
What Does Freeport's Balance Sheet and Capital Allocation Look Like?
| Balance Sheet Item | As of June 2026 |
|---|---|
| Cash and Equivalents | US$4.10B |
| Consolidated Debt | US$9.40B |
| Net Debt (ex-PTFI downstream) | US$2.10B |
Capital Expenditure Breakdown: Projects vs. Sustaining
| CapEx Category | Q2 2026 | Full-Year 2026 Guidance |
|---|---|---|
| Total CapEx | US$1.10B | ~US$4.30B |
| Major Mining Projects | US$700M | ~US$3.00B |
The weighting of capital toward major projects rather than sustaining expenditure reflects the investment intensity of the Grasberg recovery, ongoing underground development, and the downstream smelting infrastructure at PTFI. For investors evaluating free cash flow generation, the distinction between growth and sustaining capital is important: a significant portion of current CapEx is discretionary in the sense that it is building future capacity rather than simply maintaining current output.
Shareholder Returns: Buybacks and Cerro Verde Stake Accumulation
During Q2 2026, Freeport repurchased 1.7 million FCX shares for US$110 million and acquired 2 million additional Cerro Verde shares for US$107 million, lifting its ownership in that operation from 55.08% to 55.66%. The Cerro Verde stake increase is strategically notable because it concentrates Freeport's economic exposure to one of the most consistent copper producers in the Americas at a time when the company is building its long-term South American growth platform.
What Is Freeport's Full-Year 2026 Production and Financial Guidance?
Annual Sales Volume Targets
| Commodity | Full-Year 2026 Guidance | Q3 2026 Guidance |
|---|---|---|
| Copper | ~3,100M lbs | ~750M lbs |
| Gold | ~650K oz | ~160K oz |
| Molybdenum | ~93M lbs | ~22M lbs |
Operating Cash Flow Projection and Commodity Price Assumptions
Full-year 2026 operating cash flow is projected at approximately US$8.3 billion, based on second-half price assumptions of US$6.00 per pound for copper, US$4,000 per ounce for gold, and US$30 per pound for molybdenum. Given that realized copper prices in Q2 2026 already came in at US$6.17 per pound, and gold at US$4,520 per ounce, the second-half price assumptions embedded in guidance appear conservative relative to prevailing market conditions.
If spot prices remain elevated, there is potential for operating cash flow to exceed the US$8.3 billion projection.
Disclaimer: Commodity price forecasts and production guidance involve inherent uncertainty. Forward-looking statements by companies are based on assumptions that may not materialise. This article does not constitute financial advice.
Why Production Will Exceed Sales in 2026: The PTFI Smelter Inventory Effect
One of the less immediately obvious dynamics in Freeport's 2026 outlook is that total copper and gold production for the year is expected to exceed total sales volumes. The mechanism behind this gap is the approximately 100 million pounds of copper and 50,000 ounces of gold currently held in inventory within PTFI's smelting operations. As smelter throughput catches up with rising mine production during the second half of the year, the release of this inventory into saleable form will support sales volumes even in periods where mine production is still ramping toward full capacity.
Frequently Asked Questions: Freeport Q2 2026 Earnings and Grasberg Recovery
What caused Freeport's Q2 2026 copper sales to fall below prior-year levels?
The primary driver was the significantly reduced operating rate at Grasberg Block Cave in Indonesia following the September 2025 mudflow incident. With production at roughly a fraction of normal rates during the ramp-up phase, Indonesia contributed far fewer pounds to consolidated sales than in the prior year period.
How much did the September 2025 mudflow incident cost Freeport in lost production?
A direct year-on-year comparison shows Indonesia's copper production fell by approximately 154 million pounds in Q2 alone, with copper sales down by roughly 290 million pounds compared to Q2 2025. These figures represent lost revenue across multiple quarters and are partially reflected in the US$700 million insurance settlement received during Q2 2026.
When will Grasberg Block Cave return to full operational capacity?
Freeport's phased guidance targets approximately 65% capacity by H2 2026, 80% by mid-2027, and full nameplate capacity approaching by end-2027. These timelines are subject to operational, technical, and regulatory variables.
Did Freeport beat or miss analyst expectations in Q2 2026?
Freeport beat the FactSet consensus estimate meaningfully, with adjusted EPS of US$0.74 against an expected US$0.62 per share, a beat of approximately 19%. The Freeport second quarter earnings Grasberg recovery narrative was consequently more positive than many analysts had anticipated entering the reporting period.
What is the El Abra expansion project and when could it reach a final investment decision?
El Abra's proposed large-scale concentrator expansion submitted its EIA to Chilean authorities as of March 2026. A final investment decision timeline has not been formally committed and will depend on permitting outcomes, capital allocation priorities, and market conditions at the time of decision.
How is Freeport's leaching technology program contributing to copper output?
The program contributed 47 million pounds of incremental copper in Q2 2026 and 101 million pounds in the first half of the year, with a target of reaching an annualised rate of 300 million pounds by end-2026.
What are Freeport's copper and gold sales targets for the remainder of 2026?
Full-year copper sales guidance stands at approximately 3,100 million pounds, with Q3 2026 guidance of 750 million pounds. Gold sales guidance for the full year is approximately 650,000 ounces, with Q3 guidance of 160,000 ounces.
Key Takeaways: What Freeport's Q2 2026 Results Signal for Copper Markets and Mining Investors
Price Leverage as a Structural Earnings Cushion During Volume Disruptions
The Q2 2026 result demonstrates a principle that experienced mining investors understand well: at sufficiently elevated commodity prices, volume shortfalls can be absorbed without destroying earnings quality. A copper price above US$6.00 per pound effectively buys time for operational recoveries that would be financially devastating at US$3.50 per pound. This dynamic explains why Freeport was able to beat consensus expectations despite producing and selling significantly less copper than a year earlier.
Grasberg's Recovery Trajectory as a Forward Indicator for Global Copper Supply
As Grasberg gradually restores capacity through 2026 and 2027, the incremental copper and gold volumes flowing from the mine will represent a meaningful addition to global supply at a time when new mine development pipelines remain constrained globally. Investors tracking the copper supply-demand balance should monitor PTFI's quarterly production reports as a leading indicator of tightness or relief in the physical market.
The Americas Portfolio's Role as a Diversification and Stability Anchor
Freeport's US and South American operations demonstrated their value during Indonesia's disruption by maintaining collectively stable output. The operational diversification across multiple jurisdictions, mining methods, and ore types provides a resilience that single-asset or single-country producers cannot replicate.
Long-Duration Growth Options: El Abra, Leaching Technology and PTFI Downstream Integration
The combination of a potentially transformative El Abra expansion, a leaching technology program targeting 300 million pounds per year of incremental low-capital-intensity output, and the ongoing optimisation of PTFI's downstream smelting infrastructure represents a multi-layered growth optionality that extends well beyond the immediate Grasberg recovery narrative. For long-duration investors, these are the elements worth tracking alongside the near-term production ramp.
What FCX's Q2 2026 Performance Implies for Copper Supply Tightness Into 2027
The smelter inventory deferral of approximately 100 million pounds of copper creates a visible pipeline of sales that will flow through in coming quarters. Combined with Grasberg's production recovery curve and continued leaching gains in the Americas, Freeport second quarter earnings Grasberg recovery data suggests growing tightness in available copper supply through mid-2027 as global demand continues to absorb what the market produces. For the broader copper market, that is a signal that structural price support may prove more durable than cyclical narratives suggest.
This article is published for informational purposes only and does not constitute investment advice. Production guidance, financial projections, and commodity price assumptions involve material uncertainty and may differ significantly from actual outcomes. Readers should conduct their own research and consult qualified financial advisors before making investment decisions.
For ongoing coverage of major mining company results across Latin America and globally, readers can explore related reporting published by Reporte Minero at reporteminero.cl.
Want to Track the Next Major Copper Discovery Before the Market Does?
Discovery Alert's proprietary Discovery IQ model scans ASX announcements in real time, instantly identifying significant mineral discoveries — including copper — and translating complex geological data into actionable investment insights for traders and investors at every experience level. Explore how historic discoveries have generated substantial returns on Discovery Alert's dedicated discoveries page, and begin your 14-day free trial today to position yourself ahead of the market.