August 20, 2026
When Geography Becomes the Most Valuable Asset in Energy Markets
In commodity markets, location is rarely discussed as a competitive moat. But in 2026, geography has emerged as perhaps the single most powerful determinant of refinery profitability. U.S. and Indian fuel exporters profiting from supply uncertainty during wars have demonstrated how conflicts eliminate or severely restrict fuel-producing regions from global trade networks. Refineries that operate beyond the reach of those disruptions do not simply fill a gap — they inherit a structural pricing premium that compounds with every new escalation, every shipping lane closure, and every refinery struck by a drone.
Understanding how this dynamic works — mechanically, commercially, and geopolitically — requires looking beyond the headlines and into the underlying architecture of global refinery economics. Furthermore, tracking oil price trends helps contextualise just how significantly the war-driven disruption has shifted baseline market expectations.
When big ASX news breaks, our subscribers know first
The Supply Arithmetic Behind the Windfall
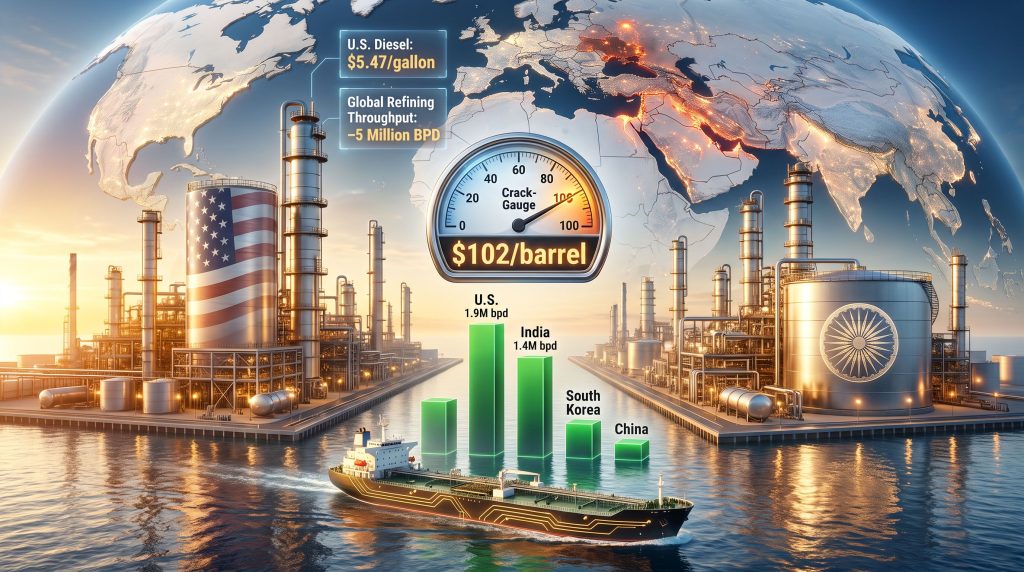
Global refining throughput fell to approximately 89 million barrels per day in July 2026, according to International Energy Agency data — a decline of roughly 5 million barrels per day compared to the same period in 2025. Critically, global oil demand has not declined to match. Consumption continues to exceed 100 million barrels per day, meaning the world is consuming far more fuel than it is currently producing from refineries operating at reduced capacity.
This gap does not resolve itself quietly. It expresses itself through price. The wider the shortfall between refinery output and end-user demand, the higher the margin available to any refiner capable of producing and delivering product into that deficit.
Key Statistics: Global Fuel Supply Disruption Snapshot (2026)
| Metric | 2025 Baseline | 2026 (War-Disrupted) | Change |
|---|---|---|---|
| Global refining throughput | ~94 million bpd | ~89 million bpd | -5 million bpd |
| Global oil demand | ~100+ million bpd | ~100+ million bpd | Demand unchanged |
| U.S. distillate exports (week ended Aug 7) | Below record | 1.9 million bpd (record) | Significant increase |
| U.S. jet fuel exports | 455,000 bpd (record, May) | 443,000 bpd | Near-record |
| U.S. diesel pump price | ~$3.65/gallon (prior year est.) | $5.47/gallon | ~+50% YoY |
| U.S. diesel crack spread | Historical range | $102/barrel (record) | All-time high |
The conflicts in Iran and Ukraine have not just removed barrels from the market — they have introduced persistent uncertainty into refinery investment planning across the Middle East and Eastern Europe. When operators cannot confidently project whether their infrastructure will be operational next month, throughput decisions become deeply conservative. That conservatism cascades through the entire regional supply chain.
In addition, the ongoing US-China trade war has further complicated global energy flows, layering additional geopolitical friction onto already strained refinery economics and trade relationships.
The U.S. Refinery Boom: Record Exports, Record Margins, and a Domestic Political Tightrope
American refiners have responded to the global shortfall in a manner that is both economically rational and politically complicated. U.S. distillate exports reached a record 1.9 million barrels per day in the week ended August 7, 2026, according to government data. Jet fuel exports came in at 443,000 barrels per day, just below the record of 455,000 barrels per day set in May 2026.
These are not marginal improvements — they represent a fundamental reorientation of U.S. refinery output toward international buyers willing to pay a significant premium over domestic benchmarks. Consequently, global commodity tariffs have added another dimension to how refined products are priced and routed across international markets.
Understanding the Crack Spread Signal
The financial mechanism driving this behaviour is the crack spread, which measures the difference between the market price of refined petroleum products and the cost of the crude oil feedstock required to produce them.
A crack spread of $102 per barrel means U.S. refiners are capturing approximately $102 more per barrel of diesel sold than they paid for the crude oil input. By historical standards, this is an extraordinary margin — roughly double what would typically be considered a strong refinery profitability environment.
U.S. diesel margins, measured as the spread between diesel futures and WTI crude, hit a record high exceeding $102 per barrel in mid-August 2026, driven in part by fresh attacks on refinery infrastructure across the Middle East and Russia. According to Gulf Oil analyst Tom Kloza, some refined products are fetching approximately twice the value of their feedstock crude — an incentive structure so powerful that it has kept U.S. refiners running at near-maximum capacity almost continuously since active conflict in the Iran theater began.
The Political Constraint: Domestic Prices vs. Export Profitability
The financial upside for U.S. refiners is not operating in a political vacuum. The Trump administration has made domestic gasoline affordability a central campaign theme ahead of November midterm elections, and the divergence between refinery profitability and pump prices has created a genuine policy tension with no clean resolution.
Consider the following data points in combination:
- U.S. gasoline stockpiles sat approximately 6% below the five-year seasonal average as of August 7, 2026, at 208.7 million barrels — partly because refiners have prioritised jet fuel production over gasoline given stronger export margins for aviation fuel
- The U.S. Energy Information Administration revised its 2026 average retail gasoline price forecast upward to $2.91 per gallon, roughly 6% above its prior estimate, yet current pump prices exceed $4 per gallon
- U.S. diesel at the pump averaged $5.47 per gallon as of mid-August 2026 — nearly 50% higher than the equivalent period in 2025, according to motorist association AAA
- Jet fuel demand in the U.S. averaged approximately 2 million barrels per day, well above the 1.6 million barrels per day recorded in the same period of the prior year
- Gasoline demand averaged close to 9 million barrels per day, roughly flat year-on-year
The policy paradox is stark. Analyst Tom Kloza has noted that even a verbal signal from the White House regarding potential export restrictions could push diesel crack spreads down by approximately $20 per barrel, delivering a near-immediate $0.50 per gallon reduction at the pump. Yet formalising those restrictions would simultaneously reduce the financial incentives that are currently keeping U.S. refineries running at historically high utilisation rates. There is no outcome here that avoids a trade-off.
How Long Can Near-Maximum Utilisation Be Sustained?
This is a question analysts are actively debating. U.S. refineries have been operating at or near capacity for an extended period, and the mechanical limits of sustained high-intensity operation are not trivial. Unplanned maintenance events, feedstock logistics constraints, and the seasonal transition away from peak summer driving demand will all factor into whether current throughput rates can be maintained into the fourth quarter of 2026.
India's Swing Supplier Role: Asia's Refinery Backstop
While the U.S. has captured European and Latin American market share, India has firmly established itself as the default swing supplier across Asia. The operational foundation for this role is straightforward: export-oriented refineries including Reliance and Nayara have maintained consistently high utilisation rates, enabling India to redirect volumes rapidly toward markets experiencing tightening balances.
India's fuel export volumes tracked toward approximately 1.4 million barrels per day in July 2026. A significant enabler of this output has been continued access to discounted Russian crude for domestic processing — an input cost advantage that allows Indian refiners to produce at globally competitive margins even as product prices rise.
As Rystad Energy vice president Lin Ye has noted, India's consistent refinery utilisation at export-focused facilities positions it as Asia's primary market stabiliser during periods of regional supply stress. According to Reuters reporting on U.S. and Indian fuel exporters, that description has become increasingly literal through 2026.
Indonesia as a Case Study: Asia's Largest Gasoline Buyer Pivots to Indian Supply
Indonesia's fuel import behaviour illustrates the demand dynamics that are sustaining Indian export volumes. The country typically sources 88- to 92-octane gasoline from India, Singapore, and South Korea. August 2026 imports reached 11 to 12 million barrels, up from 9 to 10 million barrels in July — a meaningful month-on-month acceleration driven by underlying demand resilience.
Indonesia Fuel Demand Forecast (2026)
| Period | Estimated Demand (bpd) | Key Notes |
|---|---|---|
| Q3 2026 | ~636,000 bpd | Rystad Energy estimate |
| Q4 2026 | ~641,000 bpd | Rystad Energy estimate |
| Full-year 2025 average | ~631,000 bpd | Baseline comparison |
| 2026 elevated estimate | ~690,000 bpd | Wood Mackenzie (subsidy buffer effect) |
Wood Mackenzie's higher estimate of approximately 690,000 barrels per day reflects a specific structural factor: Indonesia's heavily subsidised domestic fuel market absorbed a substantial portion of the global crude price shock, insulating Indonesian end consumers from the full magnitude of the price increase and thereby preserving demand volumes that might otherwise have contracted.
India's Long-Term Demand Constraint
The swing-supplier role that India currently occupies carries a built-in time limit. India is widely expected to be among the most significant drivers of global fuel demand growth through the next decade, with domestic consumption forecast to rise consistently. As internal demand absorbs a growing share of refinery output, the volume available for export will compress — gradually at first, then more materially as demand growth accelerates. India's current export capacity represents a window, not a permanent structural position.
The China Factor: The One Competitor That Actually Matters
Among all potential competitors to U.S. and Indian export market share, China is the only one with the scale and flexibility to pose a meaningful challenge. Wood Mackenzie has assessed that secondary Asian exporters such as South Korea face a fundamental constraint — uncertainty over crude supply availability is already suppressing refinery run rates, leaving limited headroom for significant volume growth regardless of how attractive market margins become.
China, by contrast, demonstrated the scale of its competitive capacity when it relaxed export quotas beginning in July 2026. Monthly export volumes surged from approximately 240,860 tons in June to 1.1 million tons — equivalent to roughly 9.3 million barrels — in July, according to LSEG Research data. That is a volume shift that no other competitor could replicate at equivalent speed.
Competitive Positioning: Major Non-Conflict Fuel Exporters (2026)
| Exporter | Key Advantage | Primary Markets | Key Constraint |
|---|---|---|---|
| United States | Gulf Coast refinery scale, record crack spreads | Europe, Latin America | Domestic price politics, capacity ceiling |
| India | Discounted crude access, Asia proximity | Southeast Asia, Middle East | Rising domestic demand growth |
| China | Quota flexibility, volume scale | Asia-Pacific | Geopolitical trade tensions, quota unpredictability |
| South Korea | Refinery quality | Regional Asia | Crude supply uncertainty limiting run rates |
The unpredictability of Chinese quota policy is itself a market dynamic. When Beijing restricts quotas, regional supply tightens abruptly. When quotas are relaxed, the volume surge can move prices within weeks. This stop-start pattern creates planning difficulties for downstream buyers across Asia-Pacific and reinforces India's appeal as a more consistently available alternative supplier.
Who Is Buying: The New Global Fuel Trade Map
The trade route realignment occurring in 2026 is not subtle. Kpler shipping data shows U.S. fuel exporters have focused primarily on European markets that had previously been supplied by Middle Eastern producers, and on Latin American buyers that historically sourced from Russia.
Brazil provides the most striking single-country illustration. One of the historically largest buyers of Russian diesel, Brazil imported 196,000 barrels per day of diesel from U.S. exporters in July 2026 — more than double the volumes recorded in June — after Moscow extended its ban on fuel exports through January 2027. The speed of that reorientation reflects both the severity of Russia's supply restriction and the depth of available U.S. export capacity.
The Inventory Warning Underpinning All of This
Wood Mackenzie projects Asian gasoline inventories will average approximately 197 million barrels through the remainder of 2026, materially below the 207 million barrel average recorded in the first half of the year and beneath the five-year seasonal average. The firm has explicitly flagged that if Middle Eastern supply disruptions persist or intensify, actual inventory levels could fall below even this reduced projection.
This is not a theoretical risk. Inventory buffers serve as the market's shock absorber — the mechanism by which short-term supply disruptions are absorbed without immediate price consequences. When those buffers are below seasonal norms, the market's tolerance for additional disruption is reduced. Any further deterioration in Middle Eastern or Russian refinery output would move from being a price-amplifying event to a potentially destabilising one for regional fuel availability. Monitoring crude oil prices alongside these inventory signals is essential for understanding where margins may move next.
The next major ASX story will hit our subscribers first
Long-Term Consequences: Are These Trade Routes Permanent?
The question of whether war-driven trade realignment becomes structurally embedded or reverts when conflicts resolve is genuinely open. Historical precedent from prior energy disruptions suggests that trade relationships formed during crises often persist well beyond the crisis itself — buyers invest in logistics infrastructure, contracts, and relationships with new suppliers that create switching costs even after original suppliers return to market.
For U.S. refiners, sustained high margins are reshaping capital allocation decisions in ways that extend beyond the immediate cycle. Refinery investment in Gulf Coast throughput capacity, logistics infrastructure for export terminals, and feedstock procurement strategies are all being recalibrated around the assumption that export margins will remain elevated for longer than initially anticipated.
For consumers — particularly those in Europe, Latin America, and Southeast Asia — the refinery windfall being captured by U.S. and Indian fuel exporters profiting from supply uncertainty during wars is being funded directly through elevated pump prices. The structural premium that geographically insulated refiners are able to extract from a war-disrupted market is ultimately borne by the end user. That burden is not evenly distributed, and it is not temporary in the way that simple supply shocks typically are. Furthermore, WTI and Brent futures pricing continues to reflect the sustained uncertainty embedded in global energy markets.
FAQ: U.S. and Indian Fuel Exporters Profiting From War-Driven Supply Disruption
Why are U.S. and Indian fuel exporters benefiting from conflicts in the Middle East and Ukraine?
Both countries operate large, export-capable refinery systems that are geographically removed from active conflict zones. As wars have disrupted fuel production and shipping routes associated with the Middle East and Russia, importers have been forced to source barrels from alternative suppliers at elevated market prices that deliver exceptional refinery margins to U.S. and Indian producers.
What record did U.S. distillate exports set in August 2026?
U.S. distillate exports reached a record 1.9 million barrels per day in the week ended August 7, 2026, according to U.S. government data. This covers diesel and heating oil combined.
How high have U.S. diesel margins risen during this period?
U.S. diesel crack spreads exceeded $102 per barrel in mid-August 2026, an all-time record, driven by fresh attacks on refinery infrastructure across the Middle East and Russia.
What role does India play in Asian fuel markets during supply disruptions?
India functions as Asia's primary swing supplier during regional tightening events. Consistently high utilisation at major export-oriented refineries enables India to redirect volumes rapidly toward shortage markets across Southeast Asia and beyond. Forbes analysis of India's supply chains has highlighted how war-driven restructuring is accelerating this repositioning.
Why did Brazil dramatically increase U.S. diesel imports in mid-2026?
Russia extended its ban on fuel exports through January 2027, eliminating a historically significant supply source for Brazilian importers. Brazil responded by sourcing over 196,000 barrels per day from U.S. exporters — more than double its June 2026 import volumes, according to Kpler data.
Could the U.S. government restrict fuel exports to lower domestic prices?
Analyst Tom Kloza has assessed that even a verbal signal from the White House regarding possible export restrictions could cause diesel crack spreads to drop by approximately $20 per barrel, delivering near-immediate pump price relief. However, formal restrictions would reduce refinery revenue incentives and could create longer-term domestic supply complications through throughput reductions.
Is China competing with the U.S. and India for export market share?
Yes. China relaxed its fuel export quotas beginning in July 2026, with monthly volumes surging from approximately 240,860 tons to 1.1 million tons. China represents the most significant competitive threat to U.S. and Indian export market share, particularly across Asia-Pacific, though the unpredictability of Chinese quota policy limits its reliability as a consistent supplier from a buyer perspective.
Key Takeaways
- Wars create structural supply vacuums that geographically insulated refiners are uniquely positioned to monetise through expanded export volumes and elevated margins
- The U.S. and India are capturing record export revenues because their refinery infrastructure operates outside conflict risk zones, giving them pricing power that war-affected producers cannot match
- Record crack spreads exceeding $102 per barrel for U.S. diesel reflect the severity of the underlying global supply shortfall, not temporary market noise
- Brazil, European nations, and Southeast Asian buyers are absorbing the financial cost of this disruption through pump prices that in some cases are running 50% above prior-year levels
- The political tension between export profitability and domestic affordability creates a genuine policy paradox for the U.S. administration — one with no resolution that avoids a meaningful trade-off
- India's long-term domestic demand growth trajectory will progressively compress its export capacity, making its current swing-supplier role time-limited rather than structurally permanent
- Asian gasoline inventories sitting below five-year seasonal averages mean the market has limited buffer capacity against any further deterioration in Middle Eastern or Russian refinery output
Readers seeking ongoing coverage of global energy trade dynamics and commodity market developments can explore related reporting from ET EnergyWorld at energy.economictimes.indiatimes.com.
Disclaimer: This article contains forward-looking projections and analyst estimates sourced from Rystad Energy, Wood Mackenzie, the IEA, and other industry sources. These figures represent forecasts subject to material revision based on geopolitical developments, regulatory changes, and market conditions. Nothing in this article constitutes financial or investment advice.
Want to Capitalise on the Commodity Market Shifts Reshaping Global Energy Trade?
Discovery Alert's proprietary Discovery IQ model scans ASX announcements in real time, instantly identifying significant mineral discoveries and actionable opportunities across more than 30 commodities — transforming complex market data into clear, decisive insights for investors at every level. Explore how historic mineral discoveries have generated substantial returns and start your 14-day free trial today to position yourself ahead of the next major market move.