August 20, 2026
The Strait of Hormuz as a Price Mechanism: How Geopolitical Risk Gets Baked Into Every Barrel
Energy markets have a peculiar relationship with geography. Most commodity prices respond to supply and demand fundamentals measured in weeks and months, but crude oil can reprice within hours based on a single maritime chokepoint that is, at its narrowest, approximately 33 kilometres wide. The Strait of Hormuz sits at this intersection of physical geography and financial psychology, functioning less like a shipping lane and more like a global pressure valve for energy pricing.
Understanding how oil prices and Strait of Hormuz closure scenarios interact requires examining not just what happens to supply, but what happens to market behaviour, shipping operator decisions, and the cascading exposure across economies that have built industrial infrastructure around uninterrupted Gulf crude access. Monitoring crude oil price trends is, consequently, essential for anyone seeking to understand how these dynamics unfold in real time.
When big ASX news breaks, our subscribers know first
Why the Strait of Hormuz Has No Realistic Substitute
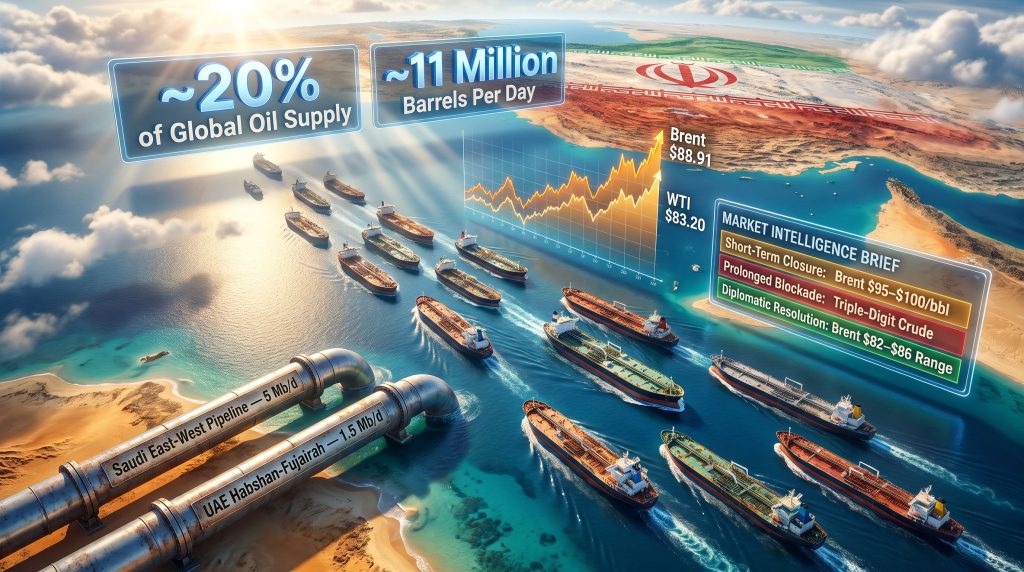
The scale of energy dependency concentrated in a single waterway is genuinely difficult to overstate. Approximately 20% of total global oil supply passes through the Strait of Hormuz each day, representing close to 11 million barrels of crude oil and petroleum products. Layered on top of that is a significant share of global liquefied natural gas trade, with Qatar alone responsible for a substantial portion of worldwide LNG exports that transit the strait.
What makes this corridor structurally irreplaceable is not just volume but the absence of viable alternatives at equivalent scale. The two most commonly cited bypass options each carry hard capacity ceilings:
- Saudi Arabia's East-West Pipeline connects Gulf production to Red Sea terminal infrastructure, with a maximum throughput of approximately 5 million barrels per day
- The UAE's Habshan-Fujairah Pipeline routes crude to the Indian Ocean-facing port of Fujairah, adding roughly 1.5 million barrels per day of bypass capacity
- Combined, these two corridors can handle less than 60% of normal strait throughput, meaning any confirmed, sustained closure produces an unavoidable net global supply deficit
| Metric | Estimated Figure |
|---|---|
| Daily oil volume transiting the strait | ~11 million barrels |
| Share of global oil supply | ~20% |
| Saudi East-West Pipeline capacity | ~5 million bbl/day |
| UAE Fujairah Pipeline capacity | ~1.5 million bbl/day |
| Combined alternative coverage | Less than 60% of strait volume |
Infrastructure Reality: Even at full simultaneous utilisation, available bypass pipelines leave a supply gap of more than 4 million barrels per day in a confirmed full-closure scenario. That gap has no short-term physical solution, regardless of how much political will exists to address it.
The Mechanics of Oil Price Risk Premium Formation
One of the least-understood dynamics in energy markets is how prices respond to anticipated disruption rather than confirmed disruption. When credible signals emerge about Hormuz shipping restrictions, crude benchmarks begin repricing almost immediately, often before a single tanker has altered its course.
This is the geopolitical risk premium in action: a forward-looking price adjustment that reflects traders' collective assessment of the probability, duration, and severity of supply removal. It is not irrational speculation. It reflects the reality that oil markets operate with relatively thin buffer capacity in the form of commercial inventories and strategic reserves, meaning even a temporary supply shock of significant scale can take weeks or months to absorb.
The duration variable is especially critical when modelling how oil prices and Strait of Hormuz closure events interact across different scenarios:
| Scenario | Duration | Estimated Brent Impact | Primary Market Driver |
|---|---|---|---|
| Partial Disruption | Days to 2 weeks | +$5 to $12/bbl premium | Shipping avoidance, elevated insurance costs |
| Short-Term Closure | 2 to 4 weeks | Brent approaching $95 to $100/bbl | Physical supply removal, SPR debate intensifies |
| Prolonged Blockade | 1 month+ | Potential triple-digit crude prices | Structural supply deficit, demand rationing |
A crucial asymmetry governs how these risk premiums build and deflate. Upside price moves are rapid, often materialising within a single trading session on the back of credible threat signals. Downside normalisation, by contrast, requires verified, sustained evidence that shipping has resumed safely. This asymmetry creates structural volatility that energy importers must plan around, while simultaneously presenting opportunities for traders positioned ahead of clarity events.
What Live Market Data Reveals About Current Hormuz Pricing
Recent market activity has provided a clear empirical window into how Hormuz-related uncertainty transmits into benchmark crude prices. Furthermore, tracking current crude oil prices alongside geopolitical signals has become essential for understanding how the market is genuinely responding to evolving Hormuz conditions. During the current period of elevated US-Iran tensions:
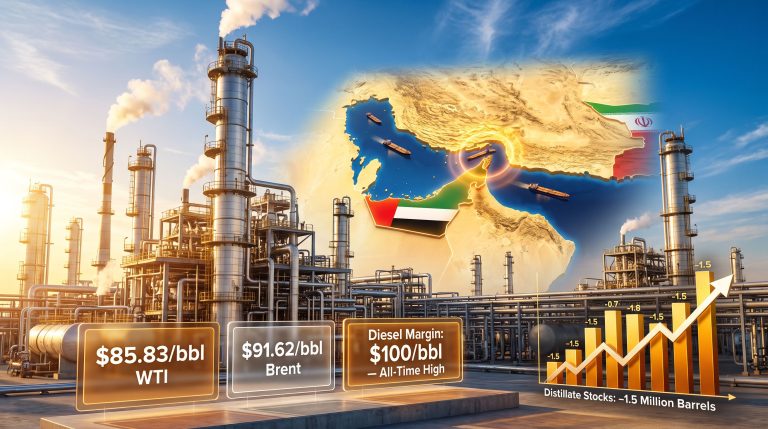
- Brent crude has been observed trading near $91.87 per barrel, gaining 25 cents or approximately 0.3% in early Asian trade
- WTI crude for September delivery has hovered near $85.81 per barrel, with the more actively traded October contract gaining around 14 cents to reach $84.53
- Both Brent and WTI recorded four consecutive sessions of gains, settling at their highest points since late July, reflecting sustained market conviction that risk conditions are not transient
The multi-session consecutive gain structure carries a signal that goes beyond simple spot anxiety. When forward positioning extends across four or more consecutive sessions, it indicates that professional market participants are not treating the disruption as a brief spike to fade. They are repositioning across time horizons, pricing in the possibility that uncertainty around Hormuz remains a durable structural feature of the near-term market environment.
Hiroyuki Kikukawa, chief strategist at Nissan Securities Investment, has observed that while oil prices remain elevated on the back of sporadic Middle East attacks, the market lacks fresh momentum without a major new escalation event. He has also noted that a gradual upward trend appears likely to persist given continuing uncertainty surrounding diplomatic prospects and tensions involving the UAE, Oman, and Iran. (Nissan Securities Investment, via Reuters, August 2026)
How Are Futures Markets Responding?
WTI and Brent futures are also reflecting heightened uncertainty across the forward curve, with the structure of contracts pointing to sustained concern rather than a transient pricing spike. This behaviour in the futures market reinforces the view that professional participants are treating Hormuz risk as a medium-term structural factor, not a short-lived anomaly.
The Information Asymmetry Problem: When Conflicting Signals Move Markets
Perhaps the most destabilising feature of the current Hormuz situation is the fundamental contradiction in official narratives about the strait's status. According to reports, US President Donald Trump stated that no talks were underway with Iran and that the Strait of Hormuz was open, whilst Iran simultaneously maintained that the waterway remained shut. These contradictory positions present a near-impossible information environment for commercial operators who need certainty before committing vessels and cargo.
When shipowners cannot verify safety conditions independently, they default to avoidance behaviour. Data emerging mid-week showed that shipping through the strait had slowed materially, not because of a confirmed blockade order enforced in real time, but because most shipowners chose not to transit given the absence of clear reopening signals. This is a behaviourally driven market outcome: a de facto closure produced by commercial risk aversion rather than physical force.
Market Psychology Note: The price impact of behaviourally driven avoidance is structurally identical to a physically enforced blockade from the market's perspective. Both outcomes remove supply from the forward pipeline, and both generate equivalent risk premium formation in crude benchmarks.
This information asymmetry problem compounds the UAE dimension. The UAE's decision to suspend all financial and economic transactions with Iran introduces a secondary pressure layer, signalling that Gulf Arab bloc solidarity with respect to Iran is hardening at a moment when Oman's geographic role as the strait's adjacent anchor state becomes increasingly strategically significant.
The Underreported Exposure: LNG, Refined Products, and Industrial Feedstocks
Most public commentary on Hormuz closure risk centres on crude oil because that is where price discovery is most visible. However, a sustained closure would create a compound energy shock that operates across multiple commodity categories simultaneously. In addition, the global LNG supply outlook is directly implicated in any prolonged Hormuz disruption, given Qatar's dominant role in LNG exports transiting the strait:
- Qatar's LNG exports, representing a significant share of global LNG trade, transit the Strait of Hormuz and would face interruption under a prolonged closure scenario
- Refined petroleum products, including diesel and jet fuel destined for Asian markets, would face supply constraints affecting transportation costs across the region
- Petrochemical feedstocks that underpin industrial production across South and East Asia would face disruption, with second-order effects on manufacturing output and inflation in import-dependent economies
This multi-commodity exposure means a Hormuz closure is not simply an oil price event. It is an energy system event with consequences that extend from power generation through to aviation, shipping, and industrial manufacturing across a vast arc of the global economy.
The next major ASX story will hit our subscribers first
Asian Import Dependency: Where Closure Risk Becomes Sovereign Economic Risk
The geographic distribution of Hormuz exposure is highly uneven. Economies that have built energy infrastructure around Gulf crude imports face qualitatively different risks than those with diversified supply access.
| Economy | Hormuz Dependency Level | Primary Vulnerability |
|---|---|---|
| Japan | Very High | Minimal domestic production, heavy LNG reliance |
| South Korea | Very High | Refining-intensive industrial economy, Gulf crude dominant |
| India | High | Significant crude sourced from Gulf producers |
| China | High | Short-term diversification capacity is constrained |
| European markets | Moderate | Greater access to Atlantic basin alternatives |
Japan and South Korea warrant particular attention. Both economies have essentially no domestic hydrocarbon production of significance and have structured their refining and petrochemical sectors around Gulf crude grades. A Hormuz closure lasting more than two weeks would begin to create physical supply constraints, not just price pressure, for these economies. Emergency drawdowns from strategic petroleum reserves would provide a temporary bridge but not a structural solution.
Furthermore, research published by UNCTAD on the burden of oil price shocks on vulnerable economies underscores that the asymmetric impact of Hormuz disruptions falls disproportionately on lower-income import-dependent nations, compounding sovereign fiscal stress well beyond what headline crude price movements alone would suggest.
US Inventory Data and the Limits of Domestic Fundamentals
Under normal market conditions, weekly US Energy Information Administration inventory data functions as a key price anchor, with large crude builds typically exerting downward pressure on WTI and, by extension, Brent. The most recent reporting period produced data that would, in isolation, have been bearish for prices:
- Crude inventories rose by 4.4 million barrels for the week ended August 14, dramatically exceeding analyst estimates of a 600,000-barrel draw
- Gasoline stockpiles also increased, pointing to consumer demand softness at the pump
- Distillate inventories declined, reflecting continued industrial and commercial fuel consumption
The fact that prices continued to trend higher despite this bearish inventory print is analytically significant. It confirms that geopolitical risk premium is currently overriding fundamental supply-demand signals with material force. Domestic inventory dynamics, OPEC+ production policy, and demand trajectory have all been subordinated in the market hierarchy to the single dominant question of whether the Strait of Hormuz will reopen and when.
This dynamic, where macro conflict risk eclipses physical market data, is characteristic of what energy analysts sometimes call conflict-phase market structure. It typically resolves sharply and in one of two directions: a rapid price normalisation if credible reopening evidence emerges, or an acceleration of the upward move if new escalation signals enter the market. The oil market disruption risks arising from geopolitical conflict, however, extend well beyond any single chokepoint event.
Strategic Scenario Modelling: Three Price Pathway Projections
Scenario A: Diplomatic Resolution Within Two Weeks
Shipping resumes gradually under negotiated terms. The risk premium deflates as verified vessel transits accumulate. Brent retreats toward the $82 to $86 range as forward uncertainty diminishes, and market attention shifts back to OPEC+ production discipline and demand-side fundamentals in China and India.
Scenario B: Partial Reopening With Continued Uncertainty
Select vessels transit under negotiated conditions, but widespread commercial confidence does not return immediately. Brent stabilises in the $88 to $94 range with elevated implied volatility. Insurance costs and freight premiums remain high. LNG markets stay partially disrupted, sustaining energy price pressure across Asian import economies for an extended period.
Scenario C: Prolonged Closure Exceeding 30 Days
IEA member nations coordinate Strategic Petroleum Reserve releases to partially offset the supply gap. Brent pushes toward or beyond $100 per barrel. Alternative pipeline routes operate at maximum capacity but cannot close the roughly 4-million-barrel-per-day gap left by full strait closure. Inflation risks in energy-import-dependent economies escalate, raising the probability of demand destruction and, in extreme duration scenarios, recession dynamics in the most exposed economies.
Historical Reference Point: The 1973 oil embargo, which removed approximately 4 to 5 million barrels per day from global supply, produced a crude price increase of roughly 300% over the following months. A full Hormuz closure removing 11 million barrels per day would represent a supply shock of a scale that has no modern precedent.
What Past Hormuz Episodes Teach Us About Market Timelines
Historical precedent offers useful calibration for recovery timelines and market behaviour patterns across different escalation cycles:
- During the 1980s Tanker War prosecuted as part of the broader Iran-Iraq conflict, shipping attacks persisted across multiple years. Markets adapted incrementally through vessel re-flagging under US Navy protection and convoy arrangements, but price normalisation did not occur until the broader conflict wound down.
- The 2019 tanker incidents in the Gulf of Oman triggered sharp but brief price spikes. Once no further incidents materialised over subsequent weeks, the risk premium deflated relatively quickly, demonstrating that the market's threat assessment is highly sensitive to the rate of new incident occurrence.
- Iranian verbal closure threats in 2012, made without any physical enforcement, were sufficient to push Brent above $125 per barrel during that period's already elevated supply environment, underscoring that credible rhetoric alone carries measurable and durable price weight in tight markets.
The consistent lesson across these episodes is that upside price moves driven by oil prices and Strait of Hormuz closure risk embed rapidly and require active positive evidence, not merely the absence of further negative signals, to sustainably reverse.
Disclaimer: This article contains forward-looking scenario analysis and projections based on historical market data, publicly available information, and geopolitical risk frameworks. These scenarios are not investment advice and should not be treated as predictions of future market outcomes. Energy markets are subject to rapid and material change, and all investors and market participants should seek independent professional advice before making financial decisions based on commodity price outlooks.
Want to Stay Ahead of Major Resource Discoveries Triggered by Shifting Energy Markets?
When geopolitical shocks reshape commodity markets at speed, Discovery Alert's proprietary Discovery IQ model scans ASX announcements in real time, instantly identifying significant mineral discoveries and turning complex market data into actionable investment opportunities — explore historic discovery returns to see what early positioning has delivered, and begin your 14-day free trial today.