June 9, 2026
The Copper Supply Equation Is More Complex Than Any Single Production Number Suggests
The global copper market does not move on one company's quarterly results. It moves on the accumulated weight of structural forces: decarbonisation timelines, grid expansion commitments, and the relentless mathematics of electrification. Yet when one of the world's most consequential commodity producers reports a 19% year-on-year surge in copper output, it becomes a data point that warrants genuine analytical attention. Glencore copper output grows 19% in Q1, and this does not resolve the supply challenge — however, it does illuminate where production momentum is coming from, what trade-offs are being made, and what cost pressures are quietly building beneath the surface.
When big ASX news breaks, our subscribers know first
Glencore Copper Output Grows 19% in Q1: The Headline Numbers in Context
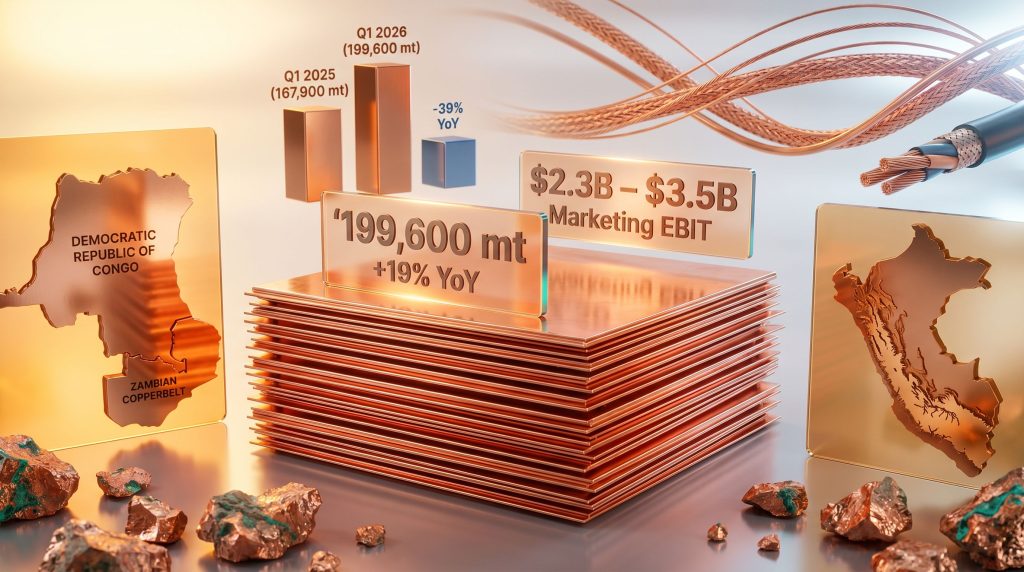
Glencore produced 199,600 metric tons of copper in the first quarter of 2026, up from 167,900 metric tons in the same period of 2025. That represents an additional 31,700 tonnes of refined copper entering global supply chains in a single quarter — a meaningful increment in a market where marginal supply shifts carry outsized price implications.
The production increase did not emerge from new mine commissioning or major capital deployment. It came primarily from improved ore grades at African operations and higher output from the Antamina copper-zinc mine in Peru, two very different operational levers that carry distinct sustainability profiles and risk considerations. You can review Glencore's Q1 2026 Production Report for the full breakdown of figures across the portfolio.
| Metric | Q1 2026 | Q1 2025 | Change |
|---|---|---|---|
| Copper Production (metric tons) | 199,600 | 167,900 | +19% YoY |
| Cobalt Production | Not publicly quantified | Not publicly quantified | -39% YoY |
| Marketing Division EBIT Guidance | $2.3B to $3.5B (full-year range) | N/A | On track to exceed upper end |
While the copper number commands attention, the cobalt figure buried beneath it deserves equal scrutiny. Cobalt output fell 39% year-on-year as Glencore made a deliberate operational choice to prioritise copper extraction at its Democratic Republic of Congo assets. Understanding that trade-off is essential to reading this result correctly.
What Actually Drove the Production Surge: Ore Grades and Antamina
African Ore Grade Improvement: The Lever Most Investors Underestimate
In mining, ore grade is one of the most powerful and least discussed production variables. It refers to the concentration of target metal within each tonne of rock extracted and processed. For copper, grades are expressed as a percentage of metal content per tonne of ore. A deposit grading 2.5% copper yields 25 kilograms of copper per tonne processed; a deposit grading 3.0% yields 30 kilograms from the same volume of material.
Glencore's African copper operations are concentrated in the Zambian and DRC Copperbelt, one of the geologically richest copper-producing zones on Earth. Stratiform copper-cobalt deposits in this region can carry grades ranging from roughly 2.5% to above 4.5% copper, depending on the ore zone being accessed. Even a modest improvement in the grade profile of material being processed translates into a disproportionate production gain without requiring additional mining volume, equipment, or labour.
Industry Insight: In open-pit and underground copper mining, ore grade improvements tied to mine sequencing are often cyclical. Long-term mine plans schedule extraction across different ore zones based on grade distribution, economic optimisation, and pit geometry. A high-grade quarter does not automatically signal a permanently improved production profile. Investors should distinguish between a favourable mining phase and a structural geological advantage.
This distinction matters enormously for forecasting. Whether Glencore's Q1 African grade performance reflects a sustained mineralogical advantage or a temporary phase of the mine plan is a question that quarterly production reports typically do not answer. It requires deeper engagement with site-level geological disclosures and reserve statements. Furthermore, those tracking the broader copper supply crunch will recognise that even strong quarterly output from existing assets does not eliminate the structural deficit building across the global market.
Antamina: Resilience in a Historically Volatile Region
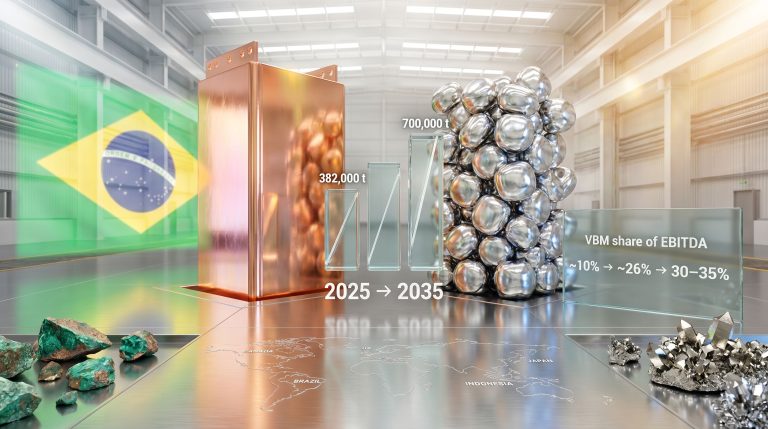
Glencore holds a 33.75% stake in the Antamina copper-zinc mine located in Peru's Ancash region, one of Latin America's highest-volume polymetallic operations. Antamina reported full-year copper production of approximately 697,000 tonnes in 2024, making it one of the continent's most significant copper contributors.
Peru's mining sector has experienced recurring disruptions over recent years driven by community protests, land access disputes, and regulatory friction. Stable output from Antamina in Q1 2026 should not be taken for granted. It reflects genuine operational resilience in a region where social licence challenges have repeatedly interrupted production at peer operations.
The combination of African grade improvements and Antamina's steady performance created the arithmetic behind the 19% production increase. Notably, neither driver required major new capital expenditure, which has positive implications for near-term free cash flow generation.
Two Australian Mine Closures: A Controlled Portfolio Adjustment
Two Australian mining operations reached end-of-economic-life and were permanently closed during the period. Their removal from the production base did not force a revision to full-year 2026 guidance, confirming that volume gains from African and Latin American assets are more than compensating for the Australian closures. This represents disciplined portfolio management rather than operational setback.
The Cobalt Decline: Reading Between the Lines of a 39% Drop
DRC Export Quotas and the Co-Production Trade-Off
The 39% decline in cobalt output is not a reflection of geological depletion or operational failure. It is the direct consequence of two overlapping pressures: DRC government export quota restrictions on cobalt and the metallurgical reality that copper and cobalt are co-produced at Glencore's Congolese assets. In addition, the ongoing DRC cobalt export ban has introduced longer-term uncertainty across battery material supply chains.
In the DRC's Katanga Copperbelt, copper and cobalt are chemically associated within stratiform ore bodies. The dominant cobalt mineral in these deposits is heterogenite (CoO(OH)), which occurs alongside copper minerals including malachite and chrysocolla. Processing decisions that optimise for copper recovery can cause cobalt to deport to tailings rather than being captured in the final product. When export quota restrictions constrain how much cobalt can be sold, the rational operational response is to maximise production of the unrestricted commodity.
Critical Context: The DRC accounts for approximately 70% of global cobalt mine supply, according to the U.S. Geological Survey's Mineral Commodity Summaries (January 2025), though this figure has moderated slightly toward the 65-68% range as Zambia, Australia, and Russia have incrementally expanded output. The DRC's willingness to deploy export quota mechanisms represents a significant sovereign risk variable that battery material supply chains cannot ignore.
What This Means for Battery Supply Chains
Cobalt remains a critical cathode material in NMC (nickel-manganese-cobalt oxide) battery chemistries, which are widely used in premium passenger EVs and consumer electronics where energy density is prioritised. Cobalt provides structural stability and cycle life benefits in these formulations. However, the direction of travel in battery chemistry is clear: manufacturers are actively reducing cobalt content per cell.
- NMC batteries historically contained 10-15% cobalt in cathode formulations; modern high-nickel variants (NCA, NCMA) have reduced this to below 5-10%
- Lithium iron phosphate (LFP) batteries, which contain zero cobalt, accounted for approximately 37% of global EV battery production in 2024, up from 28% the prior year, according to BloombergNEF research
- LFP's market share gains are concentrated in mass-market EVs and stationary storage applications, while NMC retains dominance in long-range and performance segments
The practical implication is nuanced. A sustained reduction in Glencore's cobalt output could exert upward price pressure on battery-grade cobalt in the near term, particularly for NMC supply chains. Over a longer horizon, the structural shift toward lower-cobalt chemistries partially insulates demand from supply disruptions, but does not eliminate the risk entirely.
| Commodity | Q1 2026 Direction | Key Driver | Market Implication |
|---|---|---|---|
| Copper | +19% YoY | Improved African ore grades plus Antamina output | Near-term supply positive; supports electrification buildout |
| Cobalt | -39% YoY | DRC export quotas; copper prioritisation at shared assets | Potential battery chain supply tightness; sovereign risk variable |
Cost Pressures: What Diesel and Sulphuric Acid Tell Us About Mining Economics
Two Input Costs That Define Open-Pit and SX-EW Operations
CEO Gary Nagle identified rising diesel and sulphuric acid prices as emerging cost headwinds for Q1 2026. These two inputs are not arbitrary selections. They represent the dominant variable cost categories for Glencore's specific operational profile in Africa.
Diesel powers the haul trucks, excavators, and ancillary equipment that define large-scale open-pit mining. In open-pit operations, haulage can account for 30-40% of total operating costs, making diesel price movements a direct transmission mechanism from global energy markets into mine-level economics. For every meaningful rise in crude oil and refined diesel prices, mining companies with large truck fleets face material cost inflation.
Sulphuric acid is equally critical for a different reason. Glencore's African oxide copper deposits are predominantly processed through heap leach and solvent extraction-electrowinning (SX-EW) circuits, where dilute sulphuric acid is used to dissolve copper from crushed ore piles. The resulting copper-bearing solution then passes through solvent extraction and electrowinning stages to produce high-purity copper cathode. Sulphuric acid is consumed in large volumes per tonne of copper produced, and acid price volatility feeds directly into unit operating costs.
Technical Note: SX-EW copper production carries a distinct cost profile compared to conventional flotation and smelting. While it is capital-efficient for oxide ore bodies, it is heavily dependent on acid availability and pricing. Unlike sulphide flotation circuits, SX-EW cannot easily switch processing reagents, making acid supply chains a structural vulnerability.
The Iran Conflict: A Secondary Risk Vector
Nagle confirmed the conflict involving Iran had limited direct operational impact on Glencore's assets in Q1 2026. However, geopolitical instability in the Middle East carries an indirect but meaningful risk: crude oil price volatility. Given diesel's centrality to mining operating costs, an escalation that drives sustained crude price increases would amplify the cost headwinds already acknowledged by management. According to Sharecast's reporting on the matter, Glencore sees commodity price rises broadly offsetting the impact of the Iran conflict on its operations.
Nagle's assessment was that stronger copper prices would more than offset diesel and acid cost pressures, supporting margin expansion. This is a reasonable near-term thesis given the structural support for copper prices, but it is explicitly contingent on copper prices remaining elevated. Any demand-side shock, particularly from slowing Chinese manufacturing output or a deceleration in global EV adoption rates, could erode that buffer with limited operational offset available.
Glencore's Marketing Division: The Structural Differentiator
Why the Trading Arm Changes the Investment Thesis
Glencore's marketing (trading) division carries full-year EBIT guidance of between $2.3 billion and $3.5 billion, with Q1 tracking suggesting performance is on course to exceed the upper end of that range. This is not a peripheral business line. For Glencore, it represents a structural earnings diversification mechanism that fundamentally separates the company from pure-play miners.
The marketing division operates by combining physical commodity flows with financial market positions, capturing value from price dislocations, logistical arbitrage, and grade differentials across global commodity markets. During periods of elevated price volatility — precisely the environment created by structural supply deficits and geopolitical uncertainty — this business model generates outsized returns that partially insulate the company from operational setbacks at individual mine sites.
Peers such as BHP and Rio Tinto operate without comparable trading infrastructure. Their earnings are essentially a function of commodity prices multiplied by production volumes. Glencore's dual-engine model introduces a non-linear earnings dynamic that investors need to explicitly model when assessing valuation.
Investor Consideration: Strong marketing earnings are generally more volatile than mining earnings. They depend on market conditions, price spreads, and trading opportunities that cannot be reliably extrapolated quarter to quarter. The current guidance outperformance trajectory is encouraging but should be assessed alongside the broader commodity market environment rather than treated as a recurring baseline.
The next major ASX story will hit our subscribers first
Why Glencore's Output Growth Is Strategically Timed Against Demand Fundamentals
The Three Pillars of Copper Demand Growth
The structural demand case for copper rests on three simultaneous buildouts occurring across major economies. Indeed, the critical minerals demand driven by the energy transition continues to underpin copper's long-term investment case with considerable force:
- Electric vehicles: Each battery electric vehicle requires approximately 80-100 kilograms of copper, compared to roughly 20-30 kilograms in a conventional internal combustion engine vehicle. At current and projected EV adoption rates, this differential creates significant incremental copper demand per unit of fleet electrification
- Charging infrastructure: Both residential Level 2 chargers and commercial DC fast-charging installations are copper-intensive. Grid connection cables, busbars, transformer windings, and charging unit components all require high-purity copper
- Grid modernisation and renewable integration: Wind turbines, solar inverters, transmission lines, and distribution network upgrades are collectively the largest long-term structural demand driver. The IEA has estimated that copper demand from clean energy transitions alone could increase approximately 40% by 2030
Against this demand trajectory, new mine supply faces a structural lag problem. New copper mine development typically spans 10 to 15 years from discovery to production, encompassing exploration, feasibility studies, environmental permitting, construction, and commissioning. The industry's capital discipline over the past decade, combined with declining ore grades at legacy operations globally, has constrained the new supply pipeline in ways that quarterly production increases from existing operations cannot fully resolve.
Featured Insight: Analysts broadly anticipate a structural copper supply deficit emerging in the late 2020s as electrification demand outpaces new mine development timelines. Glencore copper output grows 19% in Q1, which contributes positively to near-term supply adequacy but does not structurally alter the longer-term deficit trajectory. The production surge reflects operational optimisation within an existing asset base, not new supply creation.
Geographic Concentration Risk: The Underappreciated Constraint
The growth story in Glencore's Q1 result is geographically concentrated. The primary volume drivers — African Copperbelt operations and Antamina in Peru — sit in jurisdictions that carry distinct and meaningful risk profiles. The DRC has already demonstrated willingness to deploy export controls on cobalt. Zambia has historically adjusted mining tax regimes. Peru's community relations landscape has caused production disruptions across the sector.
Investors tracking Glencore's copper production momentum should weigh the geographic concentration of that momentum against the political and regulatory risk attached to those specific jurisdictions. Furthermore, the copper price growth drivers sustaining elevated prices are themselves partly dependent on whether supply from these regions remains stable — a factor that cannot be assumed. Production growth driven by operational excellence in high-risk geographies is valuable but not unconditionally stable.
Frequently Asked Questions: Glencore Copper Output Q1 2026
How much copper did Glencore produce in Q1 2026?
Glencore produced 199,600 metric tons of copper in Q1 2026, an increase of 31,700 tonnes compared to the 167,900 metric tons recorded in Q1 2025, representing a 19% year-on-year improvement.
What caused Glencore's cobalt production to fall in Q1 2026?
Cobalt output declined 39% because Glencore prioritised copper extraction at its DRC operations in direct response to export quota restrictions imposed by the Congolese government. The co-production relationship between copper and cobalt at these assets means operational focus on one metal necessarily reduces the other's recovery rate.
What is Glencore's full-year marketing earnings guidance for 2026?
The marketing division carries a full-year EBIT guidance range of $2.3 billion to $3.5 billion, with first-quarter tracking suggesting the division is positioned to exceed the top end of that range.
Which operations drove the copper production increase?
The primary contributors were improved ore grades at Glencore's African Copperbelt operations and higher output from the Antamina copper-zinc mine in Peru's Ancash region, where Glencore holds a 33.75% stake.
What cost pressures is Glencore facing in 2026?
Rising diesel and sulphuric acid prices have been identified as the key emerging cost headwinds. Both inputs are central to Glencore's African oxide copper processing operations. Management has indicated that elevated copper prices are expected to more than offset these pressures.
Did Glencore revise its 2026 production guidance?
No. Glencore maintained its full-year 2026 production guidance across the resources portfolio despite the permanent closure of two Australian mining operations that had reached end-of-economic-life during the period.
Key Takeaways for Investors and Market Observers
- The 19% production increase is real but operationally concentrated, anchored in African ore grade performance and Antamina stability rather than new mine development or major capital deployment
- Ore grade improvements require careful interpretation, as mine sequencing cycles mean Q1 grade performance may or may not be indicative of sustained output levels across the full year
- The cobalt trade-off introduces supply chain complexity for NMC battery manufacturers, with DRC export quota mechanisms representing a sovereign risk variable extending well beyond Glencore's individual decision-making
- SX-EW processing dependency on sulphuric acid creates a structural input cost risk that investors in African copper producers should explicitly monitor alongside diesel price trajectories
- The marketing division's earnings trajectory provides meaningful insulation against operational volatility, a differentiated feature absent from pure-play copper miners
- Structural copper demand fundamentals remain firmly intact, but near-term production gains from existing operations do not eliminate the projected supply deficit expected to materialise as electrification demand accelerates through the late 2020s. Those exploring copper investment strategies should factor this structural context into their longer-term positioning
Disclaimer: This article is intended for informational and educational purposes only and does not constitute financial advice, investment recommendations, or an offer to buy or sell any security. Forward-looking statements, production guidance figures, and market projections involve uncertainty and are subject to change. Investors should conduct their own due diligence and consult a qualified financial adviser before making investment decisions. Commodity markets are subject to significant price volatility and geopolitical risk.
Want to Track the Next Major Copper Discovery Before the Market Does?
Discovery Alert's proprietary Discovery IQ model scans ASX announcements in real time, instantly identifying significant mineral discoveries across copper and 30+ other commodities — turning complex geological data into clear, actionable opportunities for both traders and long-term investors. Explore historic examples of major mineral discoveries and their market returns, then begin your 14-day free trial at Discovery Alert to position yourself ahead of the next significant ASX find.