August 6, 2026
Why the Global Copper Supply Crunch Is Bigger Than Any Single Earnings Report
The world's electrical grid is quietly consuming more copper than at any previous point in industrial history. Each utility-scale wind turbine requires between 2.5 and 6.5 tonnes of copper, every electric vehicle uses roughly three to four times the copper of a conventional combustion engine, and grid-scale battery installations demand copper in quantities that were considered marginal a decade ago. Against that backdrop, the mining industry faces a structural paradox: the metal most critical to decarbonisation takes 10 to 20 years to bring from discovery to sustained production at scale. Understanding Glencore earnings and copper strategy, therefore, requires examining not just a set of financial figures but a fundamental tension between accelerating demand and a supply pipeline that cannot simply be turned on like a switch.
When big ASX news breaks, our subscribers know first
Decoding the Earnings Inflection: What the H1 2026 Numbers Actually Mean
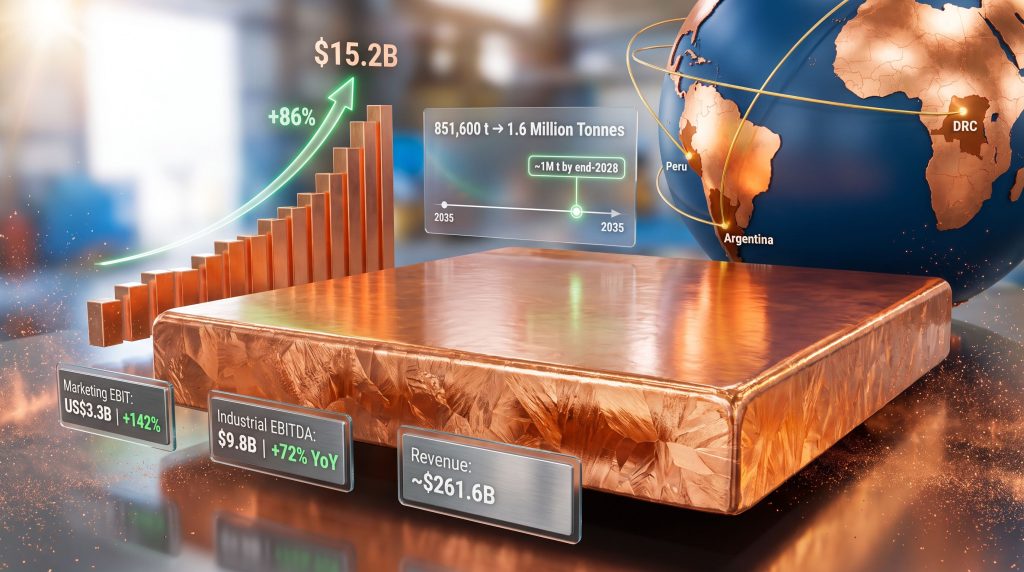
Glencore's half-year results, reported in early August 2026, delivered adjusted EBITDA of approximately $15.2 billion for the six months to 30 June 2026, an 86% increase on the prior corresponding period. Net income attributable to equity holders reached roughly $6.6 billion, reversing a loss recorded in the first half of 2025. Revenue climbed to approximately $261.6 billion, reflecting a combination of higher realised commodity prices and expanded traded volumes across key markets.
To appreciate the scale of this shift, it helps to recall that Glencore's full-year 2025 adjusted EBITDA came in at just $13.5 billion, meaning the company effectively matched and exceeded its entire prior-year result within a single six-month window. Net income attributable to equity holders for all of 2025 was a narrow $363 million, a figure that exposed just how thinly profitable the business became when commodity prices softened and marketing conditions normalised.
Glencore's H1 2026 result is not simply a price-driven windfall. It reflects a deliberate repositioning of both the industrial and marketing segments that began taking shape in late 2024, with adjusted production profiles, targeted cost reduction programs, and optimised trading exposures progressively feeding into realised earnings through 2025 and into 2026.
A critical accounting note for investors: Glencore's adjusted EBITDA strips out impairments, restructuring charges, and fair value movements to present underlying operating performance. This makes the metric more useful for assessing earnings quality and repeatability than raw net profit, but it also means readers should consult Glencore's segmental disclosures in the 2026 Half-Year Report to understand which commodity divisions generated the uplift and how durable those contributions are likely to be.
From Compression to Inflection: Reading the Multi-Year Cycle
Glencore's financial trajectory from 2023 through mid-2026 traces a recognisable commodity cycle arc. Earnings compressed through 2024 and much of 2025 as energy and metals prices moderated from their post-pandemic peaks. Then, in H2 2025, a combination of tighter copper supply, recovering coal demand, and expanding marketing margins began driving a pronounced inflection. H1 2026 represents the first full reporting period in which those forces converged at scale.
This cycle parallels, though it does not replicate, the 2015–2016 downcycle in which Glencore suspended its dividend, executed an aggressive asset divestment programme, and undertook emergency deleveraging as metal and energy prices collapsed. The key difference today is that management emerged from that crisis with a more conservative capital structure and a sharper risk management framework, which may give the current earnings recovery greater structural durability than previous cycles.
The Two-Engine Architecture: Industrial Might Meets Trading Intelligence
Industrial Segment: Volume, Grade, and Price Working in Concert
The industrial segment delivered adjusted EBITDA of $9.8 billion in H1 2026, up 72% year on year. This improvement reflects three converging forces: stronger realised commodity prices across copper, zinc, coal, and nickel; targeted operational improvements at specific mine sites; and the benefit of a diversified commodity portfolio that limits the damage when any single market softens.
A detail that often escapes mainstream coverage is the role of ore grade variability in driving short-term production and cost swings at Glencore's African copper operations. Copper mines in the Democratic Republic of Congo, including Kamoto Copper Company (KCC), are characterised by high-grade but geologically complex orebodies where recoveries can fluctuate materially depending on ore blend management, reagent optimisation, and the mining sequence. Glencore's Q1 2026 copper production increase of 19% year on year was partially attributable to improved ore quality at African assets, a factor that is not always visible in headline output figures but has a disproportionate effect on unit costs and EBITDA margins.
Marketing Segment: Structured to Profit From Chaos
The marketing result deserves particular attention. Marketing adjusted EBIT reached US$3.3 billion in H1 2026, a 142% increase on the prior period, equivalent to approximately A$5.0 billion for Australian investors tracking the AUD/USD translation effect. For context, this single half-year marketing result alone exceeds the lower bound of the company's own full-year guidance range of US$2.3 billion to US$3.5 billion.
That apparent contradiction is deliberate. Glencore's management has consistently maintained conservative marketing guidance ranges to avoid overpromising on a segment that is highly sensitive to short-term shifts in volatility, sanctions regimes, and regional price differentials. The H1 result reflects a period of exceptional market dislocation, and management is signalling that normalisation remains possible in H2.
What is structurally important here is the mechanics of how Glencore's marketing division generates returns. Unlike a purely industrial miner, which sells commodity output at prevailing spot or contract prices, Glencore's marketing arm operates as a global commodity merchant, capturing arbitrage opportunities across:
- Geographic price differentials created when supply disruptions isolate regional markets
- Time spreads between spot and forward prices during periods of inventory stress
- Quality and specification differentials where premium grades command outsized margins over standard benchmarks
- Logistics and financing margins embedded in long-term offtake and prepayment arrangements
This architecture means the marketing business becomes structurally more valuable, not less, as geopolitical fragmentation intensifies and supply chains grow more complex. A deglobalising world filled with sanctions, trade policy shifts, and uneven demand patterns is, paradoxically, fertile ground for a business built around navigating exactly those frictions. Furthermore, the copper supply crunch adds another layer of structural tension that amplifies the marketing division's capacity to generate outsized returns during periods of regional dislocation.
Comparative Earnings Snapshot
| Metric | H1 2026 | H1 2025 (implied) | Change |
|---|---|---|---|
| Adjusted EBITDA | ~$15.2 billion | ~$8.2 billion | +86% |
| Industrial EBITDA | $9.8 billion | ~$5.7 billion | +72% |
| Marketing EBIT | US$3.3 billion | ~US$1.4 billion | +142% |
| Net Income (equity holders) | ~$6.6 billion | Loss | Swing to profit |
| Revenue | ~$261.6 billion | Lower base | Material uplift |
Glencore Earnings and Copper Strategy: The Production Roadmap Explained
Why 2025's Output Decline Does Not Undermine the Long-Term Thesis
Full-year 2025 copper production was 851,600 tonnes, representing an 11% decline year on year. At face value, this appears to contradict the company's growth ambitions. In practice, it reflects a deliberate prioritisation of grade and recovery optimisation over raw volume, combined with temporary operational challenges at certain operations.
What is less widely understood is that H2 2025 alone produced more than 500,000 tonnes, nearly 50% above the H1 2025 figure, as grade management and processing improvements took effect. This H2 acceleration provides the statistical foundation on which the 2026 guidance range of 810,000 to 870,000 tonnes is based.
The copper business's EBITDA trajectory reinforces the operational narrative. The copper segment moved from approximately $1.1 billion to $3.0 billion in EBITDA year on year, a near-tripling that reflects both price tailwinds and the leverage effect of higher grades flowing through processing circuits with relatively fixed operating cost structures. In addition, the copper price growth drivers underpinning this improvement include accelerating electrification demand and tightening global mine supply, which have combined to sustain elevated price floors through the reporting period.
The Production Roadmap: Milestones and Mechanisms
| Milestone | Target Volume | Timeline |
|---|---|---|
| 2025 actual output | 851,600 tonnes | Full year |
| 2026 guidance range | 810,000–870,000 tonnes | Full year |
| Q1 2026 growth rate | +19% year on year | Quarterly |
| Annualised target | ~1 million tonnes | End of 2028 |
| Long-term target | ~1.6 million tonnes | 2035 |
The path from current production levels to 1 million tonnes by end-2028 requires Glencore to sustain roughly 10% compound annual growth from the 2026 guidance midpoint. This is mathematically achievable through the combined contribution of the Alumbrera restart, Quechua development, KCC expansion, and incremental improvements at existing operations, without requiring a single major acquisition. The critical variable, however, is operational continuity at African assets, where grade variability and geopolitical factors can disrupt the trajectory in ways that are difficult to model with precision.
Organic Growth Over Acquisition: A Deliberate Philosophical Choice
Glencore's preference for brownfield, self-funded, low-capital-intensity development is not simply a financial constraint. It reflects a considered strategic philosophy that stands in contrast to the acquisition-led approaches pursued by peers such as BHP and Rio Tinto. Brownfield expansions benefit from:
- Existing infrastructure: Processing plants, tailings facilities, power connections, and workforce already in place
- Established regulatory relationships: Permitting pathways that are shorter and more predictable than greenfield development
- Known geological settings: Ore body characterisation data accumulated over years of production, reducing subsurface surprises
- Lower capital intensity per tonne: Incremental expansion of proven operations typically costs a fraction of equivalent greenfield capacity
The downside of this philosophy is that brownfield expansions have inherent geological ceilings. At some point, the existing orebody is exhausted or the incremental cost of additional tonnes exceeds the cost of new project development. Glencore's 2035 target of 1.6 million tonnes implies that some greenfield or acquisition activity will eventually be required, but management is managing that conversation carefully to avoid telegraphing desperation to counterparties in potential M&A processes.
Key Projects Underpinning the Growth Pipeline
Alumbrera Restart: Argentina's Contribution
The Alumbrera project in Argentina has been brought forward, with first production now scheduled for H2 2027, ahead of previous guidance. Alumbrera is a porphyry copper-gold deposit in Catamarca Province and was one of Argentina's largest open-cut mining operations during its initial production life. Restarting it adds near-term volume with significantly lower capital expenditure than an equivalent greenfield development, given the substantial infrastructure already in place.
Argentina's evolving investment climate is a risk factor investors should monitor closely. The country has historically imposed foreign exchange controls, export taxes on mining revenues, and royalty changes that have affected project economics. The current regulatory direction appears more mining-friendly, but this remains a jurisdiction-specific risk that warrants ongoing scrutiny.
Antapaccay and the Quechua Project: Peru's Tier-One Credentials
The Quechua copper project sits within the Antapaccay district in Peru, one of the country's most productive copper-producing regions. Peru consistently ranks among the world's top three copper-producing nations, underpinned by a combination of world-class porphyry deposits, established mining regulatory frameworks, and a deep base of operational expertise.
Antamina, in which Glencore holds a stake, also contributed to the Q1 2026 production uplift through higher output, demonstrating the district's capacity to deliver incremental volume from existing operations. However, to fully appreciate the scale of global output, it is worth considering the largest copper mines in operation today and how Glencore's assets compare in terms of grade, scale, and geographic distribution.
KCC and the Democratic Republic of Congo: High Grade, High Complexity
KCC (Kamoto Copper Company) in the DRC represents one of the highest-grade copper assets in Glencore's portfolio and, by extension, among the most geologically significant copper-cobalt operations globally. The DRC's Copperbelt hosts some of the world's richest copper mineralisation, with ore grades that can exceed 3–4% copper equivalent at select operations, compared with the global average for new porphyry deposits of below 0.5%. Glencore has secured expanded land package access at KCC, positioning the company for further resource definition and potential incremental production.
The DRC context brings both exceptional grade opportunity and genuine operational complexity. Infrastructure constraints, community engagement requirements, and a regulatory environment that has historically evolved rapidly mean that African copper assets carry a risk premium that must be factored into any production trajectory modelling.
How Glencore's Copper Ambition Compares to Global Peers
| Company | Current Copper Output (approx.) | Growth Target | Primary Strategy |
|---|---|---|---|
| Glencore | ~840,000–870,000 t (2026 guidance) | ~1 million t by end-2028 | Brownfield organic + selective partnerships |
| BHP | ~1.7 million t (inc. OZ Minerals) | Significant expansion | Acquisition + greenfield |
| Rio Tinto | ~660,000 t | Growth via Oyu Tolgoi ramp-up | Greenfield + brownfield |
| Freeport-McMoRan | ~4+ million t | Stable to modest growth | Brownfield + leaching technology |
Glencore's self-funded brownfield model, if successfully executed, should deliver superior capital returns per tonne of new production compared with the large acquisition premiums paid by peers. BHP's acquisition of OZ Minerals, for instance, required a substantial premium to market value and carries the embedded risk of integrating a geologically diverse portfolio. Glencore's approach avoids that capital destruction risk, though it does require flawless operational execution across a complex multi-jurisdiction portfolio.
The next major ASX story will hit our subscribers first
Price Sensitivity, Demand Signals, and Risk Factors
The Price Sensitivity Equation
Copper price movements have a disproportionate effect on Glencore's earnings given the scale of its exposure. Every $500 per tonne movement in copper translates to a material shift in EBITDA, both in the industrial segment through realised revenue and in the marketing segment through changes in the value of physical and financial positions. With copper prices elevated through H1 2026, the combined effect on industrial margins and trading book performance created the exceptional earnings result.
The International Energy Agency has projected that copper demand could increase by more than 40% by 2040 under accelerated energy transition scenarios, driven by electric vehicles, grid expansion, and renewable generation infrastructure. The International Copper Study Group has separately noted that identified copper projects in the development pipeline are insufficient to close this gap without sustained price signals encouraging new investment. Glencore earnings and copper strategy are, in this sense, a direct response to precisely these structural demand signals, and investors exploring copper investment strategies will find Glencore's integrated model a compelling case study in leveraging both industrial assets and trading intelligence simultaneously.
What Could Compress Future Earnings?
Investors should weigh the following risk factors against the positive trajectory:
- Chinese demand disappointment: China accounts for roughly 55% of global refined copper consumption. Any material slowdown in construction, manufacturing, or electric vehicle penetration growth would weaken prices
- African operational disruptions: Grade variability, infrastructure reliability, and community relations issues at DRC assets can interrupt production with limited advance warning
- Geopolitical stabilisation: Paradoxically, a reduction in geopolitical tensions and supply chain fragmentation would reduce the arbitrage opportunities that powered the marketing segment's exceptional H1 performance
- Currency dynamics: AUD/USD movements affect the reported Australian-dollar value of USD-denominated earnings, introducing translation risk for Australian investors
- Permitting and regulatory risk in Argentina and Peru: Both jurisdictions have experienced periods of community opposition and regulatory change that can delay project timelines
The 2027–2028 Window and What It Means for Copper Pricing
Perhaps the most strategically important insight embedded in Glencore's production roadmap is the timing implication for copper markets. The 1 million tonne annualised target is not expected to be achieved until end-2028. Alumbrera's first production is scheduled for H2 2027. Quechua's contribution ramps over time. KCC's expansion operates within the geological and logistical constraints of the DRC.
This means that for the next two to three years, the incremental copper supply from one of the world's largest producers will be modest relative to the demand growth trajectory projected by the IEA and industry analysts. Combined with similarly long lead times at competing projects globally, the 2026 to 2028 window is shaping up as a period of structurally constrained copper supply. Consequently, the global copper supply gap is expected to widen materially before new volumes from Glencore and its peers arrive at scale, which supports both the price environment currently inflating Glencore's earnings and the capital discipline of management's brownfield-first investment approach.
Speculative note: If Chinese grid investment accelerates faster than consensus forecasts through 2027, or if major producing nations such as Chile experience unexpected supply disruptions due to water constraints or labour action, the copper supply deficit could deepen materially before Glencore's new volumes arrive. This scenario would likely see Glencore's marketing segment generate outsized returns for a second consecutive year, further reinforcing the earnings quality argument for the integrated business model. These are not base-case projections and carry material uncertainty.
Frequently Asked Questions: Glencore Earnings and Copper Strategy
What was Glencore's adjusted EBITDA for H1 2026?
Glencore reported adjusted EBITDA of approximately $15.2 billion for the six months to 30 June 2026, representing an 86% increase on the prior corresponding period.
What is Glencore's copper production target for 2028?
Glencore is targeting annualised copper production of approximately one million tonnes by the end of 2028, rising to approximately 1.6 million tonnes by 2035.
How much did Glencore's marketing business earn in H1 2026?
The marketing segment delivered adjusted EBIT of US$3.3 billion, a 142% increase on the prior period, equivalent to approximately A$5.0 billion for Australian investors.
What copper projects are advancing within Glencore's growth pipeline?
Key projects include the Alumbrera restart in Argentina with first production expected H2 2027 ahead of schedule, the Quechua copper project in Peru within the Antapaccay district, and expanded land package access at KCC in the DRC.
What was Glencore's copper production in 2025?
Full-year 2025 copper output was 851,600 tonnes, down approximately 11% year on year, though H2 2025 alone exceeded 500,000 tonnes, nearly 50% above the H1 figure as grades and recoveries improved.
How does Glencore plan to fund its copper growth pipeline?
Management has indicated a preference for brownfield organic development that the business can substantially self-fund, with selective value-accretive partnerships used to manage capital risk on larger project commitments. Glencore's capital markets day presentations outline this philosophy in considerable detail, providing investors with a clear articulation of how the company intends to balance growth investment against shareholder returns through the cycle.
Key Takeaways: Glencore Earnings and Copper Strategy in Summary
- Earnings inflection confirmed: An 86% EBITDA surge in a single half-year reflects both favourable commodity prices and deliberate operational repositioning across multiple years of groundwork
- Copper is the strategic anchor: The 2028 and 2035 production targets represent a multi-decade capital allocation commitment backed by identifiable project milestones, not aspirational targets
- Grade quality matters as much as volume: African copper operations deliver exceptional economics when ore quality is optimised, but grade variability is a genuine risk that investors must account for
- Brownfield discipline differentiates: Glencore's organic growth model prioritises capital efficiency over volume growth at any cost, a meaningful contrast to acquisition-led peers in a sector prone to paying excessive premiums
- Marketing as structural alpha: The 142% surge in marketing EBIT demonstrates returns that are partly uncorrelated with spot commodity prices, generated through arbitrage, logistics, and risk management rather than pure price exposure
- Supply timing is critical: With the 1 million tonne milestone not expected until end-2028, the near-term copper supply picture remains constrained, creating conditions that support both elevated prices and exceptional trading margins through the transition window
This article is intended for informational purposes only and does not constitute financial advice. Forward-looking statements regarding production targets, commodity prices, and earnings trajectories involve material uncertainty. Investors should consult qualified financial advisers before making investment decisions. All financial data is sourced from Glencore's 2026 Half-Year Report and 2025 Annual Report, with commodity market context drawn from the International Energy Agency and International Copper Study Group publications.
Want to Capitalise on the Next Major Copper Discovery Before the Market Moves?
Discovery Alert's proprietary Discovery IQ model scans ASX announcements in real time, instantly identifying significant copper and mineral discoveries and delivering actionable alerts to subscribers ahead of the broader market — explore historic examples of major discovery returns to understand the scale of opportunity, then start your 14-day free trial at Discovery Alert to position yourself at the forefront of the next significant find.