August 6, 2026
When War Becomes a Market Event: Understanding Conflict-Driven Energy Dislocations
Few forces reshape commodity markets as rapidly or as profoundly as geopolitical conflict. History offers repeated examples of armed confrontations triggering cascading supply disruptions across energy markets, from the Arab oil embargo of 1973 to the Russia-Ukraine war that sent European gas prices to record levels in 2022. Each episode shares a common thread: physically integrated trading operations positioned across multiple commodity sub-markets tend to capture returns that purely financial market participants cannot replicate.
The 2026 Iran war has emerged as the latest, and arguably most structurally significant, of these episodes. Its market footprint extends far beyond a temporary crude price spike. The Glencore energy trading profits Iran war narrative illustrates how the conflict's disruption of Persian Gulf shipping simultaneously compressed crude supply availability, distorted LNG routing, and drove freight rates to multi-year highs. When three interconnected energy sub-markets dislocate at once, the profit amplification effect for diversified commodity trading houses is exponentially larger than any single-market shock would generate.
Understanding how this dynamic produced one of the most remarkable trading profit results in recent memory requires examining not just the headline numbers, but the structural mechanics underlying them.
When big ASX news breaks, our subscribers know first
The Architecture of a Multi-Market Energy Dislocation
How Simultaneous Dislocations Multiply Trading Returns
The term "market dislocation" refers to conditions where the normal pricing relationships between supply, demand, and logistics break down, creating abnormal spreads and arbitrage opportunities. In 2026, three concurrent dislocations converged:
- Crude supply compression resulting from severely restricted tanker traffic departing the Persian Gulf.
- LNG spot price volatility driven by rerouting requirements that lengthened cargo delivery times and created regional price divergences between Asia, Europe, and the Americas.
- Freight rate escalation as available tanker capacity was absorbed by longer alternative routing requirements, pushing shipping costs sharply higher.
Each of these dislocations independently generates trading opportunity. Their simultaneous occurrence, however, creates a compounding effect. A trader with physical crude positions, LNG cargo exposure, and shipping logistics capability can capture value across all three market layers at once — something that a single-commodity trader or financially focused desk cannot replicate. Furthermore, the LNG supply outlook heading into this period had already flagged structural vulnerabilities that the conflict rapidly exposed.
The Strait of Hormuz: Geography as Market Risk
The Strait of Hormuz, the narrow waterway connecting the Persian Gulf to the Gulf of Oman, carries an estimated 20% of global oil consumption and a significant share of the world's LNG exports. Its strategic importance has no geographic substitute. Unlike pipeline networks, which can sometimes be rerouted, tanker traffic through Hormuz has no cost-comparable alternative for Gulf producers. When the strait's navigability is compromised, the market impact is immediate and global.
Historical disruption events — including the tanker wars of the 1980s and Iran's periodic threats to close the strait during nuclear negotiations — have consistently demonstrated the market's sensitivity to Hormuz-related risk. The 2026 conflict moved from threat to reality, effectively halting or severely constraining tanker departures. The result was not merely a price spike but a structural repricing across crude, LNG, and freight markets simultaneously.
"Key Structural Insight: LNG markets are inherently more sensitive to shipping disruptions than pipeline-delivered gas because every LNG cargo is exposed to freight market conditions. When tanker availability contracts and route lengths increase, LNG spot prices in destination markets can diverge sharply from production-region benchmarks, creating arbitrage spreads that physically positioned traders are uniquely equipped to exploit."
Glencore's H1 2026 Energy Trading Results: Unpacking the Numbers
The $2.66 Billion EBIT Figure in Context
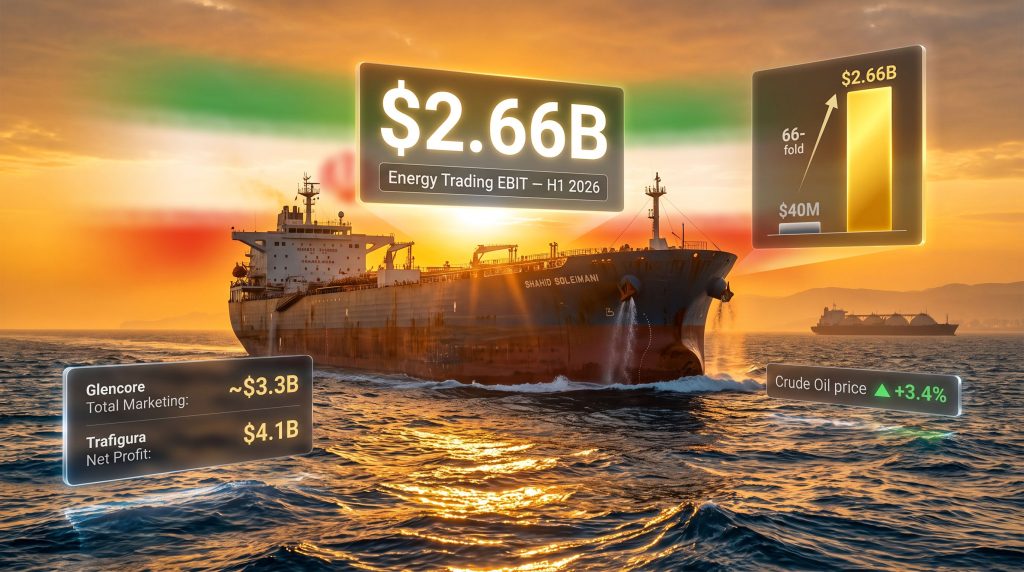
Glencore's first-half 2026 energy trading adjusted EBIT of $2.66 billion compares to just $40 million recorded in the same period of 2025. This represents a 66-fold increase — a result that stands as one of the most dramatic single-half trading earnings rebounds in the company's history.
Adjusted EBIT, in the context of commodity trading operations, measures operating profit before interest and taxes while excluding certain non-cash and exceptional items. It is the standard metric used to assess the underlying commercial performance of trading and marketing divisions, stripping out the noise of asset write-downs or one-off charges that can distort reported earnings.
The broader marketing division, which encompasses Glencore's physical commodity trading operations across energy, metals, and agricultural products, generated total first-half adjusted EBIT of approximately $3.3 billion — more than double the $1.4 billion recorded in H1 2025. This indicates that whilst energy trading was the dominant driver, other commodity segments also contributed meaningfully to the rebound.
Trading Volume Surge and What It Signals
| Metric | H1 2025 | H1 2026 | Change |
|---|---|---|---|
| Energy Trading Adjusted EBIT | ~$40M | $2.66B | +6,550% |
| Crude and Fuels Trading Volume | ~4.2M bpd (est.) | ~5.2M bpd | +~24% |
| Total Marketing Division EBIT | $1.4B | ~$3.3B | +~136% |
| Share Price on Results Day | Baseline | +3.4% | Positive |
The surge in crude and fuels trading volumes to approximately 5.2 million barrels per day — roughly 24% above the 2025 average — is particularly significant. This is not a passive reflection of higher market prices flowing through unchanged book positions. A volume increase of this magnitude reflects deliberate scaling of physical trading operations during a period of peak market dislocation, capturing not just price upside but also the structural arbitrage created by supply rerouting and freight disruption.
Glencore's integrated business model, combining upstream production assets with physical logistics and trading desk operations, is what makes this scaling possible. The broader context of oil price disruptions from preceding trade tensions had already conditioned markets for volatility, making Glencore's pre-positioned infrastructure all the more valuable when the Iran conflict escalated.
CEO Gary Nagle confirmed that the Oil and Gas department was the primary contributor to the result, with the division benefiting from significant dislocations across LNG, oil, and shipping markets simultaneously.
Breaking the Three-Year Earnings Decline Trend
The 2026 H1 result is notable not just in absolute terms but in trajectory. Glencore's energy marketing division had recorded three consecutive years of declining earnings prior to this period — a trend driven by normalising post-pandemic energy markets and reduced volatility. The 2026 result positions the company for what could be its strongest energy trading performance since the 2022 Russia-Ukraine energy crisis, which similarly generated exceptional commodity trading profits across the sector.
Looking ahead, Glencore noted that significant global inventory drawdowns have left oil markets increasingly sensitive to further supply disruptions. This fragility means that even a partial resolution of the Iran conflict may not immediately normalise market conditions if inventories remain depleted and structural supply uncertainty persists.
Competitive Benchmarking: How Glencore Stacks Up in 2026
The 2026 Commodity Trading Profit Landscape
| Trading Entity | Reported Period | Profit Metric | Reported Figure |
|---|---|---|---|
| Glencore (Energy Trading) | H1 2026 | Adjusted EBIT | $2.66 billion |
| Glencore (Total Marketing) | H1 2026 | Adjusted EBIT | ~$3.3 billion |
| Trafigura | 6 months to March 2026 | Net Profit | $4.1 billion |
| BP Trading Division | H1 2026 | Contribution | Multi-billion (reported) |
| Shell Trading Division | H1 2026 | Contribution | Multi-billion (reported) |
| TotalEnergies Trading | H1 2026 | Contribution | Significant gains reported |
The 2026 trading environment rewarded three specific structural advantages:
- Scale in physical commodity positions, enabling meaningful volume capture across price dislocations.
- Physical asset integration, allowing traders to source, move, and deliver actual cargoes rather than relying solely on financial derivatives.
- Geographic diversification, enabling arbitrage between regional markets where price differentials widened due to logistics disruption.
Independent commodity trading giants like Glencore and Trafigura generally maintain deeper physical commodity infrastructure than the trading arms of integrated oil majors. Whilst BP, Shell, and TotalEnergies all reported significant trading gains, their desks operate within corporate structures that include refining and retail obligations, which can constrain the flexibility with which their trading books are positioned during acute market dislocations.
The political dimension of the 2026 energy profit cycle also deserves attention. U.S. President Donald Trump publicly criticised ExxonMobil and Chevron over elevated gasoline prices, framing their profitability as a political liability for the Republican Party ahead of November midterm elections. This reflects the perennial tension between energy sector profit maximisation and the political sensitivities of high consumer fuel costs — a dynamic that has historically preceded regulatory responses including windfall profit taxes.
"Analytical Note: The 2026 commodity trading windfall is not uniformly distributed across market participants. Firms with deep physical infrastructure, flexible logistics networks, and multi-commodity exposure captured disproportionately larger returns than those reliant on financial derivatives or single-commodity positioning."
The Mechanics Behind Conflict-Driven Trading Profits
Why Physical Integration Is the Critical Differentiator
When the Iran war disrupted Persian Gulf tanker traffic, the immediate market response was a widening of price differentials between Gulf-origin crude and alternative supply sources, a surge in freight rates as available tankers were redirected, and a sharp increase in LNG spot prices in consuming regions. These three simultaneous dislocations created what traders refer to as "spread expansion" across multiple market dimensions at once.
A physically integrated trader in this environment can:
- Source crude from alternative origins and supply it to buyers who previously relied on Gulf supply.
- Redirect LNG cargoes to markets offering the highest spot premiums, capturing geographic price differentials.
- Arbitrage freight rate differences across tanker types and routes, using owned or long-term chartered vessels to lock in margin.
This is fundamentally different from taking a financial derivative position on crude prices. Physical trading involves actual cargo handling, logistics coordination, and counterparty management. It is operationally complex, which is precisely why the competitive moat for large-scale physically integrated traders is so durable. The barriers to entry are high, and scale compounds the advantage.
The European LNG Demand Premium
European energy security concerns — which have remained structurally elevated since the 2022 Russia-Ukraine conflict — added a further layer of demand pressure to the LNG market dislocation in 2026. European buyers, still prioritising supply security over price optimisation following years of disrupted Russian pipeline gas, were competing aggressively for spot LNG cargoes.
This created a sustained demand premium in European LNG spot markets that persisted even as cargoes were rerouted from Gulf origin points, amplifying the regional price divergence that traders could exploit through cargo redirection. Consequently, the commodity market volatility generated by these overlapping pressures proved far more sustained than most analysts initially anticipated.
Political and Economic Implications of Wartime Trading Windfalls
Regulatory and Windfall Tax Risk
The history of exceptional commodity trading profits during geopolitical crises is closely linked to government responses targeting those profits. During the 2022 energy crisis, multiple European governments introduced windfall profit taxes on energy companies, arguing that war-driven profits represented unearned gains that should be partially redistributed. The 2026 cycle is generating similar political dynamics:
- U.S. political pressure from the Trump administration directed at oil majors over high gasoline prices signals awareness of the political cost of elevated energy costs for consumers.
- European fiscal precedents from 2022 and 2023 windfall tax frameworks remain in place in several jurisdictions, creating a legal infrastructure that could be extended to trading operations.
- Consumer energy cost inflation driven by supply disruptions has historically been the trigger for regulatory intervention, regardless of whether that inflation originates from conflict or other supply shocks.
Investors should monitor legislative developments in key jurisdictions carefully, as a windfall tax application to commodity trading profits would directly reduce net earnings from operations like Glencore's marketing division.
ESG and Governance Scrutiny
The growing sophistication of ESG investment frameworks has introduced a new dimension to how institutional investors assess commodity trading profits generated during geopolitical conflict. Whilst physical commodity trading is a legal and economically essential activity, the perception that significant corporate profits are being generated from human suffering during armed conflict creates reputational risk.
Institutional investors operating under ESG mandates are increasingly expected to articulate governance frameworks addressing conflict-linked supply chain exposure. This scrutiny is particularly acute given the geopolitical market risk environment now characterising multiple commodity sectors simultaneously, regardless of whether the trading activity itself is passive or active in nature.
The next major ASX story will hit our subscribers first
Investor Implications and Forward Outlook
Reading the Forward Signals for H2 2026
Glencore's 3.4% share price gain on the day of its H1 2026 results announcement reflects genuine market confidence in the earnings rebound. However, investors should apply careful analytical framing when incorporating conflict-driven trading windfalls into valuation models:
- Energy trading earnings are structurally volatile and highly sensitive to the market conditions that generate them.
- The inventory drawdown context identified by Glencore for H2 2026 suggests that market sensitivity to disruptions remains elevated, which could sustain trading margins even as headline crude prices stabilise.
- A ceasefire or diplomatic resolution to the Iran conflict could compress market dislocations rapidly, reducing the arbitrage spreads that generated the H1 windfall.
"Risk Callout: Investors should treat conflict-driven trading windfalls as episodic rather than structural earnings contributors. The market conditions generating exceptional returns can reverse rapidly upon geopolitical de-escalation, and positioning Glencore's full-year earnings forecast around sustained H1 trading margins carries meaningful downside risk."
Key Risks to Monitor in H2 2026
- Geopolitical resolution risk: Conflict de-escalation could rapidly normalise Gulf shipping and compress LNG, crude, and freight dislocations.
- Demand destruction risk: Sustained high energy prices may trigger industrial and consumer demand contraction, reducing trading volumes.
- Regulatory risk: Political pressure on windfall profits could result in new taxation or trading restrictions in key jurisdictions.
- Inventory replenishment: If strategic reserves are rebuilt globally, crude market sensitivity to further disruptions would decrease, reducing the volatility premium that drives trading desk returns.
Frequently Asked Questions
What drove Glencore's energy trading profits so sharply higher in 2026?
The primary driver was the Iran war's disruption of Persian Gulf tanker traffic, which simultaneously compressed crude supply, elevated LNG spot prices, and increased freight rates. Glencore's Oil and Gas trading department captured value across all three dislocated sub-markets simultaneously, amplified by a 24% increase in physical trading volumes to approximately 5.2 million barrels per day.
How does Glencore's trading division generate its returns?
Glencore's marketing division operates by physically sourcing, transporting, and delivering commodities across global markets. It earns returns through price differentials between markets, arbitrage across supply routes, and the management of logistics and timing advantages. This is distinct from financial speculation; the division handles actual physical commodity flows, which is why scale and infrastructure are so critical to its profitability.
How does Glencore compare to Trafigura as a commodity trading house?
Both are large-scale, physically integrated independent commodity trading houses. Trafigura reported $4.1 billion in net profit for the six months to March 2026, whilst Glencore's total marketing division generated approximately $3.3 billion in adjusted EBIT for H1 2026. A key structural difference is that Glencore also operates significant upstream mining and production assets, making it a more diversified commodities business overall, whilst Trafigura remains more purely focused on trading and logistics.
What is the Strait of Hormuz and why does it matter?
The Strait of Hormuz is a narrow maritime chokepoint between Iran and the Arabian Peninsula that connects Persian Gulf oil and LNG producers to global export markets. It carries approximately 20% of global oil consumption. Because it has no practical alternative routing for Gulf producers, any disruption to its navigability has immediate and large-scale implications for global energy supply and pricing.
Could governments impose windfall taxes on commodity trading profits?
Precedent suggests this is a genuine risk. Multiple European governments introduced windfall profit taxes during the 2022 energy crisis. The political dynamics of 2026 — including U.S. criticism of energy sector profitability and consumer energy cost pressures — create conditions under which windfall tax proposals could gain legislative traction in multiple jurisdictions. The applicability to trading division profits, as distinct from production profits, would depend on specific legislative drafting in each jurisdiction.
Is the 2026 trading windfall sustainable into the second half?
Sustainability depends on whether the underlying market dislocations persist. Glencore's own commentary highlights that significant inventory drawdowns leave oil markets structurally vulnerable to further disruption, which could sustain elevated trading margins even without new supply shocks. However, any movement toward conflict resolution, Iranian oil supply restoration, or inventory replenishment would likely compress the trading spreads that generated H1 2026's exceptional result.
The Architecture of Conflict-Driven Commodity Profits: Key Takeaways
The Glencore energy trading profits Iran war story is more than a single-quarter earnings event. It is a case study in how physically integrated, multi-commodity trading operations are structurally positioned to generate extraordinary returns precisely when markets are most disrupted. The 66-fold increase in energy trading EBIT from $40 million to $2.66 billion in a single year reflects not luck but the compounding advantage of scale, physical infrastructure, and diversified market exposure during a multi-layered supply shock.
The 2026 episode will likely stand alongside 2022 as one of the defining commodity trading cycles of the decade, studied for what it reveals about the relationship between geopolitical conflict, energy market architecture, and the structural competitive advantages of large-scale physical trading operations. For investors, the forward question is not whether these conditions generated exceptional profits, but how quickly they can normalise, and what Glencore's earnings trajectory looks like in a world where the Iran conflict either escalates further or moves toward resolution.
For ongoing coverage of global energy markets and commodity sector developments, Reuters provides continuous reporting on the market dynamics discussed in this analysis. In addition, the International Energy Agency publishes regularly updated market outlooks that offer valuable context for understanding evolving supply and demand conditions.
This article is intended for informational purposes only and does not constitute financial advice or a solicitation to trade in any financial instrument. All forward-looking statements involve uncertainty, and past trading performance is not indicative of future results. Readers should conduct their own due diligence before making investment decisions.
Want to Capitalise on the Next Major Commodity Market Dislocation Before the Broader Market Reacts?
Discovery Alert's proprietary Discovery IQ model delivers real-time alerts on significant ASX mineral discoveries, instantly translating complex commodity data into actionable investment insights for both short-term traders and long-term investors. Explore Discovery Alert's discoveries page to understand how historic mineral discoveries have generated substantial returns, and begin your 14-day free trial today to position yourself ahead of the market.