August 5, 2026
When Thin Buffers Meet Big Shocks: The New Physics of Commodity Markets
There is a concept in physics called resonance — the phenomenon where a system amplifies external forces far beyond what its structure would normally absorb. Commodity markets in 2025 and 2026 have begun operating on a similar principle. The underlying architecture of global supply chains, weakened by years of underinvestment, post-pandemic fragmentation, and deliberately lean inventory management, has become a resonance chamber for geopolitical shocks. Events that once rippled through markets now detonate inside them.
Understanding why markets have reached this inflection point matters far more than simply cataloguing the disruptions themselves. The Glencore market volatility and inventory drawdowns data released for the first half of 2026 offers one of the clearest empirical windows into just how structurally different the commodity risk environment has become.
When big ASX news breaks, our subscribers know first
The Architecture of Amplified Risk
Commodity markets have always been cyclical. Price spikes, supply crunches, and demand surges have punctuated trading history for centuries. What has changed in the post-pandemic era is not the existence of disruptions but the speed and magnitude of the market's response to them.
Several forces have combined to thin the shock-absorption capacity of global commodity systems:
- Supply chain fragmentation following COVID-19 led producers and traders to prioritise flexibility over buffer stocks, reducing the inventory cushions that historically dampened price swings
- Energy transition pressures have created parallel demand surges for transition metals — cobalt, copper, lithium, nickel — while new mine supply has lagged, tightening physical balances across multiple commodities simultaneously. The role of critical minerals and energy security in shaping these dynamics cannot be overstated
- Geopolitical fractures along key trade corridors, including the Red Sea, the Strait of Hormuz, and Black Sea transit routes, have transformed previously theoretical supply disruption scenarios into recurring operational realities
- Financial market integration with commodity derivatives has accelerated price discovery in both directions, meaning sentiment shifts translate into price moves faster than physical supply chains can respond
The cumulative effect is a market environment where the gap between a supply disruption and a physical shortage has compressed dramatically. When inventories are lean, this gap can close within days rather than weeks — and prices respond accordingly.
Understanding Value-at-Risk: The Instrument That Measured the Storm
Before examining what Glencore's numbers reveal, it is worth understanding the tool being used to measure risk. Value-at-Risk, or VaR, is a statistical estimate of the maximum probable loss a trading portfolio could sustain over a defined time period, calculated at a specified statistical confidence level based on historical price behaviour.
In practical terms, a firm operating with a $200 million one-day VaR limit is saying that, under normal market conditions and based on historical price patterns, it expects losses on any given day to remain below $200 million with high statistical confidence. VaR limits function as internal governance guardrails, not hard circuit breakers, but exceeding them triggers escalated oversight, potential position reduction, and board-level awareness.
Critically, there are two ways a VaR limit can be breached:
- Directional positioning breach: The firm has taken large directional bets that push risk exposure beyond governance thresholds
- External shock breach: Market price dislocations are so extreme that the historical volatility parameters underpinning the VaR model are overwhelmed, even with conservative positioning
The distinction matters enormously for interpreting Glencore's results. Furthermore, understanding commodities volatility and hedging strategies provides essential context for evaluating how firms navigate these threshold breaches.
What Glencore's VaR Data Reveals About H1 2026
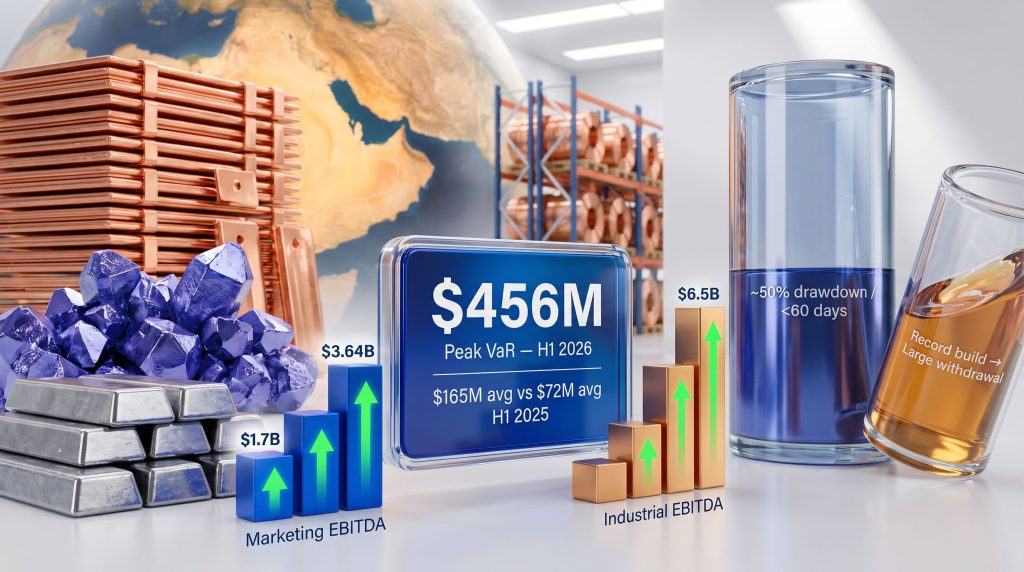
The numbers Glencore reported for the January to June 2026 period are, by any historical measure, extraordinary. The firm's one-day market-risk VaR peaked at $456 million during the first half, more than double its standard $200 million internal limit. The limit was formally waived across the March to May 2026 window as market conditions exceeded the parameters within which the limit was designed to operate.
| Metric | H1 2025 | H1 2026 |
|---|---|---|
| Average Daily VaR | $72 million | $165 million |
| Peak VaR Recorded | Not disclosed | $456 million |
| Internal VaR Limit | $200 million | $200 million |
| Limit Breached? | No | Yes (March–May 2026) |
The year-on-year comparison is stark. Average daily VaR surged from $72 million in H1 2025 to $165 million in H1 2026, a 129% increase in average daily risk exposure. This was not a short-lived spike but a sustained elevation across the majority of the six-month period, with a peak that suggests at least several days where market dislocations were operating at a scale with essentially no modern historical precedent.
The March-to-May 2026 VaR breach period coincides precisely with the most acute phase of energy market dislocation following the outbreak of US-Iran hostilities in late February 2026 — strongly suggesting this was an external shock breach rather than a positioning-driven one.
For market counterparties assessing exposure to large commodity trading firms, elevated VaR readings of this magnitude are a critical signal. They indicate that the firm is operating in a risk environment that extends well beyond normal parameters, carrying both the potential for exceptional earnings and the possibility of significant losses if positions move adversely.
The Geopolitical Trigger: US-Iran Conflict and the Hormuz Closure
The immediate catalyst for the H1 2026 volatility surge was the outbreak of US-Iran hostilities at the end of February 2026, which led to the effective closure of the Strait of Hormuz to normal oil and gas transit. The implications were immediate and cascading across multiple commodity markets simultaneously.
Saudi Aramco's production data illustrates the physical scale of the disruption. Saudi Arabia's total hydrocarbon output fell from approximately 12.614 million barrels of oil equivalent per day in Q1 2026 to 9.463 million boe/d in Q2 as producers were forced to curtail output they could not export through the strait. Liquids production alone fell from around 10.56 million b/d to 7.57 million b/d across the same period, according to Argus reporting on Aramco's Q2 2026 results.
Aramco's average crude selling price climbed from $76.9 per barrel in Q1 2026 to $108.1 per barrel in Q2, a reflection of the supply premium generated by constrained export routes. Saudi Arabia partially offset the impact by diverting crude through its East-West pipeline to the Red Sea terminal at Yanbu, though subsequent Houthi activity in the Bab el-Mandeb strait created additional complications for even these alternative export routes, with Saudi crude exports from Yanbu falling by 470,000 b/d month-on-month to 3.67 million b/d in July, according to Kpler data cited by Argus.
The energy trading implications for firms like Glencore with diversified logistics infrastructure and access to multiple supply routes were substantial. Geographic price dislocations, freight rate volatility, and storage arbitrage opportunities compressed into a very short window, creating compounding trading margins across crude, LNG, oil products, and freight markets simultaneously.
Metals Inventory Drawdowns: Three Markets Under the Microscope
While energy markets captured the headlines, concurrent inventory drawdowns across key metals exchanges added a separate layer of physical market tightening to the volatility picture. Glencore market volatility and inventory drawdowns data point to three metals markets where the dynamics were particularly acute.
Cobalt: A 50% Drawdown in Under 60 Days
Cobalt exchange inventories on the Wuxi market fell from approximately 7,870 tonnes at the end of January 2026 to around 3,934 tonnes by March — a drawdown of roughly 50% in under 60 days. The speed of this depletion is unusual even by cobalt market standards and points to accelerated contract fulfilment activity by Chinese battery manufacturers rather than gradual demand absorption.
This matters for downstream supply chains because cobalt is a critical input for lithium-ion battery cathode chemistries, particularly NMC (nickel-manganese-cobalt) variants used in high-energy-density electric vehicle applications. A rapid halving of exchange-registered stocks compresses the time buffer between a supply disruption and a material shortage reaching battery production lines, creating acute pricing pressure on spot markets.
Copper: Record LME Withdrawals and China's Demand Signal
Copper markets experienced what was described as the largest single drawdown of Russian-origin metal from LME-registered warehouses since tracking of such data began. The physical delivery of this copper into China functions as a meaningful demand signal, reflecting genuine manufacturing absorption rather than financial positioning. Indeed, the ongoing copper supply crunch has amplified the significance of these withdrawal patterns considerably.
LME warehouse copper inventory movements are widely understood within the trading community as a leading indicator of Chinese manufacturing demand sentiment. However, a nuance less commonly appreciated by non-specialists is the relationship between LME visible stocks and the much larger universe of off-warrant, proprietary copper holdings. When LME stocks fall sharply, this visible drawdown represents only a fraction of total market tightening — the invisible pool of off-warrant metal is typically far larger, meaning the true degree of physical tightness may be considerably more significant than exchange data alone suggests.
Lead: From Record Surplus to Withdrawal Shock
Lead markets in 2026 demonstrated the speed at which commodity supply-demand balances can reverse. After stocks climbed to record highs, large withdrawal plans emerged within a compressed timeframe, producing a sharp reversal in market sentiment and price direction. This pattern — surplus accumulation followed by rapid repositioning — is a textbook illustration of how inventory dynamics can flip market structure from contango to backwardation with limited warning.
The next major ASX story will hit our subscribers first
The Financial Translation: From Volatility to Earnings
Commodity price dislocations of the magnitude experienced in H1 2026 generate asymmetric financial outcomes for different types of market participants. For integrated commodity trading firms with physical access to multiple supply routes, storage infrastructure, and large balance sheets, extreme volatility compresses arbitrage windows but simultaneously widens the margins available within those windows.
Glencore's H1 2026 financial results capture this dynamic precisely:
| Financial Metric | H1 2025 | H1 2026 | Change |
|---|---|---|---|
| Marketing EBITDA | $1.70 billion | $3.64 billion | +114% |
| Industrial EBITDA | ~$3.78 billion | $6.50 billion | +72% |
| Overall Group Profit/(Loss) | ($655 million) | $4.40 billion | Swing of ~$5.05bn |
The 114% year-on-year increase in Marketing EBITDA, rising from $1.7 billion to $3.64 billion, was driven primarily by energy trading operations. The Industrial division generated $6.5 billion in adjusted EBITDA, up 72% year-on-year, reflecting the direct earnings uplift from higher commodity prices across Glencore's production asset base. These figures are detailed further in Glencore's 2026 Half-Year Report.
The combined swing from a $655 million loss in H1 2025 to a $4.4 billion profit in H1 2026 represents one of the most dramatic half-year earnings reversals in the firm's recent history, and it is directly attributable to the intensity of market dislocations rather than any fundamental change in operational capacity.
This earnings trajectory illustrates a fundamental characteristic of integrated commodity traders: they are structurally positioned to profit from the precise conditions that create the most difficulty for pure financial market participants and commodity consumers.
The Visibility Problem: Why Exchange Data Only Tells Half the Story
One of the most important and least publicly understood aspects of commodity market analysis involves the distinction between exchange-registered inventory and total physical supply. LME, SHFE, and Wuxi exchange inventory data represent only the fraction of global commodity stocks that have been registered as deliverable against exchange contracts.
The larger universe of off-warrant stock held in private warehouses, producer facilities, and trading firm storage is invisible to public reporting. An integrated firm like Glencore, with total current inventory of approximately $29.58 billion at end-2024 (down from $31.57 billion at end-2023), can observe both exchange and off-exchange inventory movements simultaneously — an information asymmetry that provides a significant analytical advantage over purely financial market participants who rely solely on public data.
When exchange drawdowns occur, they can signal physical demand pull, arbitrage repositioning, or strategic commercial decisions — and distinguishing between these motivations is critical for accurate price forecasting. The speed of the cobalt drawdown, for instance, more strongly suggests demand-driven offtake than arbitrage activity, which would typically produce more gradual and geographically distributed stock movements.
H2 2026 Outlook: Moderation Without Normalisation
Glencore has indicated that it expects market volatility to remain above historical norms through portions of the second half of 2026, though at reduced intensity compared to the exceptional conditions of the first half. This guidance is broadly consistent with a scenario where the most acute phase of the Hormuz disruption has passed its peak but geopolitical risk premiums and physical market tightness have not fully unwound.
| Scenario | Market Condition | Implied Trading Earnings Impact |
|---|---|---|
| Bull Case | Volatility remains elevated; supply disruptions persist | Marketing EBITDA sustains above $3bn annualised run-rate |
| Base Case | Volatility moderates to above-average but below H1 peaks | Marketing EBITDA normalises toward $2–2.5bn range |
| Bear Case | Rapid geopolitical de-escalation; inventory rebuilds | Marketing EBITDA reverts toward 2024 levels (~$1.7bn) |
The bear case scenario received some support in early August 2026, when WTI crude futures fell more than 5% in a single session after President Trump cancelled plans for a new military strike on Iran and indicated that talks were ongoing, according to Argus market reporting. The market's swift response to this diplomatic signal underscores how much geopolitical risk premium has been embedded in energy prices and how quickly it can partially deflate on peace signals, even before any physical supply restoration occurs.
Investors and market participants should note that all forward-looking statements, scenario projections, and earnings estimates referenced in this analysis involve significant uncertainty. Actual outcomes will depend on geopolitical developments, commodity demand trajectories, OPEC+ production decisions, and inventory dynamics that cannot be forecast with precision.
Key Indicators to Monitor Through H2 2026
For participants navigating this environment, the following data points carry the highest forward-looking signal value:
- Strait of Hormuz transit volumes: Any restoration of normal shipping flows would rapidly compress energy supply premiums and reduce trading arbitrage opportunities
- LME and SHFE weekly inventory reports: Continued drawdowns in copper and other base metals would reinforce physical tightness narratives even if energy markets stabilise
- Wuxi cobalt stock levels: Recovery toward January 2026 levels would suggest the acute battery supply chain demand surge has moderated; continued depletion would signal sustained pressure on downstream EV supply chains
- OPEC+ production compliance data: The core group's agreement to raise collective targets by 188,000 b/d from September 2026 remains largely theoretical given Hormuz disruption constraints, but any material increase in actual physical output would add supply-side relief
- Glencore's average daily VaR: If the measure normalises toward the $72 million average seen in H1 2025, it would confirm that exceptional trading conditions have passed; sustained readings above $100 million would signal continued structural elevation
The broader lesson from the Glencore market volatility and inventory drawdowns data is one that extends well beyond a single firm's financial results. Commodity markets have entered a structurally more sensitive operating regime — one where the interplay between lean inventory buffers, geopolitical supply disruptions, and integrated trading advantages creates a fundamentally different risk and return landscape than investors and commodity consumers experienced in the decade before 2022. Furthermore, the trade wars and supply chains dynamics that have unfolded in parallel add yet another layer of structural complexity to this already challenging environment.
Further perspective on energy and metals market developments and the dynamics discussed in this analysis can be explored through market intelligence published by Argus Media at argusmedia.com.
Want to Position Yourself Ahead of the Next Major Mineral Discovery?
Discovery Alert's proprietary Discovery IQ model delivers real-time alerts on significant ASX mineral discoveries, transforming complex mineral data into actionable insights for both short-term traders and long-term investors — explore historic examples of exceptional discovery returns to understand what early positioning can mean, then begin your 14-day free trial at Discovery Alert to secure your market-leading edge.