July 12, 2026
The Hidden Architecture of Alumina Supply Cycles
Global commodity markets rarely move in straight lines. For alumina, the intermediate product that bridges global bauxite production and aluminium smelting, quarterly output swings of five to seven percent are not anomalies but rather symptoms of a deeply cyclical industry shaped by maintenance calendars, regulatory enforcement windows, and energy market seasonality. Understanding why global alumina production drops in Q1 is less about identifying a crisis and more about decoding the structural rhythm that governs how refineries around the world allocate their operational capacity.
The first quarter of 2026 delivered exactly this kind of textbook correction, compressing global metallurgical-grade alumina output after an unusually elevated finish to 2025. What makes this particular episode analytically interesting is not the headline decline itself but the divergence between regions, the speed of intra-quarter recovery, and what the year-on-year stability actually reveals about underlying demand health.
When big ASX news breaks, our subscribers know first
Q1 2026 By the Numbers: Understanding the Scale of the Contraction
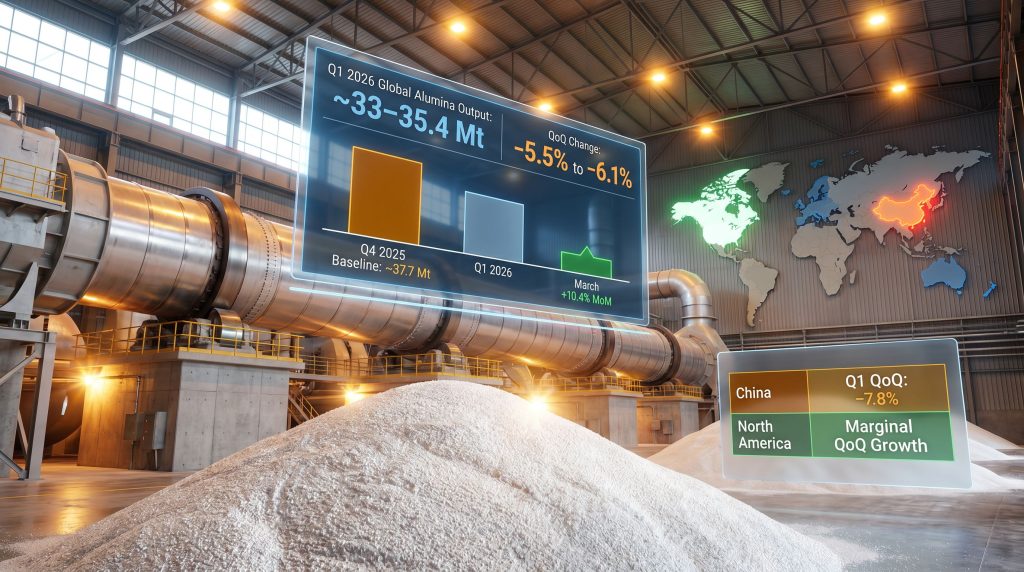
Global metallurgical-grade alumina output fell approximately 6.1% quarter-on-quarter in Q1 2026, pulling total production down to an estimated 35.4 million tonnes from roughly 37.7 million tonnes recorded in Q4 2025. The magnitude of that pullback represents one of the more significant short-term contractions seen in recent quarters, though context is critical here.
On a year-on-year basis, the picture is considerably less dramatic. Compared with Q1 2025's output of approximately 35.3 million tonnes, global production edged up just 0.28%, suggesting the market absorbed Q1's operational disruptions without meaningfully eroding annual supply capacity.
| Metric | Value |
|---|---|
| Estimated Q1 2026 Output | ~35.4 million tonnes |
| Quarter-on-Quarter Change | -6.1% |
| Year-on-Year Change | +0.28% |
| Q4 2025 Baseline | ~37.7 million tonnes |
| March 2026 Monthly Output | ~11.42 million tonnes |
| March Month-on-Month Change | +10.4% |
| March Year-on-Year Change | -0.9% |
Perhaps the most instructive data point within the quarter is March's 10.4% month-on-month production increase, which signals that the contraction was heavily front-loaded into January and February rather than representing a sustained multi-month retreat. This intra-quarter rebound is characteristic of maintenance-driven slowdowns, where refineries return to capacity relatively quickly once scheduled downtime concludes. Furthermore, according to IAI production statistics, this pattern aligns with broader historical trends in quarterly alumina output fluctuations.
What Structural Forces Are Driving the Global Alumina Output Decline?
The Post-Peak Correction: Understanding Q4-to-Q1 Production Cycles
A recurring but underappreciated dynamic in the alumina industry is the tendency for refineries to push output aggressively in the final quarter of each calendar year, followed by a pronounced pullback in Q1. Several reinforcing mechanisms drive this pattern:
- Refinery operators frequently defer scheduled maintenance until Q1, when the commercial cost of downtime is lower relative to end-of-year production targets
- Environmental compliance enforcement in major producing countries, particularly China, tends to intensify in the early months of the year as regulators evaluate prior-year performance and issue new operating conditions
- Northern Hemisphere energy costs typically peak in winter months, compressing refinery margins and incentivising temporary output reductions at higher-cost facilities
- Year-end inventory building by downstream aluminium smelters reduces urgency for alumina procurement in the following quarter, giving refineries greater flexibility to schedule downtime
These factors do not operate independently. When they converge simultaneously across multiple regions, as they did in Q1 2026, the aggregate effect on global output becomes amplified well beyond what any single factor would produce in isolation.
Supply-Side Pressures vs. Demand-Side Signals: Separating the Drivers
A critical analytical distinction often missed in mainstream coverage is the difference between voluntary curtailments and demand-driven output reductions. In Q1 2026, the weight of evidence points strongly toward voluntary and regulatory-driven curtailments rather than a collapse in alumina demand from downstream aluminium smelters.
Alumina spot prices did experience downward pressure during the quarter, partly driven by anticipated increases in Asian spot supply and the progressive ramp-up of newer refining capacity. These alumina market pressures create a perverse incentive for refiners to bring forward maintenance downtime, since the opportunity cost of lost production is lower during soft pricing periods. This feedback loop, where price softness accelerates maintenance scheduling, is a recognised feature of the alumina market cycle that amplifies apparent production volatility.
How Did China's Alumina Sector Contribute to the Global Decline?
China's Q1 Output: Flat Year-on-Year, Sharply Lower Quarter-on-Quarter
China's position as the dominant force in global alumina supply cannot be overstated. The country produced approximately 86.33 million tonnes of alumina in 2024, giving it a structural grip on global quarterly movements that no other single nation comes close to matching. Against that backdrop, China's Q1 2026 performance requires careful interpretation.
Estimated Chinese output for the quarter came in at approximately 21.3 million tonnes, essentially identical to the 21.3 million tonnes produced in Q1 2025. Year-on-year, Chinese production was flat, which is a meaningful signal of underlying stability. The dramatic headline, however, lies in the quarter-on-quarter comparison: output fell roughly 7.8% from Q4 2025's estimated 23.1 million tonnes, making China the single largest contributor to the global quarterly contraction.
The Mechanics Behind China's Q1 Slowdown
The forces behind China's production pullback were operational and regulatory rather than demand-driven. In addition, China's industrial demand dynamics continued to shape refinery output decisions throughout the quarter:
- Scheduled annual maintenance across several northern Chinese refineries commenced in January, a timing pattern that repeats with remarkable consistency year over year
- Environmental compliance enforcement resulted in at least one Henan Province refinery suspending operations entirely, reflecting China's ongoing regulatory tightening around industrial emissions
- Capacity disruptions in Guangxi and Guizhou provinces saw certain facilities temporarily losing close to half of their operating capacity, a concentration of disruptions across two of China's most alumina-intensive provinces that compounded the national total
A key insight for analysts tracking Chinese alumina capacity is that these disruptions are overwhelmingly cyclical rather than structural. China's active refinery expansion pipeline, with new capacity additions expected to come online across a 12 to 18 month horizon, signals that the country's production trajectory remains firmly oriented toward growth. Q1 maintenance windows compress quarterly figures but do not alter the long-run supply expansion story.
Which Regions Contracted and Which Defied the Trend?
Regional Production Performance: A Comparative Breakdown
| Region | Q1 2026 Trend | Primary Driver |
|---|---|---|
| China | Sharp QoQ decline | Maintenance + environmental shutdowns |
| Asia and Africa | Normalisation post year-end surge | Output correction after Q4 production push |
| Europe | Continued contraction | Energy cost pressures + maintenance activity |
| Oceania | Declining | Operational disruptions + energy challenges |
| North America | Marginal QoQ growth | Counter-cyclical production scheduling |
| South America | Under pressure | Regional supply chain adjustments |
North America: The Outlier in a Contracting Global Market
Among all major producing regions, North America stood as the sole counter-cyclical performer in Q1 2026, registering a modest but strategically significant quarter-on-quarter production increase. This divergence from the global trend reflects several structural advantages:
- North American refineries generally operate on different maintenance scheduling cycles from their Asian and European counterparts, with planned downtime often concentrated in mid-year periods
- Energy cost exposure for North American alumina producers is comparatively lower than for European peers, providing greater margin resilience during periods of global price softness
- Relatively stable regulatory enforcement calendars in North America reduce the risk of unplanned compliance-driven shutdowns that affected Chinese operations in Q1
For commodity market participants, North America's counter-trend growth carries strategic implications. However, the ongoing impact of US aluminium tariffs introduces an additional layer of complexity for regional producers navigating trade policy uncertainty. As a growing contributor to global supply diversification, the region's capacity to expand output during periods of Chinese and European contraction provides a partial buffer against acute global supply tightness.
Europe and Oceania: Structural Headwinds Persist
European alumina refineries continue to operate under a structural cost disadvantage driven primarily by natural gas and electricity pricing. The energy intensity of alumina refining, which involves high-temperature calcination processes to convert aluminium hydroxide into the final oxide product, makes European operators acutely sensitive to energy market fluctuations.
Oceania's contraction reflects a different set of pressures, with operational disruptions, logistics challenges, and cost management constraints combining to suppress output. Whether the challenges facing both regions represent temporary cyclical headwinds or more durable structural disadvantages relative to lower-cost Asian producers is a question that will likely be answered over the next two to three years of energy market evolution.
Is the Year-on-Year Stability a Sign of Resilience or a Warning Signal?
Reading the YoY Data: Stability Masks Regional Divergence
The +0.28% year-on-year change in global alumina output is a deceptively bland figure that obscures substantial regional redistribution. Global production volumes were broadly preserved on an annual basis, but the composition of where that production originates shifted meaningfully. China's flat year-on-year output alongside North America's growth and Europe's contraction points to an ongoing geographic rebalancing of alumina supply capacity.
For investors and industrial buyers, the distinction between QoQ and YoY readings is operationally critical. Quarter-on-quarter movements reflect short-term operational rhythms and can create misleading signals about medium-term supply trajectories. The YoY stability in Q1 2026 output is a more reliable indicator of where the market's structural supply capacity actually sits.
A useful thought experiment: if Chinese refineries had completed their maintenance cycles just two weeks earlier in Q1, estimated global output for the quarter could plausibly have remained closer to 36 to 36.5 million tonnes rather than 35.4 million tonnes. This sensitivity illustrates how concentrated production in a single country creates disproportionate global exposure to localised scheduling decisions that have nothing to do with demand fundamentals.
The next major ASX story will hit our subscribers first
What Do Alumina Price Dynamics Tell Us About Q1 Supply Conditions?
Price Signals and Their Relationship to Production Decisions
Alumina is not a freely traded commodity in the same sense as aluminium metal, with a large proportion of global supply transacted under long-term contracts linked to aluminium price formulas. However, the spot market component is sufficient to generate meaningful price signals, and Q1 2026 saw alumina spot prices under notable downward pressure.
The anticipated ramp-up of newer Asian refining capacity contributed to expectations of increased spot availability, weighing on prices ahead of actual supply materialisation. This forward-looking price pressure is a recognised feature of the alumina market: the announcement or ramp-up of new refinery capacity can suppress spot prices before a single additional tonne is produced, as buyers anticipate improved availability and negotiate accordingly.
For refinery operators, low-margin environments create an economically rational case for scheduling maintenance downtime rather than producing alumina at compressed margins. This dynamic partially explains why Q1 maintenance volumes were elevated relative to prior periods, reinforcing the interpretation that the quarterly production decline was as much a margin management response as it was a scheduled operational event.
April 2026 as a Continuation Signal
Production data extending into April 2026 indicated a further decline of approximately 2.48% month-on-month, driven by continued softness across China and Europe. This sequential monthly decline beyond Q1 is an important nuance: it suggests the corrective phase was not fully resolved by the end of March despite the intra-quarter recovery seen in that month's output figures.
The implication for Q2 2026 supply availability is that the market may experience a more prolonged adjustment period than a simple Q1 maintenance narrative would suggest, with return-to-capacity timing partly dependent on alumina price recovery and Chinese refinery restart schedules.
What Is the Outlook for Global Alumina Production Through H2 2026?
Recovery Indicators and Key Variables
The balance of evidence suggests the Q1 2026 contraction was cyclical rather than structural. Several indicators support a production recovery trajectory through the second half of the year:
- China's refinery expansion pipeline remains active, with new capacity additions expected to offset near-term maintenance-driven disruptions over a 12 to 18 month horizon
- North America's demonstrated ability to grow output counter-cyclically positions the region as an increasingly relevant swing supplier in global alumina supply chains
- March's 10.4% month-on-month rebound confirms that restart capacity exists and can be mobilised relatively quickly once maintenance windows close
However, several variables carry the potential to delay or complicate a smooth H2 recovery:
- Chinese environmental enforcement intensity: any escalation beyond seasonal norms could extend compliance-driven curtailments into Q2 and Q3
- Global aluminium demand trajectory: smelter production rates are the ultimate governor of upstream alumina procurement, and any softening in finished aluminium demand would propagate upstream through the value chain
- European energy markets: natural gas and electricity pricing remains the primary swing factor for European refinery viability; a sustained energy price spike could accelerate capacity rationalisation
- New Asian refinery ramp-up timelines: additional spot supply entering the market ahead of demand recovery could suppress prices and delay economically marginal production restarts
The fundamental question facing the alumina market in the second half of 2026 is whether demand growth from aluminium smelters will be sufficient to absorb returning production volumes without triggering a second wave of price compression. The answer depends heavily on Chinese smelter utilisation rates and global construction and transportation sector demand for finished aluminium.
Furthermore, the top aluminium producers will play a pivotal role in shaping whether upstream alumina demand can support a sustained production recovery through the remainder of the year.
Frequently Asked Questions: Global Alumina Production in Q1 2026
Why did global alumina production drop in Q1 2026?
The contraction reflected a convergence of scheduled refinery maintenance across major producing regions, environmental compliance shutdowns in China, energy-related curtailments in Europe and Oceania, and a post-Q4 normalisation after aggressive year-end production in 2025.
How much did global alumina production fall quarter-on-quarter?
Output declined approximately 6.1% quarter-on-quarter, from roughly 37.7 million tonnes in Q4 2025 to approximately 35.4 million tonnes in Q1 2026.
Which country contributed most to the Q1 decline?
China was the dominant driver, with output falling an estimated 7.8% quarter-on-quarter due to maintenance activity and environmental policy enforcement across Henan, Guangxi, and Guizhou provinces.
Was global alumina production lower than the same period in 2025?
On a year-on-year basis, production was broadly stable, rising marginally by approximately 0.28%, indicating that underlying annual supply capacity remained intact despite the sharp quarterly contraction.
Which region bucked the global trend in Q1 2026?
North America was the only major producing region to register quarter-on-quarter production growth in Q1 2026, reflecting its distinct maintenance scheduling cycle and comparatively lower energy cost exposure.
What does the March 2026 production rebound indicate?
March's 10.4% month-on-month output increase confirms that the contraction was concentrated in January and February, with production momentum already recovering before the quarter concluded. Consequently, this rebound suggests the global alumina production drops in Q1 pattern is unlikely to persist through the second half of the year without additional external disruptions.
Key Takeaways
- Global alumina output fell 6.1% quarter-on-quarter to approximately 35.4 million tonnes, driven by a convergence of maintenance cycles, environmental shutdowns, and energy pressures
- China's 7.8% quarterly decline was the dominant contributor, though flat year-on-year output confirms underlying demand stability rather than structural retreat
- North America was the sole region to grow production quarter-on-quarter, highlighting the strategic value of counter-cyclical supply capacity
- March's intra-quarter +10.4% month-on-month recovery signals the contraction floor was reached early in Q1, with restart momentum already underway before quarter-end
- April 2026 data showing a further 2.48% monthly decline suggests the corrective phase extended into Q2, making the full recovery timeline partly contingent on Chinese restart schedules and global aluminium demand conditions
- The year-on-year stability in global output provides a more structurally meaningful signal than the dramatic quarterly headline figure alone, confirming the market absorbed Q1 disruptions without lasting annual supply damage
Readers seeking ongoing data and industry reporting on global alumina and aluminium market dynamics can explore further coverage through AL Circle, which provides continuous industry news and production statistics across the aluminium value chain.
Want to Spot the Next Major ASX Mineral Discovery Before the Broader Market Does?
Discovery Alert's proprietary Discovery IQ model scans ASX announcements in real time, instantly converting complex mineral data across 30+ commodities into clear, actionable insights — so subscribers can act on significant discoveries the moment they are announced. Explore Discovery Alert's discoveries page to see how historic finds have generated substantial returns, and begin a 14-day free trial today to position yourself ahead of the market.