July 12, 2026
The Hidden Cost Equation Rewriting Renewable Energy Economics
Most discussions about clean energy economics focus on what is falling: the cost of solar panels, the price of batteries, the levelised cost of electricity. Far less attention is paid to what is rising underneath those headline numbers. The structural inputs required to physically build a solar installation, from the aluminium frames that hold each panel in place to the racking systems that anchor entire utility-scale arrays, have quietly become a source of significant financial pressure in 2026. Understanding why requires looking simultaneously at two forces that are rarely analysed together: solar subsidies and aluminium supply chain shocks.
These two dynamics are no longer independent variables. They now operate as a feedback loop, one that is actively compressing project economics, disrupting cost forecasts, and forcing developers to reconsider the financial assumptions underpinning their pipelines.
When big ASX news breaks, our subscribers know first
Aluminium as the Invisible Backbone of Solar Infrastructure
Aluminium's centrality to solar power is routinely underappreciated. The metal is physically embedded in every stage of a solar installation. Panel frames, mounting structures, junction boxes, cable trays, and substation components all rely on aluminium for its combination of light weight, corrosion resistance, and structural strength.
What makes this dependence strategically significant is the scale. According to the IEA's analysis of solar PV global supply chains, solar PV accounts for approximately 87% of incremental aluminium demand within the global renewables sector. This concentration means that any disruption to aluminium supply markets lands disproportionately on the solar industry, and in 2026, the disruption has been substantial.
"The energy transition is not simply a story of falling technology costs. It is increasingly a story of industrial commodity exposure, where the metals required to build clean energy infrastructure are subject to the same geopolitical and supply-chain risks as the fossil fuels they are designed to replace."
The 2026 Aluminium Supply Shock: Anatomy of a Structural Crisis
Geopolitical Disruption in the Gulf Region
The immediate catalyst for the 2026 aluminium market dislocation originated in the Middle East. Force majeure declarations at major smelter operations across Qatar, Bahrain, and the UAE collectively removed approximately 9% of global primary aluminium supply from the market in a compressed timeframe. Gulf-region smelters had been expanding steadily over the prior decade, leveraging access to competitive energy and strategic proximity to Asian and European end markets. The abrupt interruption of this supply node created a cascading shortage through downstream value chains.
Unlike marginal supply disruptions that markets can absorb through inventory drawdowns, this event struck during a period of already-tightening global balances, amplifying its impact considerably.
The Deficit and Inventory Gap
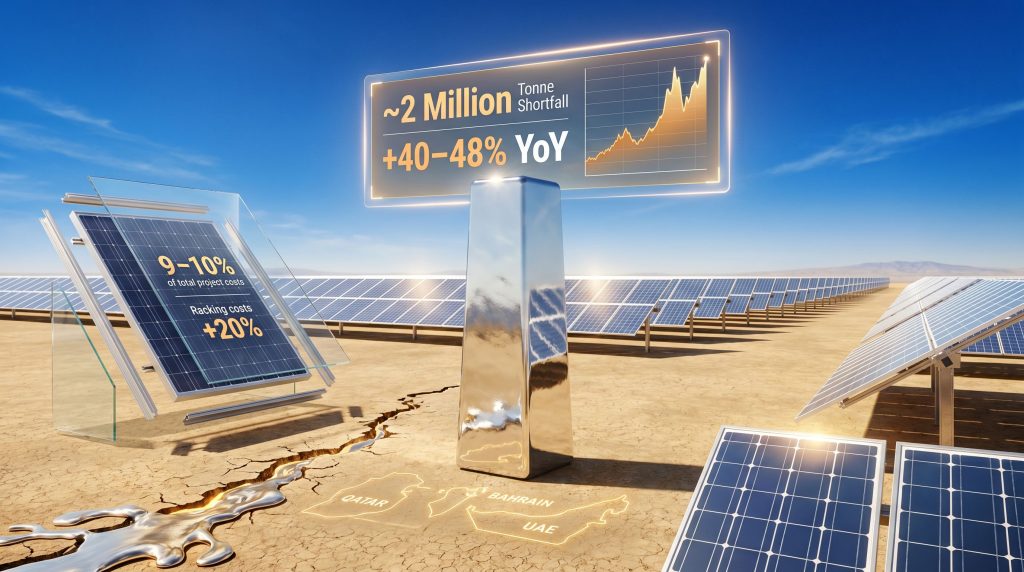
The numbers that have emerged from major commodity houses are stark. A refined aluminium deficit of at least 2 million tonnes is projected by the end of 2026, set against visible global inventories of just 1.5 million tonnes. This is not a cushion; it is a shortfall. Physical market participants have effectively no buffer against further demand-side shocks.
| Market Indicator | Pre-Shock Baseline | 2026 Position |
|---|---|---|
| Global Aluminium Deficit | Balanced / marginal surplus | ~2 million tonne shortfall |
| Visible Inventory | Adequate buffer | ~1.5 million tonnes |
| Price Movement (YoY) | Stable | +40-48% |
| Gulf Region Supply Share | ~9% of global primary output | Severely disrupted |
| U.S. Import Tariff | Variable | 50% (war premium active) |
Aluminium prices have responded accordingly, reaching a four-year high with a year-on-year surge of 40 to 48%. This is not a speculative premium layered onto stable fundamentals; it reflects a genuine structural imbalance between production capacity and consumption demand that cannot be resolved quickly.
Can Western Smelters Fill the Gap?
Idled smelter capacity in the United States and Europe has attracted attention as a potential partial remedy. Several facilities that were mothballed during periods of low prices or high energy costs have been flagged for potential restart. However, aluminium smelting is an extraordinarily energy-intensive industrial process. Restarting a smelter is not a matter of weeks — it typically requires six to eighteen months of ramp-up time and stable, competitively priced power supply.
In markets where electricity costs remain elevated, the economic case for restarts is constrained even when metal prices are high. Initiatives like aluminium operations repowering in Australia illustrate how energy cost reform is central to making domestic smelting viable again.
In the U.S., an additional layer of complexity comes from a 50% import tariff that has been characterised as a war premium. The broader implications of US aluminium tariffs effectively raise the cost of aluminium for domestic solar developers who cannot source sufficient volumes locally. This creates a compounding effect: global prices rise due to the Gulf disruption, and domestic prices rise further due to tariff barriers.
Solar Subsidies in 2026: From Blunt Instruments to Policy Discipline
Two Decades of Subsidy-Led Expansion
Between 2005 and 2024, solar support mechanisms globally averaged approximately 3.2% of firm revenues, enabling an unprecedented build-out of manufacturing capacity, particularly in China. This sustained subsidy regime transformed solar from a niche technology into the fastest-growing electricity source in history.
China constructed 900 GW of module manufacturing capacity during this period, a volume sufficient to satisfy projected global demand through 2032. The scale of this build-out was only possible because state-backed incentives, including VAT export rebates set at 13%, de-risked capacity investment and suppressed module prices for international buyers. Research from the OECD's analysis of subsidies and the solar panel industry highlights how sustained policy support fundamentally reshaped global manufacturing economics during this period.
China's Policy Reversal and Its Global Implications
The policy landscape shifted fundamentally in April 2026. China's elimination of VAT export rebates on solar products — reduced from 13% historically to 9% in 2024 and now removed entirely — represents one of the most consequential policy reversals in the global solar supply chain since the sector's industrial scaling began.
The rationale is internal: with 900 GW of capacity generating severe margin compression and threatening the financial stability of Chinese manufacturers, Beijing moved to force consolidation rather than continue fuelling a race to the bottom on pricing. Furthermore, China industrial supply chains are undergoing broader structural reform, adding another layer of uncertainty to global commodity flows.
The market impact was immediate. Module prices rose 9.3% following the rebate removal, with TOPCon module pricing moving from USD 0.086/W in January 2026 to a projected USD 0.098/W by year-end. Critically, aluminium frames account for roughly 14% of module manufacturing costs, meaning that the removal of VAT buffers simultaneously exposed this cost layer to the full force of global metal price volatility.
The Fragmented Global Policy Landscape
While China pivots inward, other major markets are applying their own subsidy disciplines. The European Union has moved toward conditional incentives that tie support to domestic content thresholds. The United States has tightened its domestic content rules under clean energy tax credit frameworks, creating compliance costs and supply chain restructuring obligations for project developers.
The result is a fragmented global policy environment where no single subsidy regime provides consistent cost relief, and where the benefits of falling panel prices are increasingly offset by rising infrastructure and compliance costs. In addition, the broader challenges of the critical raw materials transition are making long-term cost modelling increasingly difficult for developers operating across multiple jurisdictions.
Where Solar Subsidies and Aluminium Supply Chain Shocks Directly Collide
The 9-10% Cost Equation
Aluminium frames and mounting systems represent approximately 9-10% of total project costs in utility-scale solar installations. Under normal market conditions, this is a manageable input. Under 2026 conditions, however, it has become a pressure point with real consequences for project viability.
Racking system contracts are reporting price increases of approximately 20% in 2026. When applied against the total capital cost of a large solar project, this single input category is absorbing a material portion of the financial headroom that subsidy programmes were designed to create.
Cost Composition Breakdown for Utility-Scale Solar Projects:
- Aluminium frames and mounting systems: approximately 9-10% of total project costs
- Racking system price increases in 2026: approximately 20%
- Frame costs as a share of module manufacturing: roughly 14%
- VAT rebate removal now fully exposes this cost layer to global metal price volatility
The Subsidy Paradox in Practice
The structural tension that has emerged in 2026 is a genuine paradox. Subsidy programmes continue to drive down the cost of the panels themselves, with TOPCon technology delivering genuine efficiency gains. But the infrastructure required to install those panels is becoming more expensive, driven by aluminium price escalation that sits entirely outside the scope of solar-specific policy support.
This creates a scenario where developers receive competitive pricing on modules but face significantly higher costs on everything that holds those modules in place. The net economic benefit of a solar project narrows even as the headline cost of panels falls. Consequently, solar subsidies and aluminium supply chain shocks are now functioning as opposing forces within the same project economics, creating a tension that conventional subsidy frameworks were never designed to resolve.
| Market Force | Direction of Pressure | Primary Impact Zone |
|---|---|---|
| Solar subsidy programmes | Downward on panel prices | Module procurement costs |
| China VAT rebate elimination | Upward on export pricing | Global module supply costs |
| Gulf smelter disruptions | Upward on aluminium prices | Frames, racking, structural systems |
| U.S. 50% import tariffs | Upward on domestic metal costs | U.S. project development economics |
| Western smelter restarts | Moderating (partial relief) | Long-term supply normalisation |
| Falling module prices (TOPCon) | Downward on panel LCOE | Panel procurement only |
Scenario Modelling: Three Pathways Through 2027
Scenario A: Partial Supply Recovery (Base Case)
- Gulf smelter operations partially restored by Q3 2026
- Aluminium deficit narrows to approximately 800,000 tonnes
- Solar project cost increases moderate to 10-12%
- Project pipelines resume cautiously, with selective deferrals in price-sensitive markets
Scenario B: Prolonged Disruption (Bear Case)
- Strait of Hormuz restrictions persist through H1 2027
- Deficit widens beyond 2 million tonnes with no inventory buffer
- Racking and framing costs rise a further 15-25%, triggering widespread project deferrals
- Developer returns compressed to sub-threshold levels in markets without domestic aluminium supply
Scenario C: Accelerated Western Capacity Restart (Bull Case)
- U.S. and European smelter restarts exceed expectations in speed and volume
- Aluminium prices stabilise by Q4 2026
- Solar project pipelines resume at scale, supported by domestic content incentives
- The 2026 disruption is absorbed as a transitory shock rather than a structural reset
The next major ASX story will hit our subscribers first
The Broader Energy Transition Vulnerability
Beyond Solar: Aluminium's Role Across the Clean Energy Complex
The solar sector's aluminium exposure is the most acute, but it is not isolated. Wind turbine nacelles, tower components, and cable infrastructure all incorporate significant aluminium volumes. Grid modernisation projects, essential for accommodating variable renewable generation, rely heavily on aluminium conductors and structural components. Electric vehicle platforms use aluminium extensively for lightweighting.
A sustained aluminium supply shock does not just slow solar development. It creates a systemic drag across the entire physical infrastructure of the energy transition. This reality underscores why critical minerals and energy transition policy must be integrated with renewable energy development strategies rather than treated as a separate industrial concern.
The Green Transition Paradox
There is a deeper and less comfortable insight embedded in the 2026 market disruption. The metals required to build clean energy infrastructure are extracted, processed, and transported through global supply chains that carry geopolitical exposure broadly comparable to those of the fossil fuel markets they are intended to displace. A conflict affecting Middle Eastern smelters translates into higher costs for solar frames in California, Germany, and Australia with the same transmission speed as an oil supply disruption translating into higher petrol prices.
This does not undermine the case for the energy transition. It does, however, challenge the assumption that a renewable-dominated energy system will be inherently more insulated from geopolitical commodity risk. Aluminium, like oil, is a globally traded industrial commodity embedded in international supply chains, and the 2026 experience of solar subsidies and aluminium supply chain shocks has demonstrated that exposure with considerable clarity.
Key Indicators to Monitor Through H2 2026
For industry participants navigating this environment, the following variables carry the greatest forward-looking relevance:
- Aluminium price trajectory relative to the financing thresholds embedded in project models
- Gulf smelter restoration timelines and their effect on physical market balances
- China's evolving export policy following VAT rebate elimination and its second-order effects on module pricing
- Western smelter restart capacity and the speed with which new output contributes to global supply
- Project deferral rates as a leading indicator of supply chain stress across solar development pipelines
- Policy coherence between solar incentive programmes and domestic industrial metal strategies, particularly in the U.S. and EU
Frequently Asked Questions
What percentage of solar project costs does aluminium represent?
Aluminium accounts for approximately 9-10% of total utility-scale solar project costs, primarily through panel frames, mounting systems, and structural racking components. Frame costs alone represent roughly 14% of module manufacturing expenses.
What caused the 2026 aluminium supply shock?
The primary catalyst was geopolitical disruption in the Middle East, including force majeure declarations at major Gulf smelters across Qatar, Bahrain, and the UAE, which collectively account for approximately 9% of global primary aluminium supply.
How has China's VAT rebate removal affected global solar prices?
The elimination of VAT export rebates in April 2026 contributed to a module price increase of approximately 9.3%, with TOPCon module pricing projected to rise from USD 0.086/W to USD 0.098/W by year-end.
Are solar projects still economically viable despite rising aluminium costs?
Viability varies significantly by market and project structure. In markets with access to domestically produced aluminium and strong subsidy support, projects remain viable. Markets heavily dependent on imported aluminium and exposed to import tariffs face the greatest financial pressure on project-level returns.
How long did it take for solar subsidies to reshape the global market?
Between 2005 and 2024, global solar support mechanisms averaged approximately 3.2% of firm revenues, enabling two decades of aggressive capacity expansion. China alone constructed 900 GW of manufacturing capacity during this period, fundamentally restructuring global module supply and pricing.
Readers seeking additional industry data and commodity market analysis on the intersection of renewable energy policy and aluminium supply dynamics may find further context through sector publications such as AL Circle's aluminium industry coverage at alcircle.com.
Want to Know Which ASX Mineral Discoveries Could Benefit From the Energy Transition's Surging Commodity Demand?
As aluminium supply shocks and shifting solar subsidies reshape the economics of renewable energy infrastructure, the commodity exposure underpinning the green transition has never been more apparent — and neither has the opportunity for investors positioned ahead of significant mineral discoveries. Discovery Alert's proprietary Discovery IQ model delivers real-time alerts on major ASX mineral discoveries, turning complex market signals into actionable insights, so explore historic discoveries and their returns or start your 14-day free trial today to gain a market-leading edge.