
June 9, 2026
When the Shock Absorbers Run Out: Understanding the Global Economy Oil Price Spike Risk
Energy markets have a long history of pricing tomorrow's supply through yesterday's assumptions. Traders and portfolio managers tend to extrapolate recent calm into forward expectations, a behavioural tendency that has preceded some of the most damaging commodity shocks in modern economic history. The 1973 Arab oil embargo, the 1979 Iranian Revolution, and the 2008 price surge all shared a common precondition: markets were structurally unprepared, and the safety buffers that might have absorbed the shock had been quietly depleted well in advance.
That same precondition is present again in mid-2026, and this time the magnitude of the underlying supply disruption is historically unprecedented in both scale and geopolitical complexity. Understanding the crude oil price trends that have led to this point is essential for any serious economic analysis.
When big ASX news breaks, our subscribers know first
Why the Global Economy Is More Exposed to a Supply Shock Than at Any Point in Recent History
The Inventory Floor That Can No Longer Catch a Fall
The conventional shock-absorption mechanism in crude oil markets relies on layered inventory buffers: commercial stockpiles held by refiners and traders, strategic reserves maintained by governments, and floating storage operated by tanker operators. When a supply disruption hits, these layers are drawn down in sequence, buying time for production adjustments or diplomatic resolutions to take effect.
That mechanism only functions when the buffers are adequately full to begin with. As of early June 2026, the U.S. Energy Information Administration reported that combined commercial and strategic petroleum reserves had fallen to approximately 791 million barrels, the lowest recorded level since February 2024. This figure is not simply a data point; it represents the measurable erosion of the market's capacity to self-correct.
Reserve levels and price elasticity are directly linked in physical crude markets. When inventories are abundant, a supply disruption of moderate scale triggers a price response that is temporary and self-limiting. When inventories are thin, the same disruption forces price discovery into a more extreme range, because there is no buffer large enough to fill the gap between supply and demand while the market waits for a resolution.
Quantifying the Supply Gap: A Disruption Without Modern Precedent
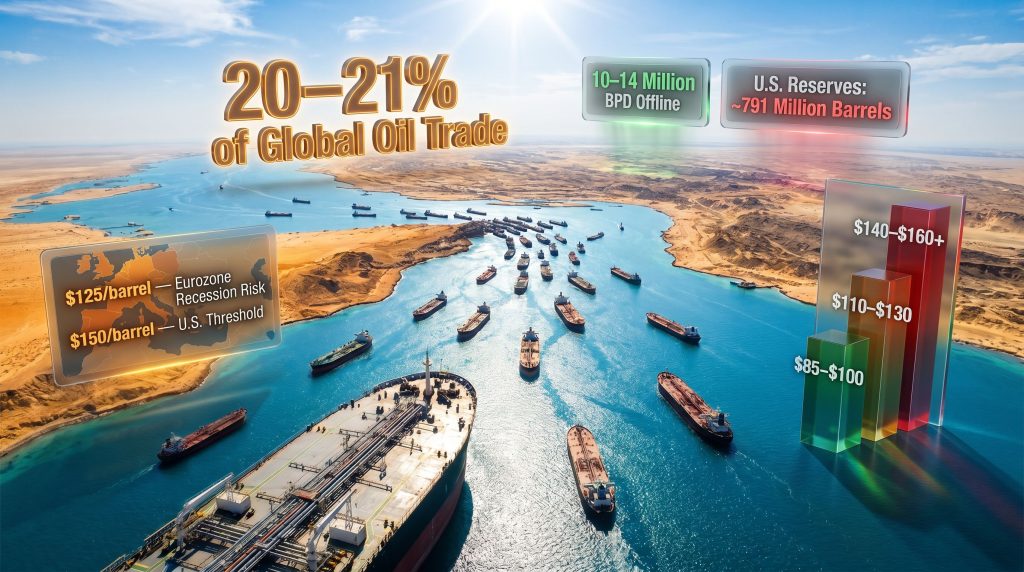
The scale of the current disruption sets it apart from every major supply shock of the past five decades. Estimates place the volume of Middle Eastern production currently offline at somewhere between 10 and 14 million barrels per day, against a backdrop of global consumption running at roughly 100 to 103 million barrels per day. That implies a supply deficit of between 10% and 14% of total world demand operating simultaneously with near-depleted strategic reserves.
Historical comparisons put this in sharp relief:
| Supply Disruption Event | Approximate Volume Removed | % of Global Demand (at time) |
|---|---|---|
| 1973 Arab Oil Embargo | ~5 million bpd | ~8% |
| 1979 Iranian Revolution | ~5.6 million bpd | ~9% |
| 2022 Russia-Ukraine Conflict | ~3 million bpd | ~3% |
| 2026 Middle East Disruption (estimated) | 10–14 million bpd | ~10–14% |
What makes the current situation particularly dangerous is not only the magnitude of the disruption but its duration. Energy economists have long observed that supply disruptions lasting beyond 60 to 90 days fundamentally change how markets function. Inventory releases and demand adjustments can absorb a short shock, but when the gap persists, price discovery begins to shift away from futures-based expectation and toward real-world physical scarcity. At that point, the adjustment mechanism becomes brutally simple: prices rise until demand is suppressed enough to rebalance the market.
What a Global Economy Oil Price Spike Actually Does to Economic Systems
The Transmission Pathway: From Wellhead to Household
Understanding the economic damage from a global economy oil price spike requires tracing the precise pathway through which crude price increases propagate. The oil geopolitical market dynamics at play in 2026 make this transmission particularly complex:
-
Upstream refining: Higher crude input costs compress refinery margins, which are either absorbed as profit losses or passed forward in the form of higher product prices.
-
Transport and logistics: Fuel surcharges rise across road freight, aviation, and maritime shipping. These costs are embedded into nearly every physical good in the global economy.
-
Manufacturing: Energy-intensive industries including chemicals, metals processing, and cement face rising input costs that erode their international competitiveness.
-
Agriculture and food: Fertiliser production, which is closely tied to natural gas prices, becomes more expensive, while diesel-dependent distribution networks push food costs higher at every step of the supply chain.
-
Consumer price indices: Fuel and food components accelerate headline CPI figures, triggering central bank responses that can further tighten financial conditions.
-
Household purchasing power: As energy bills absorb a larger proportion of disposable income, spending on discretionary goods and services contracts, reducing the consumer demand that sustains economic growth.
The Stagflation Trap and Central Bank Paralysis
The macroeconomic policy challenge created by a sustained global economy oil price spike is distinct from other inflationary episodes precisely because it combines rising prices with slowing growth. This stagflationary dynamic denies central banks a clean policy response. Raising interest rates to contain inflation risks deepening the growth slowdown; cutting rates to support growth risks entrenching inflationary expectations.
Deloitte analysis has estimated that a full year of sustained elevated oil prices could add at least 0.75 percentage points to U.S. headline inflation while simultaneously weighing on consumer spending growth. The Bank of England has publicly acknowledged that the current energy environment is actively complicating its interest rate deliberations, a signal with implications well beyond the UK given its influence on European monetary expectations.
Critically, the simultaneous pressure on inflation across the eurozone, the United States, and major emerging markets means that rate-cutting cycles that might otherwise provide economic relief are being delayed at precisely the moment when cyclical weakness is already present.
Regional Vulnerability: A Highly Asymmetric Exposure
Not all economies are equally exposed to an oil price shock. The degree of vulnerability depends on import dependency, the share of energy costs in industrial production, the depth of domestic financial markets, and the capacity of governments to deploy fiscal buffers. Furthermore, the oil market trade-war impact adds additional layers of complexity to these regional risk profiles.
| Region | Import Dependency | Estimated Recession Threshold | Primary Vulnerability |
|---|---|---|---|
| Eurozone | High | ~$125/barrel sustained | Industrial competitiveness, import costs |
| Japan | Very High | Below $125/barrel | Near-total crude import reliance |
| United States | Moderate | ~$150/barrel sustained | Consumer spending, financial conditions |
| China | High | Context-dependent | Refining margins, export competitiveness |
| India | High | Below $120/barrel | Current account deficit, subsidy burden |
| Emerging Markets | Variable | Lower thresholds | Currency depreciation, imported inflation |
Vanguard analysis has suggested that oil sustained at $125 per barrel could remove approximately one percentage point from eurozone GDP and push the region toward contraction. Japan, given its near-total reliance on imported crude, faces comparable recession risk at even lower price levels. The United States, where the shale revolution has partially insulated the domestic economy from supply-side oil shocks according to Federal Reserve research, likely requires prices closer to $150 per barrel combined with materially tighter financial conditions before recession risk becomes acute.
Is the Market Dangerously Underpricing the Physical Risk?
The Paper Market Versus Physical Reality
One of the most analytically striking features of the current episode is the divergence between what financial markets are pricing and what physical inventory data is signalling. As of early June 2026, trader net long positions in Brent crude had fallen to their lowest level in 18 weeks, while short positions on crude had roughly tripled, reflecting a dominant market expectation that the Strait of Hormuz disruption would resolve in the near term.
"Physical inventory data has historically been a more reliable leading indicator of crude price direction than futures market positioning. When the two diverge sharply, it is the physical data that has tended to reassert dominance, often abruptly."
The optimism embedded in current futures positioning creates what might be described as a dangerous pricing lag. End-users, refiners, and policymakers who rely on market signals to calibrate their hedging and procurement strategies are being guided toward complacency at precisely the moment when physical scarcity is building beneath the surface.
The Dark Tanker Problem
Compounding the information challenge is the growing volume of crude moving through opaque shipping channels. Dark tanker activity — referring to vessels that disable their automatic identification system transponders or use deceptive practices to obscure their movements — has surged in the Hormuz corridor. This makes real-time assessment of actual supply flows genuinely difficult, creating uncertainty about the true severity of the disruption and potentially causing markets to underestimate the physical tightness. The Guardian's analysis of how high oil could go underscores just how significant this opaque supply data problem has become.
What Major Institutions Are Warning
The institutional consensus forming around a July 2026 inflection point is unusually unified across organisations that rarely align:
| Institution | Core Warning | Projected Timeline |
|---|---|---|
| International Energy Agency | Inventory breaking point approaching | July to August 2026 |
| Exxon (Neil Chapman, Senior VP) | Critical inventory depletion | Early July 2026 or sooner |
| Chevron (Mike Wirth, CEO) | Physical price pressure intensifying materially | June to July 2026 |
| JP Morgan | Sharp price spike if Hormuz does not normalise | End of June 2026 |
| Goldman Sachs | Demand destruction already partially underway | Ongoing |
| Rosenberg Research | Consumer price shock or demand collapse | Near-term |
When oil majors with direct operational visibility, multilateral energy agencies with global data access, and major investment banks with commodity trading desks all converge on the same timeline, the analytical significance is substantial.
The Strait of Hormuz: A Single Waterway Holding the World to Ransom
Geographic Reality and Its Economic Weight
Approximately 20 to 21 percent of all globally traded oil passes through the Strait of Hormuz, a navigational channel roughly 33 kilometres wide at its narrowest point. There is no viable large-volume alternative routing for Persian Gulf producers at current export scales. The Hormuz chokepoint is not merely a geopolitical abstraction; it is a physical infrastructure constraint that makes the global oil system inherently brittle when conflict enters that geography.
The current disruption is not a single-point failure. Simultaneous pressure points include Houthi activity in the Red Sea restricting alternative routing options, security concerns around the Oman terminal area, Iranian export restrictions, and Israeli strikes on Iranian petrochemical infrastructure. Each of these individually would be manageable; their simultaneity is creating a multi-point supply chain fracture with no single diplomatic solution. Indeed, these geopolitical trade tensions are reshaping the entire architecture of global energy flows.
Cascading Downstream Consequences
The downstream effects are already measurable across multiple markets:
-
China has deferred approximately 500,000 barrels per day of new refining capacity additions as Hormuz disruptions reduce the certainty of feedstock supply.
-
Eurozone fuel sales have declined by 3.5% as war-related price increases suppress retail consumption across the bloc.
-
Russia, facing a parallel reduction in export capacity driven by domestic fuel shortages and Ukrainian drone strikes on refining infrastructure, can no longer serve as a secondary buffer for markets seeking relief from Middle Eastern disruption.
-
India has accelerated its crude supply diversification, including a 51% month-on-month surge in Venezuelan crude imports and the domestic launch of an 85% ethanol-blend fuel to structurally reduce its dependency on dollar-denominated crude imports.
Demand Destruction as a Price Ceiling: Mechanism, Limits, and Hidden Costs
How the Mechanism Works
When crude prices rise sharply, they eventually trigger a self-correcting response through demand destruction: the process by which higher prices force consumers and industrial users to reduce their oil consumption, reducing overall demand and thereby limiting further price escalation. Goldman Sachs observed in early June 2026 that demand destruction had already begun in the current cycle, providing a temporary ceiling on benchmark crude prices.
Kpler shipping data analysis revealed that Chinese refiners had cut crude import volumes significantly more aggressively than they had reduced their actual processing run rates. This means Chinese refiners are currently drawing down domestic inventory stocks rather than cutting production, a strategy that is time-limited. When those domestic inventories reach critically low levels, a sharp resumption of Chinese buying will be forced, and that buying surge could rapidly reverse whatever price suppression demand destruction is currently achieving.
"Demand destruction is not a neutral economic outcome. Every barrel eliminated through price pressure represents suppressed industrial output, reduced household purchasing power, and compressed corporate earnings. When demand destruction becomes the primary mechanism keeping oil prices in check, it signals the economy is already absorbing damage, not avoiding it."
The Hard Floor Below Which Demand Cannot Fall
Essential energy consumption in transport, industrial production, food distribution, heating, and electricity generation cannot be eliminated. It can be deferred, partially substituted, or reduced at the margins, but it cannot fall to zero. This creates a hard floor below which demand destruction cannot push consumption, and below which prices must therefore rise further to clear the market.
Phil Blancato, Chief Market Strategist at wealth management firm Osaic, noted in commentary reported by Reuters that with consumer sentiment already at extreme lows, any further persistence or escalation in oil prices over the following three months would begin to produce genuinely measurable economic damage rather than merely sentiment deterioration.
The next major ASX story will hit our subscribers first
Broader Financial Market Implications and Portfolio Considerations
When Stocks and Bonds Both Face Headwinds
A sustained global economy oil price spike creates a rare environment in which both equity and fixed income assets face simultaneous pressure. Energy inflation forces central banks to maintain restrictive monetary policy, which compresses bond valuations through higher yields. At the same time, the growth slowdown driven by energy cost increases compresses corporate earnings, reducing equity valuations through lower profit expectations.
This dual pressure reduces the diversification benefit of traditional balanced portfolios, a structural challenge for institutional investors managing multi-asset mandates. Monitoring current crude oil prices is therefore becoming increasingly critical for portfolio risk management.
Sectors most exposed to margin compression include:
- Airlines and aviation logistics
- Road freight and maritime transport operators
- Petrochemical and polymer manufacturers
- Agricultural input producers
- Consumer discretionary retailers with high distribution cost exposure
Sectors that may benefit from the same environment include integrated energy majors, oil field services companies, and commodity exporters in non-disrupted producing regions.
Strategic Petroleum Reserve Constraints
The U.S. Strategic Petroleum Reserve is carrying an obligation of approximately 40 million barrels owed back from previous emergency releases made to earlier borrowers. This outstanding obligation materially constrains the government's capacity to deploy the SPR as a price stabilisation tool precisely at the moment when that tool might be most needed.
Beyond the volume constraint, SPR releases have diminishing effectiveness when the underlying disruption is structural rather than temporary. A reserve release can bridge a gap of days or weeks; it cannot substitute for months of lost Middle Eastern production. Forbes analysis on feedback effects from higher oil prices highlights precisely why these structural limitations pose such a severe challenge to policymakers.
Three Scenarios for How This Resolves
| Scenario | Core Assumption | Brent Price Range | Economic Outcome |
|---|---|---|---|
| Base Case: Partial Resolution | Hormuz partially reopens by late July 2026 | $85 to $100/barrel | Elevated inflation, slowed growth, no recession |
| Adverse Case: Prolonged Disruption | Conflict extends through Q3 2026 | $110 to $130/barrel | Stagflationary pressure, possible eurozone and Japan recession |
| Tail Risk: Full Escalation | Regional conflict broadens, full Hormuz closure | $140 to $160+/barrel | Global recession risk, emergency policy responses required |
The base case depends entirely on a diplomatic trajectory that, as of early June 2026, has produced no tangible progress. Iran has described negotiations with the United States as yielding no meaningful advancement, while tanker traffic through Hormuz remains severely disrupted. The adverse and tail-risk scenarios are not remote theoretical constructs; they are the logical continuation of the current trajectory if conditions remain unchanged.
Frequently Asked Questions: Oil Price Spikes and the Global Economy
What oil price level historically triggers a global recession?
Supply shocks sufficient to cause global recessions have typically involved price increases of 50% or more sustained over 12 months, or prices consuming an unusually elevated share of global GDP. Vanguard analysis places the eurozone recession threshold at approximately $125 per barrel sustained, while the U.S. threshold is estimated closer to $150 per barrel when combined with tighter financial conditions.
How quickly do crude price increases reach consumers?
Pass-through from crude to consumer fuel prices typically occurs within 4 to 8 weeks. Broader goods and services inflation, driven by embedded logistics and manufacturing costs, takes 3 to 6 months to fully materialise. The speed of transmission depends heavily on government fuel subsidies, refinery capacity utilisation, and the competitive structure of retail fuel markets.
Does U.S. shale production provide a meaningful buffer?
Federal Reserve research indicates that domestic oil price shocks no longer transmit to the broader U.S. economy with the same intensity as pre-shale era disruptions. However, this buffer is conditional on the disruption being primarily a supply-side pricing event. When the shock is geopolitically driven and simultaneously affects multiple supply sources, the domestic buffer is substantially less effective.
What happens to emerging markets during a major oil price spike?
Net oil-importing emerging market economies face a compounding shock: higher import bills widen current account deficits, currency depreciation amplifies the domestic purchasing power cost of dollar-denominated crude, and tighter global financial conditions driven by inflation concerns in advanced economies simultaneously raise their borrowing costs.
How does China's demand behaviour influence global prices during a disruption?
As the world's largest crude importer, China's procurement decisions have outsized influence on global price formation. The current pattern of Chinese refiners drawing down domestic inventories rather than cutting run rates is temporarily suppressing import demand. When those domestic stocks approach critically low levels, a forced resumption of Chinese buying could rapidly accelerate the price spike that financial markets are currently underestimating.
This article is intended for informational and educational purposes only. It does not constitute financial, investment, or legal advice. Forecasts, scenario projections, and institutional estimates referenced herein involve significant uncertainty and should not be relied upon as predictions of future market outcomes. Readers should consult qualified financial professionals before making investment decisions.
Want to Stay Ahead of the Commodity Discoveries Driving the Next Market Shift?
While energy price shocks reshape global supply chains and investor portfolios, Discovery Alert's proprietary Discovery IQ model scans ASX announcements in real time, instantly identifying significant mineral discoveries across more than 30 commodities before the broader market reacts. Explore how historic discoveries have generated extraordinary returns and begin your 14-day free trial at Discovery Alert to position yourself ahead of the next major opportunity.