May 18, 2026
Understanding Global Energy Economics Through the Lens of Supply Chain Vulnerability
Modern energy markets operate within an intricate web of interconnected supply chains, where single points of failure can cascade into systemic disruptions affecting billions of consumers worldwide. The concentration of critical energy infrastructure in geopolitally volatile regions creates a fundamental tension between economic efficiency and supply security. This dynamic becomes particularly pronounced when examining how regional conflicts can reshape pricing mechanisms across global commodities markets, forcing investors and policymakers to recalibrate their understanding of risk premiums and market volatility.
The complexity of energy economics extends far beyond simple supply and demand calculations. Maritime chokepoints, insurance market dynamics, storage capacity constraints, and central bank monetary policy responses all interact to create non-linear price movements that challenge traditional economic models. Understanding these interconnected systems becomes essential for analysing how geopolitical tensions translate into measurable economic impacts across different sectors and regions.
When big ASX news breaks, our subscribers know first
The Strait of Hormuz: Anatomy of a Critical Energy Bottleneck
Geographic Constraints and Volume Dependencies
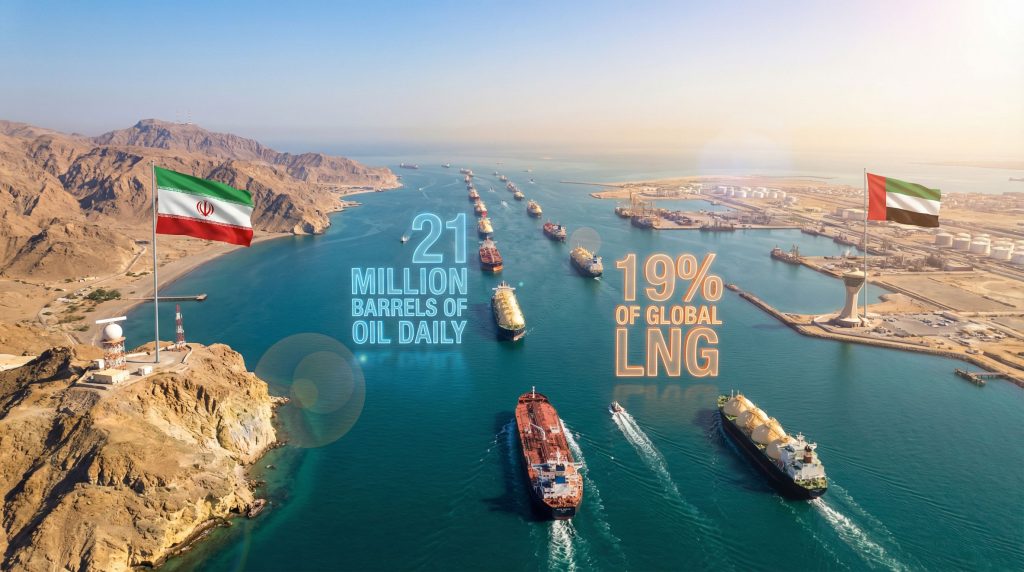
The Strait of Hormuz exemplifies how geographic necessity creates systemic vulnerability in global energy markets. This narrow waterway, spanning just 21 miles at its narrowest point between Oman's Musandam Peninsula and the Iranian coast, serves as the mandatory transit route for approximately 21 million barrels per day of crude oil flows according to U.S. Energy Information Administration data. This volume represents roughly one-fifth of global oil consumption, making any disruption to this passage a potential catalyst for worldwide energy price volatility.
The strait's maritime infrastructure consists of two distinct shipping lanes, each approximately 2 miles wide, separated by a buffer zone established under international maritime law. These narrow corridors force the largest oil tankers to operate at reduced capacity or seek alternative routing that can add thousands of nautical miles to delivery schedules. The depth restrictions limit fully-loaded Very Large Crude Carriers (VLCCs) to drafts of approximately 15-16 meters, requiring careful load management for optimal efficiency.
Historical Disruption Patterns and Market Response
Previous conflicts have demonstrated the strait's vulnerability to both physical attacks and economic warfare tactics. During the 1980-1988 Iran-Iraq War, the so-called "Tanker War" period saw over 500 merchant vessels attacked, creating immediate spikes in shipping insurance premiums and fundamental changes to routing patterns. The 2019 attacks on tanker traffic, including incidents involving the MT Front Altair and MT Andrea Victory, triggered immediate risk premium adjustments of $3-4 per barrel within 48-72 hours of the events.
More recently, the September 2019 attacks on Saudi Aramco's Abqaiq processing facilities removed 5.7 million barrels per day from global supply temporarily, demonstrating how infrastructure targeting can create price impacts even without direct strait closure. Oil prices jumped approximately 20% within hours, with WTI crude rising from around $54 to $65 per barrel before stabilising as strategic petroleum reserve deployment was announced.
Economic Implications of Alternative Routing
When strait access becomes restricted, energy companies face limited alternatives that carry significant cost penalties:
- Cape of Good Hope Routing: Adds approximately 6-8 days transit time and over 3,000 nautical miles to journeys between the Persian Gulf and European markets
- Pipeline Infrastructure: Limited capacity through existing systems like the East-West Pipeline in Saudi Arabia, which can handle roughly 5 million barrels per day
- Additional Transit Costs: Industry estimates suggest alternative routing adds $2-4 per barrel in combined transportation and time-value expenses
These routing alternatives cannot fully compensate for strait closure due to capacity limitations and infrastructure constraints, explaining why even partial disruptions create disproportionate market responses. Furthermore, the strait's vulnerability continues to shape global shipping patterns and energy security considerations.
Dissecting Market Mechanisms Behind Energy Price Volatility
Risk Premium Calculation Methodologies
Energy market risk premiums emerge through sophisticated probability-weighted models that account for multiple disruption scenarios. Current US-Iran conflict impact on oil markets reflects a complex interaction between perceived probability of escalation and potential magnitude of supply disruption. The formation of risk premiums follows a three-phase pattern that has been observed across multiple geopolitical crises.
Phase One occurs within the first 24-72 hours, where futures markets experience immediate volatility spikes driven primarily by algorithmic trading and initial investor psychology. Options market implied volatility expands rapidly, particularly for out-of-the-money call options that provide protection against extreme price increases.
Phase Two develops over the following 1-2 weeks as insurance markets reprice war risk coverage and logistics companies adjust routing patterns. The London-based Lloyd's of London market typically increases Additional War Risk Premiums (AWRP) by 50-100 basis points during this period, translating to thousands of dollars in additional costs per vessel voyage.
Phase Three emerges after several weeks when fundamental supply-demand dynamics begin influencing prices more than speculative positioning. During this phase, strategic petroleum reserve deployment announcements, OPEC+ production adjustments, and demand destruction signals from high prices start determining price direction.
How Do Freight Rate Explosions Create Cascading Effects?
Maritime freight markets serve as early indicators of supply chain stress, often experiencing percentage increases that dwarf crude oil price movements. Very Large Gas Carrier (VLGC) rates have demonstrated the most extreme volatility during geopolitical crises, with 400%+ increases occurring within days of conflict escalation according to industry shipping data.
The mechanics behind these dramatic freight rate increases include:
- Insurance Cost Pass-Through: War risk insurance premiums immediately impact charter rates
- Route Avoidance: Vessels avoiding high-risk zones create artificial scarcity in available tonnage
- Inventory Building: Buyers rushing to secure cargoes before further escalation create short-term demand surges
Westbound LR (Long Range) tanker rates hitting 21-month highs reflects this dynamic, as refined product movements from Middle Eastern export hubs to Western markets require premium rates to compensate shipowners for elevated risks. Additionally, the broader implications of global oil market conflicts demonstrate how interconnected these systems have become.
The Convex Nature of Supply Disruption Pricing
Energy markets exhibit non-linear price responses to supply disruptions due to storage capacity constraints and demand elasticity characteristics. This "convex" relationship means that small supply reductions can create disproportionately large price increases when storage levels approach capacity limits.
The mathematical relationship follows the pattern: Price Impact ≈ Disruption Volume / (Total Storage Capacity – Current Storage Utilisation)
This formula explains why identical supply disruptions can create vastly different price responses depending on existing inventory levels. When commercial crude storage operates at 90%+ capacity, even minor supply interruptions can trigger exponential price increases as market participants compete for limited remaining storage space.
Conflict Scenario Modelling and Economic Impact Assessment
What Are the Escalation Pathways and Price Response Mechanisms?
Energy economists utilise scenario-based modelling to estimate potential price impacts across different conflict intensities. These models incorporate historical precedents whilst adjusting for current market conditions, storage levels, and available spare capacity.
| Scenario Type | Historical Reference | Price Impact Range | Duration Estimate | Recovery Timeline |
|---|---|---|---|---|
| Limited Retaliation | 2019 Gulf Tanker Incidents | $3-5/barrel | 2-3 weeks | 30-45 days |
| Infrastructure Targeting | 2019 Abqaiq Attacks | $15-25/barrel | 4-8 weeks | 60-120 days |
| Partial Strait Disruption | 1988 Operation Praying Mantis | $35-55/barrel | 2-4 months | 120-180 days |
| Extended Regional Conflict | Modelling Exercise Only | $75-100+/barrel | 6+ months | 18-36 months |
OPEC+ Spare Capacity and Response Capabilities
The Organisation of Petroleum Exporting Countries and its allies (OPEC+) maintains spare production capacity as a buffer against supply disruptions. Current estimates suggest approximately 2-3 million barrels per day of spare capacity exists across member nations, with Saudi Arabia holding the largest share at roughly 1.5-2 million barrels per day.
However, spare capacity utilisation faces several constraints during geopolitical crises. Consequently, the OPEC oil production impact becomes crucial in determining global market stability:
- Technical Lead Times: Bringing spare capacity online requires 30-90 days depending on field conditions
- Infrastructure Limitations: Export terminal capacity may constrain rapid production increases
- Political Considerations: OPEC+ members may hesitate to fully utilise spare capacity if doing so appears to benefit conflict participants
Furthermore, the development of Saudi exploration licenses continues to influence long-term production capabilities.
Strategic Reserve Deployment Economics
The International Energy Agency (IEA) coordinates emergency oil stock releases among member countries during supply disruptions. The United States Strategic Petroleum Reserve, containing approximately 400-500 million barrels, represents the world's largest government-controlled oil inventory. However, release mechanisms involve complex decision-making processes that consider:
- Market Impact Timing: Releases must be coordinated to maximise price stabilisation effects
- Replacement Costs: Government reserves require eventual replenishment, typically at higher prices
- Political Dynamics: Emergency releases carry domestic political implications for administrations
The effectiveness of strategic reserve releases depends heavily on coordination timing and market communication strategies.
Regional Economic Exposure and Vulnerability Assessment
European Energy Security Under Renewed Pressure
European economies face compounding energy security challenges when Middle Eastern supply disruptions coincide with existing constraints on pipeline gas supply. The continent's industrial competitiveness relies heavily on affordable energy inputs, particularly for energy-intensive sectors such as:
- Chemical and Petrochemical Manufacturing: Requires stable feedstock pricing for production planning
- Steel and Aluminium Production: Energy costs represent 20-30% of total production expenses
- Glass and Ceramic Industries: Natural gas price volatility directly impacts profit margins
European manufacturing sectors demonstrate high sensitivity to energy price fluctuations, with studies indicating that 10% increases in energy costs typically translate to 2-3% reductions in industrial output within 6-12 months.
Asian Manufacturing Hub Vulnerabilities
Asian economies exhibit diverse energy security profiles, with some nations maintaining minimal strategic reserves whilst others have built substantial buffer capacity. Taiwan's critical constraint of maintaining only 30-day LNG inventory exemplifies the vulnerability of just-in-time energy supply chains.
Key vulnerability factors across Asian markets include:
- South Korea: Heavy reliance on LNG imports for power generation and petrochemical feedstock
- Japan: Limited storage capacity relative to consumption requirements
- India: Growing energy import dependency amid rapid economic growth
- China: Large strategic reserves but massive absolute consumption volumes
Emerging Market Debt and Currency Pressures
Energy-importing emerging market economies face particular vulnerability during oil price spikes due to current account deficit pressures and currency devaluation risks. Countries with high energy import bills relative to GDP experience immediate pressure on:
- Foreign Exchange Reserves: Depleted through increased import payments
- Government Fiscal Balances: Energy subsidies strain public finances
- External Debt Sustainability: Dollar-denominated debt becomes more expensive to service as currencies weaken
Historical precedent shows that $20+ oil price increases sustained over 3-6 months typically trigger currency crises in at least 3-5 vulnerable emerging market economies. In addition, the broader implications of US tariffs and inflation compound these economic pressures on vulnerable nations.
Financial Market Dynamics and Investment Strategy Implications
Energy Futures Curve Analysis and Backwardation Patterns
Energy futures markets provide real-time insight into market expectations regarding supply security and price trajectories. During geopolitical crises, futures curves typically shift from "contango" (upward sloping) to "backwardation" (downward sloping) as near-term supply concerns dominate long-term fundamental outlooks.
The degree of backwardation serves as a market-based indicator of crisis severity:
- Mild Backwardation (1-month futures $2-5 above 12-month futures): Temporary supply concern
- Moderate Backwardation ($5-15 spread): Sustained disruption expectations
- Severe Backwardation ($15+ spread): Market pricing extended crisis scenario
Options market volatility indicators, particularly the crude oil volatility index (OVX), typically spike from normal levels around 25-35% to crisis levels of 50-70% during major geopolitical events.
Sector Rotation and Defensive Positioning Strategies
Energy crises create predictable sector rotation patterns as investors adjust portfolios based on expected winners and losers from higher energy prices:
Beneficiary Sectors:
- Energy Company Equities: Direct beneficiaries of higher commodity prices
- Utilities with Regulated Rate Structures: Can pass through higher costs to consumers
- Gold and Precious Metals: Traditional inflation hedges gain appeal
- Agricultural Commodities: Energy-intensive food production costs increase
Vulnerable Sectors:
- Airlines and Transportation: Direct operational cost exposure to fuel prices
- Consumer Discretionary: Reduced disposable income from higher energy costs
- Energy-Intensive Manufacturing: Margin compression from higher input costs
The historic gold surge during recent geopolitical tensions exemplifies how investors seek safe-haven assets during energy crises.
Currency and Commodity Correlation Dynamics
Energy crises create distinctive patterns in currency markets as petrodollar recycling mechanisms adjust to new price levels. Resource-exporting currencies typically strengthen whilst energy-importing nations experience currency weakness. The U.S. dollar often exhibits complex behaviour, strengthening due to safe-haven demand whilst potentially weakening due to current account adjustments.
The next major ASX story will hit our subscribers first
Central Bank Policy Dilemmas and Macroeconomic Transmission
Monetary Policy Constraints During Supply Shocks
Central banks face challenging policy trade-offs when energy price increases threaten to trigger broader inflationary pressures. Traditional monetary policy tools prove less effective against supply-side inflation, creating dilemmas for policymakers at major central banks:
- Federal Reserve: Must balance domestic growth concerns against inflation mandate
- European Central Bank: Faces additional complexity from heterogeneous member state energy exposures
- Bank of Japan: Energy import dependency creates direct inflation transmission mechanisms
Historical analysis indicates that central banks typically "look through" temporary energy price spikes lasting less than 6 months, but begin tightening monetary policy if energy price increases persist beyond this timeframe and begin affecting core inflation expectations.
Labour Market Impacts and Consumer Spending Adjustments
Energy price increases create measurable impacts on consumer behaviour patterns and labour market dynamics. Transportation costs affect commuting decisions whilst heating and cooling costs impact discretionary spending across different income segments.
Research indicates that sustained $20+ oil price increases typically result in:
- Discretionary Spending Reduction: 3-5% decline in non-essential purchases within 3-6 months
- Labour Market Adjustments: Reduced job mobility due to higher commuting costs
- Regional Economic Divergence: Energy-producing regions benefit whilst consuming regions suffer
Moreover, analysis of tariffs' market impacts reveals how trade policy interacts with energy costs to amplify economic pressures.
Long-Term Structural Economic Implications
Energy Independence Policy Acceleration
Recurring energy security crises accelerate domestic energy production investments and strategic alliance formation around energy partnerships. Policy responses typically include:
- Domestic Production Incentives: Tax benefits and regulatory streamlining for local energy projects
- Strategic Alliance Formation: Long-term supply agreements with stable partner nations
- Technology Investment: Accelerated deployment of alternative energy sources
- Infrastructure Development: Expanded pipeline networks and storage capacity
These policy responses create permanent structural changes in energy markets that persist long after immediate crises resolve.
Industrial Location and Trade Pattern Restructuring
Repeated energy price volatility encourages industrial location decisions based on energy security considerations rather than purely cost-based optimisation. This trend manifests through:
- Reshoring Manufacturing: Companies relocate production closer to consumer markets to reduce transportation exposure
- Regional Trade Bloc Formation: Economic partnerships based on energy complementarity rather than traditional trade advantages
- Supply Chain Diversification: Multiple supplier relationships to reduce single-source dependencies
Investment Strategy Evolution and Market Structure Changes
Prolonged energy market volatility drives fundamental changes in investment approaches and market structure. Institutional investors increasingly incorporate energy security metrics into investment decision-making processes, whilst market makers adjust trading algorithms to account for higher volatility periods.
The emergence of energy transition investments accelerates during crisis periods as investors seek to reduce exposure to geopolitical risk through renewable energy infrastructure and battery storage technologies. This creates permanent shifts in capital allocation patterns that reshape energy market dynamics over multi-year periods.
However, the US-Iran conflict impact on oil markets continues to influence global energy strategies, with policymakers and investors alike recognising that geopolitical stability remains crucial for long-term energy security planning.
Disclaimer: This analysis contains forward-looking assessments and scenario modelling that involve significant uncertainties. Energy market dynamics depend on numerous variables including geopolitical developments, technological changes, and macroeconomic conditions that cannot be predicted with certainty. Historical precedents may not accurately predict future market behaviour, and actual outcomes may differ materially from scenario projections discussed herein. Investors should consult with qualified professionals before making investment decisions based on this analysis.
Seeking Opportunities in Energy Market Volatility?
Discovery Alert's proprietary Discovery IQ model delivers real-time alerts on significant mineral discoveries across the ASX, helping investors identify actionable opportunities in resource stocks that often benefit during periods of energy market uncertainty. With geopolitical tensions creating new investment dynamics, subscribers gain instant access to discoveries in critical minerals and energy resources that could capitalise on these evolving market conditions. Begin your 14-day free trial today to position yourself ahead of market movements in this volatile environment.