May 18, 2026
When Volume Growth Meets Margin Recovery: Reading Between the Lines of a Coal Producer's Quarterly Numbers
Investors who focus exclusively on commodity price headlines often miss the more telling story buried inside quarterly operational data. In the thermal coal sector, the interplay between production efficiency, cost control, and capital allocation frequently reveals more about a company's underlying quality than any single benchmark price movement. A quarter where output rises, unit costs fall, and the balance sheet is simultaneously strengthened represents a convergence of operational and financial discipline that deserves careful examination, particularly for ASX-listed resource investors navigating a sector that remains deeply misunderstood by mainstream markets.
New Hope Corporation's (ASX: NHC) third quarter of FY26 delivered precisely this kind of convergence. The New Hope Corporation quarterly update coal output and profit figures released in May 2026 painted a picture of accelerating operational momentum against a backdrop of earlier revenue headwinds, raising important questions about trajectory, sustainability, and how the market should interpret what the numbers actually signal.
When big ASX news breaks, our subscribers know first
Decoding the Q3 FY26 Operational Performance: A Production-First Analysis
What the Production Chain Actually Reveals
Understanding coal mining performance requires looking at each stage of the production chain, from raw extraction through to customer delivery. Run-of-Mine (ROM) coal is the raw material extracted from the pit before any washing, processing, or quality sorting occurs. Saleable coal is what remains after the coal handling and preparation plant (CHPP) removes impurities, ash, and moisture to meet customer specifications.
The ratio between these two figures, known as the yield or conversion efficiency, is a critical but often overlooked metric in assessing mine-level operational performance. Furthermore, understanding coal supply challenges that affect the broader sector helps contextualise why such operational efficiency metrics carry such weight for investors.
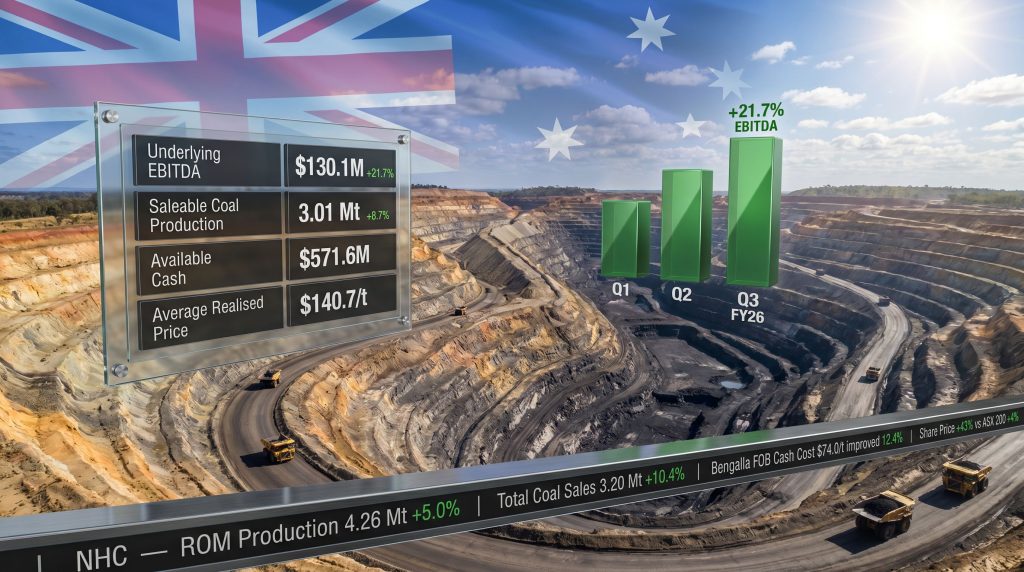
In Q3 FY26, New Hope's group ROM coal production reached 4.26 million tonnes, a 5.0% increase from the prior quarter, while saleable coal production climbed to 3.01 million tonnes, representing an 8.7% quarterly improvement. Crucially, total coal sales of 3.20 million tonnes actually exceeded saleable production, indicating the company drew on inventory built in prior periods — a deliberate logistics strategy that allowed it to maximise revenue capture despite any short-term production constraints.
The headline financial metrics confirm that volume leverage is working:
| Metric | Q3 FY26 Result | Quarter-on-Quarter Change |
|---|---|---|
| Group ROM Coal Production | 4.26 Mt | +5.0% |
| Saleable Coal Production | 3.01 Mt | +8.7% |
| Total Coal Sales | 3.20 Mt | +10.4% |
| Average Realised Sales Price | $140.7/t | +1.2% |
| Underlying EBITDA | $130.1 million | +21.7% |
| Available Cash | $571.6 million | End of quarter |
What stands out is the disproportionate EBITDA growth relative to the sales volume improvement. A 10.4% lift in sales volumes driving a 21.7% jump in underlying EBITDA suggests meaningful cost leverage at work, not merely top-line expansion. This kind of operating leverage is characteristic of mines where fixed cost absorption improves materially as throughput increases.
How Bengalla Mine's Cost Efficiency Shaped the Profitability Outcome
Bengalla, located in the Hunter Valley of New South Wales, is New Hope's flagship thermal coal asset and the primary driver of group EBITDA. The mine produces high-quality thermal coal with competitive energy content ratings that are well-suited to premium Asian power generation markets, particularly in Japan and South Korea where utility buyers tend to have stricter specifications than buyers in emerging markets.
In Q3 FY26, Bengalla achieved a 12.4% improvement in FOB (free on board) cash costs, reducing the cost per sales tonne to $74.0. FOB cash costs are a critical benchmarking metric in the seaborne coal trade because they represent the all-in cost of getting coal onto a vessel at the export terminal, excluding royalties and corporate overhead. A lower FOB cost relative to realised prices directly expands the cash margin per tonne, which compounds significantly across millions of tonnes of annual production.
The key cost levers at Bengalla during the quarter were:
- Stronger sales volumes spreading fixed operating costs across a larger production base
- Improved operational execution reducing unplanned downtime and equipment maintenance costs
- Sustaining capital expenditure guidance revised downward by 21%, signalling efficiency gains without compromising the mine's production capacity targets
It is worth noting that Bengalla is targeting a return to its 13.4 million tonne per annum ROM production rate in the second half of FY26, following weather-related disruptions to pit sequencing in earlier quarters. Queensland and New South Wales coal mining regions are periodically affected by La Nina weather patterns that increase rainfall, flooding low-lying pit areas and forcing temporary suspension of mining operations in specific cut sequences. These disruptions create short-term throughput gaps that can take one to two quarters to fully recover, which is consistent with the sequential improvement pattern observed across the first three quarters of FY26.
New Acland Mine: Navigating Higher Strip Ratios Without Sacrificing Sales
New Acland, located in Queensland's Darling Downs region, operates under a structurally different geological profile than Bengalla. The mine is an open-cut thermal coal operation where the ratio of overburden to coal recovered, known as the strip ratio, can vary considerably depending on which area of the mine is being worked.
Higher strip ratios are an inherent characteristic of open-cut coal mining during phases where the geological profile requires removing more overburden per tonne of coal recovered. This is not an operational failure; it is a known and foreseeable cost of progressing through a mine's geological sequence. However, it does create short-term cost and volume headwinds.
Despite slightly lower ROM production due to elevated strip ratios during Q3 FY26, New Acland's coal sales volumes actually increased. This counterintuitive outcome reflects effective inventory management and scheduling discipline, where the operation drew from stockpile to maintain customer delivery commitments even as the pit geometry temporarily constrained fresh extraction volumes. Production guidance for New Acland was reaffirmed for the remainder of FY26.
How Q3 FY26 Fits Within the Broader FY26 Earnings Trajectory
Contextualising Q3 Against the First Half of FY26
The Q3 result cannot be properly evaluated without understanding what preceded it. New Hope's first half of FY26 was materially affected by the combination of weaker global thermal coal benchmark prices and the earlier production constraints at Bengalla. Revenue for the first half declined approximately 20.1% year-on-year to around $814.4 million, while underlying EBITDA across both quarters combined reached approximately $214.8 million. In addition, Australia's resource export challenges during this period created additional headwinds across the broader sector.
The compression in net profit after tax during 1H FY26 was severe, falling approximately 84% year-on-year to around $54.3 million, underscoring the extraordinary sensitivity of thermal coal earnings to benchmark price movements.
This context reframes Q3 FY26 not as a standalone achievement but as the first convincing evidence of an operational recovery trajectory. The 21.7% quarter-on-quarter EBITDA improvement to $130.1 million represents meaningful sequential acceleration. If sustained or improved upon in Q4 FY26, the full-year EBITDA profile would represent a significant back-half weighting — a pattern common in mining businesses where operational disruptions in earlier periods are followed by recovery as conditions normalise.
The Coal Price Sensitivity Problem: Why Volume Growth Alone Is Not Enough?
One of the most important but frequently misunderstood aspects of thermal coal economics is the non-linear relationship between price and profitability. Because a significant portion of mining costs remain relatively fixed regardless of the prevailing coal price, even modest improvements in the benchmark price can have an outsized impact on EBITDA margins. Understanding how commodity prices and mining performance interact is, consequently, essential for investors assessing New Hope's earnings potential.
The average realised sales price of $140.7 per tonne in Q3 FY26 represented a modest 1.2% improvement from the prior quarter. While the improvement appears small in percentage terms, its impact on margin is amplified because it falls almost entirely to the EBITDA line once production costs are covered. Combined with improved volumes and lower unit costs, the collective effect produced a profitability outcome that significantly outpaced the individual magnitude of any single improvement.
Share Price Performance as a Market Confidence Signal
Over the 12 months preceding the Q3 FY26 announcement, New Hope Corporation shares appreciated approximately 43%, compared to approximately 4% for the S&P/ASX 200 Index over the same period. This substantial outperformance is notable for several reasons.
First, it occurred during a period when New Hope's year-on-year financial results were declining, suggesting the market was pricing in an operational recovery ahead of the reported numbers. This is a classic example of equity markets functioning as a forward-looking mechanism rather than a backward-looking scoreboard. Second, the magnitude of outperformance reflects both sector-specific demand dynamics and company-specific capital management activity discussed below.
What Is New Hope Corporation's Capital Management Strategy in FY26?
The Convertible Notes Restructure: Extending the Debt Maturity Runway
One of the most significant but least-discussed aspects of New Hope's Q3 FY26 activity was a proactive balance sheet management transaction. The company issued $300 million in new convertible notes due 2032 while simultaneously repurchasing $293.3 million of existing notes due in 2029. The net cash outflow was minimal, but the strategic outcome was material.
By extending the debt maturity profile by three years, New Hope reduced its near-term refinancing obligations during a period when credit market conditions for fossil fuel companies can be unpredictable. Securing a 2032 maturity runway provides substantially greater flexibility to manage its balance sheet without being forced into refinancing negotiations during unfavourable market windows.
Dividend and Buyback: Dual-Track Capital Return in Practice
The capital return strategies employed by New Hope in Q3 FY26 are instructive for investors assessing the company's approach to shareholder value allocation. During the quarter:
- Fully franked dividends of 10 cents per share were paid, totalling approximately $84.3 million in aggregate
- The on-market share buyback program remained active, reducing the share count and improving per-share metrics for remaining shareholders
- Available cash at quarter end stood at $571.6 million, robust despite the dividend payment and convertible note transaction
The persistence of a strong cash balance after these outflows indicates that operational free cash flow generation during the quarter was substantial. A company that can simultaneously pay an $84.3 million dividend, execute a debt restructuring transaction, maintain an active buyback, and still hold $571.6 million in cash is demonstrating a free cash flow profile that warrants close attention.
The combination of fully franked dividends and an active buyback represents a dual-track capital return strategy that carries particular value for Australian resident shareholders and complying superannuation funds, which can use the attached franking credits to offset tax liabilities, effectively increasing the after-tax yield relative to unfranked distributions.
Management's stated intention to continue assessing options to return further value to shareholders leaves the door open for special dividends or buyback acceleration if the operational recovery in Q4 FY26 produces additional free cash flow above internal expectations.
How Are New Hope's Two Core Mining Operations Performing Individually?
Side-by-Side Mine Performance Comparison
| Performance Dimension | Bengalla Mine | New Acland Mine |
|---|---|---|
| ROM Production Trend | Improving; targeting return to 13.4 Mtpa | Slightly lower due to strip ratio phase |
| FOB Cash Cost | $74.0/t (improved 12.4%) | Not separately disclosed |
| Sales Volume Trend | Increasing | Increasing despite lower ROM |
| FY26 Production Guidance | Reaffirmed | Reaffirmed |
| Sustaining Capex Guidance | Reduced by 21% | Not separately revised |
| Geographic Location | Hunter Valley, NSW | Darling Downs, QLD |
Bengalla: Understanding the Mine's Operational DNA
Bengalla is a joint venture operation located approximately 12 kilometres from Muswellbrook in the Hunter Valley, one of Australia's most productive and established thermal coal mining regions. The Hunter Valley benefits from well-developed rail infrastructure connecting mines to the Port of Newcastle, which is the world's largest coal export port by volume. This infrastructure advantage reduces logistical risk relative to newer coal operations that may face bottlenecks or capacity constraints.
The mine's coal quality profile, characterised by relatively consistent energy content and low ash and sulphur specifications, makes it well-positioned for premium markets in northeast Asia. Japanese utility buyers in particular have historically valued Hunter Valley coal for its blending properties and reliability of supply — factors that can support above-benchmark realised prices on a consistent basis.
New Acland: The Strip Ratio Dynamics Worth Understanding
Strip ratios in open-cut mining are measured in bank cubic metres of overburden per tonne of coal recovered. A strip ratio of 6:1, for example, means six cubic metres of overburden must be removed for every tonne of coal extracted. As mines progress laterally and to greater depths in some areas, strip ratios can increase temporarily before declining again as the mining sequence moves to more favourable geological areas.
For investors, elevated strip ratios are a short-term cost headwind with a defined lifespan. They do not indicate deteriorating coal quality or resource depletion in isolation. The reaffirmation of FY26 production guidance at New Acland, despite the current strip ratio challenge, signals that the mine plan accounts for this phase within the broader annual production target.
What Is the Demand Outlook for Thermal Coal in New Hope's Key Export Markets?
Forward Contract Coverage as a Revenue Visibility Tool
One of the more strategically significant disclosures in New Hope's Q3 FY26 update was the confirmation that most of the following quarter's production was already contracted at the time of reporting. In commodity markets, forward contract coverage functions as a partial hedge against spot price volatility, locking in a known revenue floor for a defined portion of production.
This approach reduces the earnings variance that pure spot market exposure would create, and it is particularly valuable in thermal coal markets where benchmark prices can move significantly based on weather events, hydropower availability, and geopolitical supply disruptions. You can review the full FY26 half-year results directly on New Hope's website for additional context on the company's contract positioning and revenue strategy.
Asian Demand Dynamics: The Structural Reality Behind the Headlines
The thermal coal demand picture in Asia is more nuanced than Western energy transition narratives often suggest. While Europe has accelerated its exit from coal-fired power generation, electricity systems in Japan, South Korea, India, Vietnam, and the Philippines continue to rely heavily on thermal coal as a baseload generation source. Energy security considerations have reinforced the strategic value that governments in these countries place on reliable coal supply chains.
Japan's utility sector has maintained long-term coal supply agreements with Australian producers as a key component of its energy diversification strategy. South Korea similarly maintains significant coal import volumes despite domestic decarbonisation targets. India's rapidly expanding electricity demand, driven by urbanisation and industrial growth, continues to absorb additional seaborne thermal coal volumes beyond what domestic production can supply.
The next major ASX story will hit our subscribers first
Key Risks Facing New Hope Corporation in the Remainder of FY26
Coal Price Sensitivity: The Dominant Earnings Variable
The 1H FY26 experience, where an approximate 84% decline in net profit after tax accompanied a roughly 20% revenue decline, illustrates with stark clarity how sensitive New Hope's earnings are to coal price movements. At current production volumes, even small percentage changes in average realised prices translate into material absolute dollar impacts on EBITDA, given that a large portion of the cost base is relatively fixed over the short term.
The modest 1.2% improvement in average realised price to $140.7 per tonne in Q3 FY26 is encouraging as a directional signal, but it remains insufficient to fully reverse the revenue compression experienced earlier in FY26. Sustained improvement in Asian thermal coal benchmark prices would be required to materially improve the year-on-year comparison when full-year FY26 results are reported.
Operational and Weather-Related Risks
Key operational risk factors for the remainder of FY26 include:
- Bengalla's return to 13.4 Mtpa ROM capacity is contingent on stable pit sequencing and favourable weather conditions in the Hunter Valley
- New Acland's strip ratio phase introduces ongoing short-term cost pressure until the mining sequence progresses to lower-ratio areas
- Seasonal weather patterns in both Queensland and New South Wales mining regions historically create rainfall-driven disruption risks during certain months of the year
Balance Sheet Monitoring Post-Restructure
While the convertible note restructuring significantly reduces near-term refinancing pressure, the $571.6 million cash balance must be evaluated against ongoing capital commitments. These include sustaining capital expenditure at both mines, the active share buyback program, and the expectation of future dividend payments. Any deterioration in operating cash flow due to price or volume weakness would require management to prioritise among these competing demands.
How Should Investors Interpret New Hope's FY26 Guidance Reaffirmation?
What Reaffirmed Guidance Actually Signals
Production guidance reaffirmation for both Bengalla and New Acland serves multiple signalling functions beyond the literal confirmation that output targets remain achievable:
- It indicates that management has not identified any material operational issues requiring downward revision at either mine
- It reduces the risk of a negative earnings surprise in Q4 FY26 from a volume perspective
- The simultaneous reduction of Bengalla's sustaining capex guidance by 21% without any revision to production guidance suggests the capital efficiency of the mine is improving — a positive signal for long-term free cash flow generation
Capital Return Framework Compared to Quarter-End Metrics
| Capital Return Metric | New Hope Corporation (Q3 FY26) |
|---|---|
| Interim Dividend | 10 cents per share (fully franked) |
| Total Dividend Payment | ~$84.3 million |
| Share Buyback Status | Active (on-market) |
| Available Cash at Quarter End | $571.6 million |
| Convertible Note Maturity | Extended to 2032 |
| Sustaining Capex Guidance (Bengalla) | Reduced by 21% |
The combination of metrics above represents a capital management framework that simultaneously rewards current shareholders through dividends and buybacks, protects balance sheet flexibility through debt maturity extension, and signals operational efficiency through reduced capex requirements. For investors seeking further detail, the half-year results presentation provides an in-depth breakdown of the financial and operational drivers behind these outcomes. This multi-dimensional approach to capital allocation reflects a management team that is making active choices about how to balance near-term shareholder returns against long-term financial resilience.
Frequently Asked Questions: New Hope Corporation Q3 FY26 Update
What was New Hope Corporation's coal production in Q3 FY26?
Group ROM coal production reached 4.26 million tonnes in Q3 FY26, representing a 5.0% increase from the prior quarter. Saleable coal production was 3.01 million tonnes, up 8.7% quarter-on-quarter, with total coal sales reaching 3.20 million tonnes, exceeding saleable production through inventory drawdown.
What was New Hope's underlying EBITDA in Q3 FY26?
Underlying EBITDA for Q3 FY26 was $130.1 million, a 21.7% improvement compared to the previous quarter, driven by higher sales volumes, improved FOB cash costs at Bengalla, and a modest increase in average realised coal prices.
How much cash does New Hope Corporation hold?
As at the end of Q3 FY26, New Hope held $571.6 million in available cash, maintained after paying an approximately $84.3 million fully franked interim dividend and completing a convertible notes restructuring transaction.
What is the outlook for New Hope Corporation's production in FY26?
New Hope reaffirmed production guidance for both Bengalla and New Acland mines. Bengalla is expected to return to its 13.4 million tonne per annum ROM production rate in the second half of FY26, following earlier weather-related disruptions to pit sequencing. The New Hope Corporation quarterly update coal output and profit trajectory remains central to this guidance reaffirmation.
Why did New Hope restructure its convertible notes?
The company issued $300 million in new notes maturing in 2032 and repurchased $293.3 million of notes originally due in 2029. The transaction extended the debt maturity profile, reducing near-term refinancing obligations and improving balance sheet flexibility during a period of variable lender appetite for coal sector debt.
How has New Hope's share price performed over the past year?
New Hope Corporation shares rose approximately 43% over the 12-month period preceding the Q3 FY26 announcement, materially outperforming the S&P/ASX 200 Index, which returned approximately 4% over the same timeframe. This outperformance reflects early market recognition of the operational recovery momentum now confirmed in the New Hope Corporation quarterly update coal output and profit data.
This article contains general information only and does not constitute financial advice. Past performance is not indicative of future results. Investments in resource sector companies involve significant risks, including commodity price volatility, operational disruptions, and regulatory changes. Readers should seek independent financial advice tailored to their personal circumstances before making any investment decisions. All financial data referenced in this article is sourced from New Hope Corporation's ASX-disclosed quarterly activities report for Q3 FY26. For access to the original company announcement, visit the ASX platform directly.
Want To Catch The Next Major ASX Resource Discovery Before The Market Moves?
Discovery Alert's proprietary Discovery IQ model scans ASX announcements in real time, instantly identifying high-potential mineral discoveries and turning complex resource data into actionable investment insights — the same kind of disciplined, data-driven analysis that separates informed investors from the crowd. Start your 14-day free trial today and explore how historic ASX discoveries have generated extraordinary returns.