
June 6, 2026
Understanding Global Energy Infrastructure Vulnerabilities
Modern energy markets operate within an intricate web of geographic dependencies and supply chain concentrations that create systemic risks for the global economy. When critical chokepoints face disruption, the resulting market dynamics reveal how deeply interconnected energy security has become with broader economic stability. The Strait of Hormuz tension exemplifies these vulnerabilities, stemming not from isolated incidents, but from decades of infrastructure development that prioritised efficiency over resilience, creating single points of failure that can cascade through entire economic systems.
The concentration of global energy flows through narrow geographic corridors has created a fundamental tension between operational efficiency and strategic security. While these arrangements have historically enabled cost-effective energy distribution, they simultaneously expose the global economy to disproportionate risks when geopolitical tensions emerge in critical regions.
When big ASX news breaks, our subscribers know first
What Makes Critical Maritime Routes Essential to Global Energy Security?
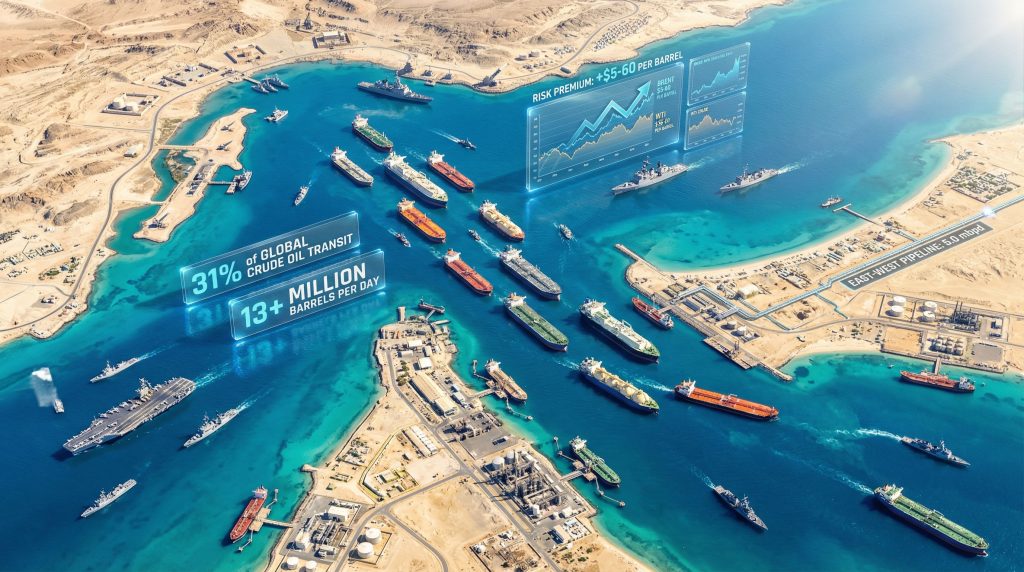
The world's energy infrastructure depends heavily on a limited number of maritime chokepoints, with the Strait of Hormuz representing the most strategically significant passage. This 21-mile wide waterway at its narrowest point serves as the primary transit route for approximately 20-21% of globally traded oil, according to International Energy Agency assessments, with daily throughput volumes ranging from 13 to 22 million barrels per day depending on global demand cycles.
This strategic waterway's importance cannot be understated, particularly given recent US–China trade impacts affecting global energy demand patterns. The strait has become a focal point where broader geopolitical tensions intersect with energy security concerns.
Geographic Concentration Creates Systemic Risk
The Persian Gulf region's energy exports flow through this singular maritime corridor, creating an unavoidable convergence zone where multiple OPEC+ producers depend on the same transit route. Saudi Arabia, UAE, Iraq, Kuwait, and Iran collectively account for approximately 35-40% of global crude oil exports, with the vast majority requiring Strait passage to reach international markets.
Furthermore, this concentration is exacerbated by the OPEC production impact on global supply dynamics. When production decisions align with transit vulnerabilities, the cumulative effect on market stability becomes exponential.
Key Strategic Dependencies:
- Regional LNG flows representing 20% of global liquefied natural gas trade
- Limited alternative pipeline capacity for full route replacement
- Insurance cost volatility during tension periods
- Exponentially increasing naval protection requirements
This geographic bottleneck effect cannot be circumvented by market participants, creating systematic vulnerability that extends beyond individual producers to global energy infrastructure stability. The constraint represents what economists term a single-point-of-failure infrastructure asset where geopolitical tensions create immediate economic transmission mechanisms.
Alternative Route Capacity Analysis
When primary transit routes face disruption, alternative infrastructure reveals significant limitations in handling redirected energy flows:
| Alternative Route | Design Capacity (mbpd) | Current Utilisation | Expansion Constraints |
|---|---|---|---|
| Saudi East-West Pipeline | 5.0 | 60% | Limited expansion potential |
| Red Sea Maritime Routes | 2.8 | 70% | Secondary chokepoint risks |
| Suez Canal Alternative | 2.3 | Variable | Seasonal capacity constraints |
| Cape of Good Hope Route | Unlimited | Time-dependent | +25-30 days transit time |
Note: Pipeline capacity figures reflect design capacity rather than consistent operational throughput, particularly in conflict-affected regions where maintenance and security issues can significantly reduce effective capacity.
How Do Military Buildups Amplify Market Risk Premiums?
The escalation of military positioning creates measurable impacts on energy market pricing mechanisms, as traders incorporate probability assessments of potential supply disruptions into commodity valuations. Current deployments demonstrate unprecedented commitment levels from major powers, with dual carrier group positioning and enhanced electronic warfare capabilities indicating preparation for extended operations.
In addition, the Strait of Hormuz threat has intensified significantly, with military analysts closely monitoring force deployments and their implications for regional stability.
Force Structure Deployment Analysis
According to recent market reporting from February 20, 2026, the USS Abraham Lincoln carrier group maintains regional presence while the USS Gerald Ford remains en route, representing significant naval asset commitment. Each carrier typically carries approximately 65 aircraft plus support vessels including guided-missile destroyers and attack submarines, creating substantial maritime security presence.
Regional military exercises have intensified, with Iranian Revolutionary Guard conducting operations in the strait during the week of February 13-20, 2026, while filing notices for planned rocket launches across southern regions. These activities create immediate market uncertainty as traders assess escalation probabilities.
Risk Premium Probability Modelling
Market analysts employ scenario-based modelling to assess potential price impacts across different conflict intensities:
| Scenario Type | Estimated Probability | Oil Price Impact Range | Duration Assessment |
|---|---|---|---|
| Maritime Harassment | 35-40% | +$5-8 per barrel | 2-4 weeks |
| Partial Transit Disruption | 12-18% | +$15-25 per barrel | 1-3 months |
| Full Chokepoint Closure | 3-7% | +$40-60 per barrel | 3-6 months |
| Extended Regional Conflict | 1-3% | +$80-120 per barrel | 6+ months |
These probability assessments reflect current market conditions as of February 2026, with WTI crude trading at $66.15 and Brent at $71.36, representing a 5.70% weekly rally and 20%+ recovery from December 2025 lows.
Critical Timeline Factor: President Trump's stated 10-day decision window creates defined uncertainty periods that compress typical geopolitical risk assessment timeframes, as market participants position for potential military action within shortened decision cycles.
What Are the Multi-Layer Economic Impact Mechanisms?
Energy chokepoint disruptions create cascading effects that propagate through interconnected economic systems via multiple transmission channels. These impacts extend far beyond immediate commodity price movements, affecting manufacturing costs, transportation expenses, and central banking policy responses.
Moreover, the current Strait of Hormuz tension intersects with broader oil market trade dynamics that compound the complexity of price transmission mechanisms throughout the global economy.
Primary Market Transmission Effects
Immediate Energy Market Responses:
- Crude oil price volatility typically ranging 5-15% intraday moves during acute tension periods
- LNG supply contract renegotiations triggering force majeure clauses
- Shipping insurance premium escalations reaching 200-400% above baseline rates
- Alternative routing cost premiums adding $2-4 per barrel for pipeline transport
Maritime Transport Cost Analysis:
- Cape of Good Hope routing adds $1.25-2.25 million per VLCC shipment
- Extended transit times increase by 25-30 days versus strait passage
- Daily tanker rates escalate to $50,000-75,000 during disruption periods
- Annual industry-wide additional cost impact: $11-20 billion
Secondary Economic Propagation
Manufacturing Sector Impacts:
- Petrochemical feedstock cost increases affecting automotive and plastics industries
- Chemical complex operations dependent on strait flows face supply chain disruptions
- Energy-intensive manufacturing experiencing input cost volatility
- Transportation fuel price transmission to logistics and delivery services
Financial Market Responses:
- Currency market instabilities as energy-importing nations face trade balance pressures
- Corporate earnings guidance revisions for energy-dependent sectors
- Inflation expectations adjustments affecting bond market pricing
- Central bank policy response requirements balancing growth and price stability
Tertiary Macroeconomic Consequences
Historical analysis reveals that sustained energy chokepoint disruptions create broader economic realignments. During the 1990-91 Gulf War period, oil prices doubled from approximately $20 to $40+ per barrel, with supply disruptions lasting over six months and contributing to subsequent global recession conditions.
However, recent analysis suggests that potential oil price crash analysis scenarios could emerge if diplomatic solutions prevent sustained disruption, creating equally complex economic adjustment challenges.
Long-term Structural Changes:
- Strategic petroleum reserve utilisation providing 90-180 day maximum coverage
- Industrial energy efficiency investment acceleration
- Alternative fuel infrastructure development prioritisation
- Supply chain resilience capital allocation shifts
How Do Alternative Route Economics Compare Under Stress?
When primary energy transit routes face disruption, the economics of alternative pathways reveal significant cost penalties and capacity constraints that highlight the vulnerability of concentrated infrastructure systems. These alternatives represent not perfect substitutes but costly workarounds that reshape global energy flow patterns.
The critical nature of Strait disruptions becomes apparent when examining the limited capacity and increased costs of alternative routing options available to global energy markets.
Pipeline Bypass Capacity Assessment
Saudi East-West Pipeline System:
- Capacity: 5.0 million barrels per day design capacity
- Current Status: Approximately 60% utilisation under normal conditions
- Geographic Advantage: 745-kilometre span through Saudi territory avoiding maritime chokepoints
- Economic Impact: Transit fees historically $1-2 per barrel plus capital cost amortisation
- Limitations: Serves only Saudi production; cannot accommodate other Gulf state exports
Regional Pipeline Infrastructure:
- Kirkuk-Ceyhan pipeline capacity requires verification given regional instability affecting consistent operations
- BTC (Baku-Tbilisi-Ceyhan) primarily serves Caspian sources, offering limited Gulf oil bypass capability
- Turkish-Kurdish border issues create additional reliability concerns for northern route alternatives
Maritime Route Diversification Analysis
Red Sea Alternative Pathway:
- Capacity: Approximately 2.8 million barrels per day under optimal conditions
- Constraint Factor: Yemen-based maritime security risks create secondary chokepoint vulnerability
- Economic Premium: Additional transit costs and insurance premiums during regional tensions
- Strategic Limitation: Recent Houthi disruption activities demonstrate multiple chokepoint risk concentration
Cape of Good Hope Long-Range Routing:
- Capacity: Theoretically unlimited but time-cost constrained
- Transit Time Penalty: Additional 25-30 days versus strait passage
- Cost Structure: $50,000-75,000 per day VLCC operational costs during extended routing
- Market Impact: $1.25-2.25 million additional cost per shipment
- Annual System Cost: $11-20 billion industry-wide if sustained redirection required
Cost-Benefit Framework for Route Diversification
Economic Trade-off Analysis:
| Route Option | Additional Cost per Barrel | Time Penalty (Days) | Capacity Limitations |
|---|---|---|---|
| Pipeline Bypass | $2-4 | 0 | Severe (producer-specific) |
| Red Sea Maritime | $3-6 | +12-14 | Moderate (security dependent) |
| Suez Canal | $4-8 | +12-14 | Seasonal variations |
| Cape of Good Hope | $8-12 | +25-30 | Time-cost only |
These cost differentials demonstrate why primary chokepoint routes achieve dominance under normal conditions, while revealing the substantial economic penalties imposed when geopolitical tensions force alternative routing. The infrastructure efficiency that creates cost advantages during stable periods simultaneously generates vulnerability during crisis conditions.
What Investment Pattern Shifts Result from Persistent Infrastructure Risk?
Sustained energy chokepoint tensions drive systematic capital allocation changes as market participants adapt to recurring supply chain vulnerability. These investment flows reshape industry structure beyond immediate crisis response, creating lasting shifts in energy infrastructure development priorities.
Consequently, investors must also consider broader market dynamics, including natural gas trends that may provide alternative energy security arrangements during extended petroleum supply disruptions.
Upstream Development Acceleration
Non-Gulf Oil Field Investment:
- Unconventional resource development in North America receives priority funding
- Arctic and deepwater projects gain strategic value despite higher extraction costs
- African and South American reserves attract increased exploration capital
- Canadian oil sands operations benefit from geographic risk diversification premium
Strategic Reserve Expansion:
- National strategic petroleum reserve capacity building
- Commercial inventory holding strategies shift toward longer-term storage
- Floating storage capacity increases during high-volatility periods
- Regional distribution network hardening against supply disruption
Midstream Infrastructure Diversification
Pipeline Development Priorities:
- Alternative route pipeline projects receive accelerated approval processes
- Bidirectional pipeline capability development for flow direction flexibility
- Cross-border pipeline agreements gain strategic importance
- Pipeline maintenance and security enhancement investment increases
LNG Infrastructure Expansion:
- LNG terminal diversification reduces single-source dependency
- Small-scale LNG distribution network development
- LNG storage capacity expansion at import terminals
- Flexible long-term contract structures accommodating supply source changes
Technology Investment Acceleration
Energy Efficiency Technology:
- Industrial energy efficiency equipment demand increases during high price periods
- Transportation fuel efficiency technology investment accelerates
- Renewable energy infrastructure development receives additional policy support
- Energy storage technology development for supply chain resilience
Digital Infrastructure:
- Supply chain monitoring and prediction technology investment
- Alternative routing optimisation software development
- Real-time energy flow tracking and management systems
- Cybersecurity enhancement for critical energy infrastructure
The next major ASX story will hit our subscribers first
How Do Central Banks Navigate Energy Supply Shock Challenges?
Energy chokepoint risks create complex monetary policy dilemmas as central banks balance inflation control objectives against economic growth protection during supply-side price pressures. These challenges require sophisticated policy responses that differ fundamentally from demand-driven inflationary pressures.
Monetary Policy Transmission Complexity
Interest Rate Tool Limitations:
- Supply-side energy shocks demonstrate limited responsiveness to traditional monetary tightening
- Rate increases during energy crisis can amplify economic contraction without addressing underlying supply constraints
- Forward guidance complexity increases during geopolitical uncertainty periods
- International coordination requirements for synchronised policy responses
Inflation Targeting Dilemmas:
- Core versus headline inflation targeting decisions during energy price spikes
- Temporary versus persistent energy price change assessment challenges
- Exchange rate stability considerations during current account deterioration
- Communication strategy complexity when policy tools show limited effectiveness
Financial Stability Considerations
Banking Sector Impacts:
- Energy sector loan portfolio risk assessment during extended price volatility
- Corporate credit quality deterioration in energy-intensive industries
- Commercial real estate impacts in energy-dependent regional economies
- International banking exposure to energy-producing nation sovereign risk
Market Function Preservation:
- Repo market operations during Treasury market volatility
- Corporate bond market liquidity maintenance during credit spread widening
- Currency market intervention considerations during capital flow disruptions
- Quantitative easing programme adjustments amid inflationary pressures
What Long-Term Structural Transformations Emerge from Recurring Chokepoint Risks?
Persistent energy transit vulnerabilities accelerate fundamental changes in global energy architecture, creating lasting shifts that extend far beyond immediate crisis management. These transformations reshape international economic relationships and strategic alliance structures.
Energy Security Architecture Evolution
Supply Diversification Imperatives:
- Geographic risk distribution becomes primary strategic objective
- Technology-driven energy independence investment acceleration
- Bilateral energy partnership agreements replace multilateral dependency
- Emergency response protocol development and regular testing implementation
Market Structure Adaptations:
- Energy contract term modifications incorporating force majeure provisions
- Pricing mechanism adjustments reflecting transportation risk premiums
- Insurance product innovations for chokepoint-specific coverage
- Financial hedging instrument development for geopolitical risk management
International Alliance Realignment
Strategic Partnership Evolution:
- Military cooperation expansion focused on maritime security
- Economic partnership diversification reducing single-source dependency
- Technology sharing agreements for energy infrastructure protection
- Joint strategic reserve coordination among allied nations
Regional Security Architecture:
- Naval cooperation agreements for chokepoint protection
- Intelligence sharing protocols for threat assessment
- Diplomatic coordination mechanisms for crisis prevention
- Economic resilience planning for extended supply disruptions
Market Psychology and Investment Behaviour Changes
Risk Assessment Framework Evolution:
- Geopolitical risk integration into standard investment analysis
- Scenario planning becoming standard practice for energy-dependent sectors
- Insurance coverage expansion for supply chain disruption events
- Corporate strategy adaptation for multiple supply source requirements
Speculative Market Dynamics:
- Energy commodity speculation patterns shift toward longer-term positioning
- Volatility trading strategies adapt to geopolitical event frequency
- Institutional investment allocation changes favouring energy security themes
- Retail investor behaviour modification during recurring crisis cycles
The current Strait of Hormuz tension represents more than a temporary geopolitical crisis. It demonstrates how geographic concentration in critical infrastructure creates systemic vulnerabilities that propagate through interconnected global economic systems. These chokepoint risks reveal the inherent fragility of energy security arrangements built around efficiency optimisation rather than resilience planning.
Successful navigation of these recurring challenges requires integrated risk management approaches combining infrastructure diversification, financial hedging strategies, diplomatic engagement, and technological innovation. The resolution lies not in eliminating geopolitical tensions but in building adaptive systems capable of maintaining functionality despite periodic supply chain disruptions.
Disclaimer: This analysis contains forward-looking assessments and scenario modelling based on current market conditions and geopolitical developments as of February 2026. Energy market predictions involve significant uncertainty, and actual outcomes may differ materially from presented scenarios. Investment decisions should consider comprehensive risk assessment and professional financial advice.
Looking to Capitalise on Energy Market Volatility?
Discovery Alert's proprietary Discovery IQ model delivers real-time alerts on significant ASX mineral discoveries that could benefit from heightened energy security concerns and commodity price volatility. With global energy infrastructure vulnerabilities creating new investment opportunities, subscribers gain immediate access to actionable insights on Australian mining companies positioned to capitalise on these market dynamics through their 14-day free trial.