
July 20, 2026
Global Energy Markets Face Unprecedented Disruption
The interconnected nature of modern energy infrastructure creates cascading vulnerabilities that extend far beyond regional conflicts. When critical chokepoints become compromised, the ripple effects reshape entire economic frameworks and accelerate structural transformations across multiple industries. Understanding these dynamics requires examining both immediate market responses and long-term strategic adaptations that define energy security in an increasingly volatile geopolitical landscape.
When big ASX news breaks, our subscribers know first
Understanding the Scale of Production Collapse
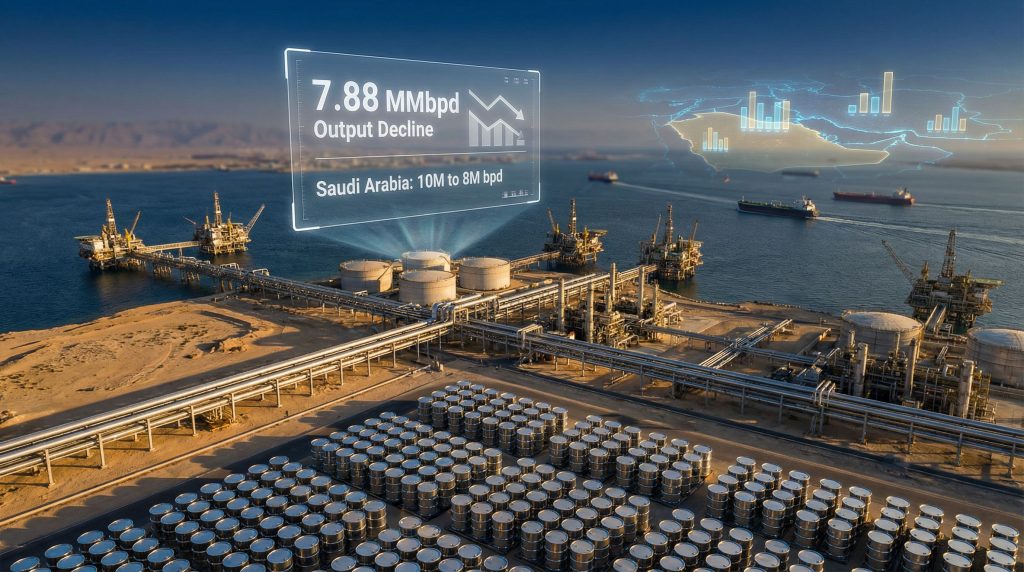
The magnitude of production disruptions in global oil markets has reached historic proportions, with OPEC oil output drop due to Iran war creating an unprecedented supply shock. March 2024 witnessed a staggering 7.88 million barrels per day (MMbpd) decline in OPEC crude production, representing the steepest drop in organizational data spanning back to the 1980s. This collapse reduced total OPEC output to 20.79 MMbpd, fundamentally altering global supply dynamics.
Regional Production Impact Breakdown
The distribution of production losses reveals the concentrated nature of Middle Eastern oil infrastructure vulnerabilities:
- Iraq: Suffered the most severe decline at 2.56 MMbpd reduction to 1.63 MMbpd
- Saudi Arabia: Experienced a 2.31 MMbpd decrease to 7.8 MMbpd
- United Arab Emirates: Production capacity significantly constrained
- Kuwait: Export operations severely limited due to infrastructure access
This production collapse surpasses the 6.28 MMbpd drop recorded during May 2020 when COVID-19 pandemic responses triggered coordinated output reductions. However, the current situation differs fundamentally in its involuntary nature and infrastructure-driven constraints rather than deliberate policy coordination.
Economic Forces Behind Market Volatility
Energy markets demonstrate complex elasticity patterns during geopolitical crises, with price discovery mechanisms operating under extreme stress conditions. The closure of critical transportation infrastructure fundamentally alters supply chain economics, creating bottlenecks that extend far beyond immediate production capacity. Furthermore, these disruptions often trigger oil price rally impacts that extend across multiple sectors.
Price Transmission Mechanisms
When supply constraints reach critical thresholds, traditional price elasticity relationships break down. International oil futures approached $102 per barrel in London markets, reflecting not just physical supply limitations but also risk premium calculations spanning multiple scenario outcomes. These price levels trigger several economic responses:
- Demand destruction begins at sustained prices above $100 per barrel
- Strategic reserve releases become economically justified
- Alternative energy investments accelerate due to improved project economics
- Industrial substitution patterns emerge across energy-intensive sectors
The futures curve exhibits pronounced backwardation patterns during infrastructure disruptions, indicating market expectations for eventual normalization whilst acknowledging near-term scarcity premiums.
Transportation Chokepoint Economics
The Strait of Hormuz represents one of the world's most critical energy transportation arteries, handling approximately 20% of global oil flows under normal conditions. When access becomes restricted, the economic implications extend throughout interconnected supply chains with measurable cost escalations across multiple sectors.
Alternative Routing Constraints
Pipeline infrastructure and alternative shipping routes possess limited surge capacity to accommodate displaced volumes. The economics of substitute transportation methods include:
- Red Sea routing adds 10-15 days transit time and increased shipping costs
- Overland pipeline systems operate at maximum capacity with limited expansion potential
- LNG substitution becomes economically viable but requires infrastructure modifications
- Insurance premiums escalate significantly for vessels operating in affected regions
These constraints create a complex optimisation problem for energy companies balancing cost, security, and reliability considerations in their logistics planning.
Inflationary Pressure Mechanisms
Energy cost inflation transmits through economic systems via multiple pathways, creating both immediate price pressures and longer-term structural adjustments. The relationship between crude oil prices and consumer inflation follows predictable patterns, though the magnitude varies based on energy dependency levels across different economies. Consequently, policymakers must consider tariffs and inflation dynamics when formulating responses.
Sector-Specific Impact Analysis
| Industry Sector | Direct Energy Cost % | Price Pass-Through Rate | Adjustment Timeline |
|---|---|---|---|
| Aviation | 25-35% | 80-90% | 30-60 days |
| Trucking/Logistics | 35-40% | 70-80% | 15-45 days |
| Petrochemicals | 60-70% | 90-95% | 7-30 days |
| Agriculture | 15-20% | 40-60% | 60-120 days |
Manufacturing industries demonstrate varying absorption capacity for energy cost increases, with pass-through rates depending on competitive positioning and contract structures. Agricultural sectors experience delayed but significant impacts through fuel, fertiliser, and transportation cost escalations.
Central Bank Policy Response Frameworks
Monetary policy authorities face complex tradeoffs when energy-driven inflation pressures emerge during supply disruptions. Traditional inflation targeting frameworks require modification when price increases stem from external supply shocks rather than domestic demand pressures.
Policy Tool Effectiveness Assessment
Central banks possess limited direct influence over energy commodity prices, creating strategic challenges for inflation management:
- Interest rate adjustments prove ineffective against supply-driven price increases
- Foreign exchange interventions may provide temporary relief for energy-importing economies
- Fiscal coordination becomes essential for strategic reserve utilisation decisions
- Forward guidance helps anchor inflation expectations during temporary disruptions
The Federal Reserve and European Central Bank have historically maintained accommodative stances during energy supply shocks, recognising the temporary nature of commodity price volatility whilst monitoring second-round effects on core inflation measures.
The next major ASX story will hit our subscribers first
Strategic Reserve Deployment Analysis
Strategic petroleum reserves represent critical policy tools for managing supply disruptions, though their effectiveness depends on coordination mechanisms and release timing. The International Energy Agency coordinates member country responses, though individual nations maintain sovereign decision-making authority over their reserves.
Release Effectiveness Factors
Historical analysis of strategic reserve deployments reveals several key effectiveness determinants:
- Volume coordination across multiple releasing countries amplifies market impact
- Timing precision maximises psychological market effects beyond physical volumes
- Communication strategy influences futures market expectations and volatility
- Replenishment planning affects long-term reserve adequacy
The United States Strategic Petroleum Reserve contains approximately 700 million barrels, whilst IEA member countries collectively maintain reserves equivalent to 90 days of import coverage under normal consumption patterns.
Investment Flow Redirection Patterns
Energy security concerns accelerate capital allocation shifts toward domestic production capacity and alternative energy infrastructure. Investment decision frameworks incorporate higher geopolitical risk premiums, fundamentally altering project economics across the energy sector. However, companies must also navigate energy transition challenges whilst adapting to market volatility.
Renewable Energy Acceleration
Oil price volatility enhances the economic attractiveness of renewable energy projects by:
- Improving relative cost competitiveness of wind and solar installations
- Reducing fuel price risk for electricity generation portfolios
- Attracting climate-focused investment capital seeking energy independence themes
- Enabling government policy support for domestic energy production initiatives
European renewable energy investment has accelerated significantly following repeated energy supply disruptions, with policy frameworks explicitly targeting reduced import dependency.
Infrastructure Recovery Timeline Projections
Production capacity restoration following infrastructure disruptions requires systematic assessment of physical damage, workforce availability, and security conditions. Recovery timelines vary significantly based on facility complexity and geopolitical stability factors. These factors directly influence oil price movements across global markets.
Restoration Sequencing Analysis
| Recovery Phase | Duration | Key Activities | Production % Restored |
|---|---|---|---|
| Emergency Assessment | 2-4 weeks | Damage evaluation, safety clearance | 0% |
| Critical Infrastructure | 8-16 weeks | Essential systems restoration | 25-40% |
| Operational Restart | 16-32 weeks | Workforce return, testing procedures | 60-75% |
| Full Capacity | 32-52 weeks | Complete optimisation, maintenance backlog | 90-100% |
Historical precedent from previous Gulf conflicts suggests 12-18 month timelines for complete production normalisation, though modern infrastructure complexity may extend these periods.
Market Psychology and Investor Sentiment
Energy market psychology exhibits heightened volatility during geopolitical crises, with sentiment indicators often amplifying fundamental supply-demand imbalances. Professional traders and institutional investors demonstrate distinct behavioural patterns under stress conditions that can exacerbate price movements beyond physical market justification.
Behavioural Finance Factors
Several psychological mechanisms influence energy market behaviour during crises:
- Loss aversion drives excessive risk premium calculations
- Herding behaviour amplifies both panic selling and buying waves
- Availability bias overweights recent dramatic events in probability assessments
- Anchoring effects prevent rapid price adjustment to new equilibrium levels
Commodity trading advisors and hedge funds often employ momentum strategies that can destabilise markets during transition periods, though their impact typically moderates as fundamental factors reassert influence.
Long-Term Energy Security Implications
Repeated supply disruptions fundamentally reshape energy policy frameworks across major economies, with strategic planning horizons extending well beyond immediate crisis resolution. Government policy responses increasingly emphasise energy independence and supply diversification as national security priorities.
Policy Recalibration Framework
Energy security policy development incorporates lessons learned from supply disruption experiences:
- Domestic production incentives reduce import dependency ratios
- Critical infrastructure protection receives enhanced investment priority
- International cooperation agreements strengthen emergency response coordination
- Technology development support accelerates alternative energy deployment
These policy shifts create lasting changes in energy investment patterns and industrial competitiveness across different regions.
Economic Scenario Planning Models
Recovery scenario modelling requires sophisticated analysis of multiple interdependent variables affecting production restoration, geopolitical stability, and market adjustment mechanisms. Professional forecasting incorporates probabilistic assessments rather than single-point predictions.
Scenario Framework Assessment
Optimistic Recovery (25% probability): Diplomatic resolution within 6 months enables rapid infrastructure restoration and production normalisation. Oil prices decline to $70-80 per barrel range as supply concerns moderate.
Base Case (50% probability): Extended conflict resolution process requires 12-18 months for complete production recovery. Sustained higher energy prices accelerate alternative energy adoption and demand destruction in price-sensitive sectors.
Pessimistic Outlook (25% probability): Prolonged regional instability extends disruptions beyond 24 months, triggering fundamental restructuring of global energy trade patterns and permanent shifts toward energy independence policies.
These scenarios incorporate both direct production impacts and secondary effects through supply chain adjustments, policy responses, and technological adaptation patterns.
Risk Management Strategies
Professional energy market participants employ sophisticated risk management frameworks to navigate volatility whilst maintaining operational flexibility. These approaches balance downside protection with upside participation across multiple time horizons. In addition, organisations often implement market volatility hedging strategies to manage exposure during uncertain periods.
Institutional Hedging Approaches
Energy companies and large consumers utilise various financial instruments for price risk management:
- Futures contracts provide price certainty for known future requirements
- Options strategies offer asymmetric risk profiles during high volatility periods
- Swap agreements enable basis risk management between different price benchmarks
- Physical storage provides optionality for timing flexibility in volatile markets
Airlines and shipping companies typically hedge 60-80% of their fuel requirements 6-12 months forward, though crisis periods may require dynamic adjustment of hedging ratios based on evolving market conditions. Furthermore, the OPEC crude production data continues to influence strategic planning across the industry.
Disclaimer: This analysis is for educational purposes and does not constitute investment advice. Energy markets involve significant risks, and professional consultation is recommended for investment decisions. Future market developments may differ materially from scenario projections presented.
Ready to Capitalise on Energy Market Disruptions?
Discovery Alert's proprietary Discovery IQ model delivers real-time alerts on significant ASX mineral discoveries, helping investors identify actionable opportunities in energy-related resources during market volatility. Explore how historic mineral discoveries have generated substantial returns and begin your 14-day free trial today to gain a strategic advantage in resource investing.