July 8, 2026
When Price Becomes the Enemy: Understanding the 2026 Global Gas Demand Fall
Energy markets have a long history of confusing cyclical weakness with structural failure. For most of the past century, drops in natural gas consumption have been treated as temporary interruptions, corrected by economic recovery or seasonal rebalancing. The global gas demand fall documented in the International Energy Agency's Q3 2026 Gas Market Report is categorically different, and understanding why requires examining the mechanism driving the contraction rather than simply observing its scale.
The critical distinction is this: demand is not falling because the world needs less gas. It is falling because prices have climbed beyond what power generators and industrial consumers can absorb. That is a supply governance failure, not a demand cycle. Furthermore, when markets destroy demand through unaffordability rather than economic slowdown, the downstream consequences for policy, investment, and energy security are substantially more serious.
When big ASX news breaks, our subscribers know first
The 20 Billion Cubic Metre Problem: Context Behind the Contraction
Global natural gas consumption is forecast to decline by approximately 0.5%, or around 20 billion cubic metres (bcm), in 2026, according to the IEA's third-quarter Gas Market Report. This marks the third annual contraction in global gas demand this decade, following declines recorded in 2020 and 2022. Monitoring natural gas price trends helps contextualise just how far conditions have shifted.
Each of those earlier declines had distinct drivers:
-
The 2020 contraction was demand-led, triggered by the economic paralysis of the COVID-19 pandemic, which reduced industrial output, transport activity, and commercial energy consumption across virtually every major economy simultaneously.
-
The 2022 contraction was shaped by a combination of geopolitical supply disruption following Russia's curtailment of European pipeline flows and the consequent acceleration of fuel switching and efficiency programmes, particularly across the European Union.
-
The 2026 decline is fundamentally supply-shock driven, channelled through price. The mechanism is a military conflict affecting one of the world's most consequential energy transit routes, which has restricted LNG supply and sent benchmark prices to their highest sustained levels since the 2022 European energy crisis.
What makes 2026 structurally significant is that it confirms a pattern: global gas demand has now contracted in three of six years this decade. That frequency is without modern precedent in a market previously characterised by near-continuous consumption growth.
How Geopolitical Conflict Became the Dominant Pricing Variable
The Strait of Hormuz: A Single Corridor, a Systemic Exposure
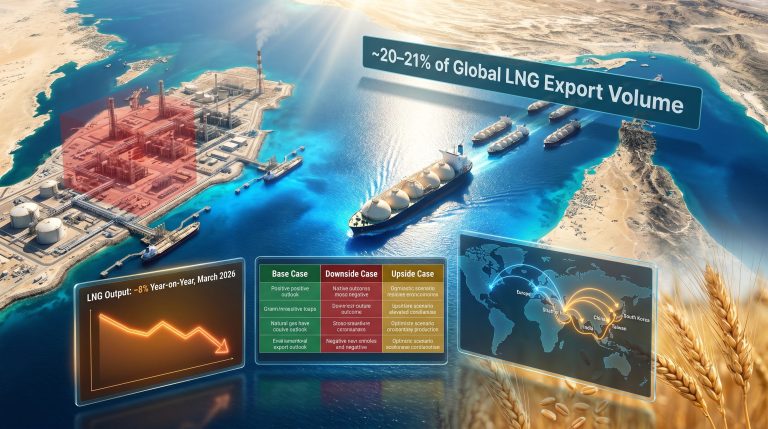
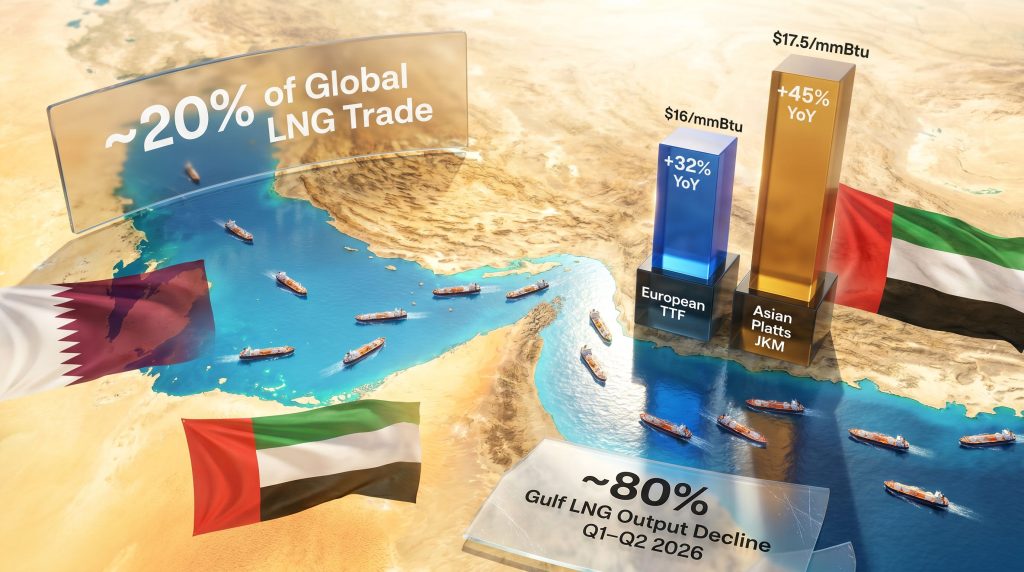
The Strait of Hormuz, a narrow maritime passage connecting the Persian Gulf to the Gulf of Oman, is the transit point for approximately 20% of all globally traded LNG. No other single chokepoint carries a comparable share of the world's liquefied natural gas supply. This concentration of critical energy infrastructure through a single geographic corridor has long been identified by energy security analysts as an underappreciated systemic risk, and geopolitical supply disruptions of this nature have historically reshaped entire market cycles.
The U.S.-Iran conflict that escalated in early 2026 transformed that theoretical risk into an operational reality. As hostilities disrupted shipping operations through the Strait, LNG cargo flows from the Gulf region fell sharply, creating an immediate and severe supply shortfall that alternative producing regions lacked the spare capacity to fully replace.
The Gulf LNG Collapse: An Unprecedented Production Shock
The scale of the supply disruption emanating from the Gulf is difficult to overstate. LNG output from Qatar and the United Arab Emirates, two of the world's most significant LNG exporters, fell by approximately 80% during the March to June 2026 period compared with the equivalent window in 2025.
To place that figure in context: Qatar alone accounts for roughly 20–22% of global LNG export capacity in a typical year. A near-total output collapse from both Qatar and the UAE simultaneously removed a volume of supply from global markets that no combination of alternative producers could realistically offset at short notice. The broader LNG supply outlook for the remainder of the decade has, consequently, been substantially revised.
Comparing Major LNG Supply Disruptions
| Disruption Event | Primary Cause | Estimated Supply Impact | Duration |
|---|---|---|---|
| 2022 Russian pipeline curtailments | Geopolitical conflict | ~55 bcm European supply loss | 12+ months |
| 2020 COVID-19 demand collapse | Demand-side economic shock | ~75 bcm global demand fall | 6–9 months |
| 2026 Strait of Hormuz disruption | Military conflict/transit blockage | ~20% global LNG supply at risk | Ongoing as of Q3 2026 |
| 2012 LNG supply contraction | Production outages | First recorded annual LNG supply decline | Short-term |
The 2026 disruption is distinct in one particularly important respect: unlike the 2022 Russian curtailments, which unfolded over months and allowed some degree of market adaptation, the Gulf LNG collapse occurred rapidly and affected a maritime corridor with no pipeline alternative and no meaningful bypass route.
Benchmark Prices at Multi-Year Highs: What the Numbers Mean
European TTF: A 32% Annual Price Escalation
Europe's Title Transfer Facility benchmark, the primary reference price for European natural gas trading, averaged nearly $16 per million British thermal units (mmBtu) during the second quarter of 2026. That represents a 32% increase compared to Q2 2025 and constitutes the highest quarterly average TTF price recorded since the peak of the 2022 European energy crisis.
For industrial consumers, a 32% year-on-year input cost increase compresses margins and, at sufficient scale, forces output reductions or plant closures. For households in markets where gas remains a primary heating fuel, it raises energy poverty thresholds. Notably, European gas prices were already under pressure before the Gulf disruption added a further layer of volatility.
Asian LNG Spot Markets: An Even Steeper Climb
Asia's Platts Japan Korea Marker (JKM) benchmark averaged $17.5/mmBtu in Q2 2026, a 45% increase year-on-year. Asian buyers face structurally greater exposure to spot price volatility than their European counterparts for one underappreciated reason: European markets retain meaningful pipeline optionality and interconnected storage infrastructure, whereas most Asian LNG importers rely almost entirely on seaborne spot and term cargo deliveries with limited alternative supply routes.
Q2 2026 Price Benchmarks at a Glance
| Benchmark | Q2 2026 Average | Year-on-Year Change | Last Comparable High |
|---|---|---|---|
| European TTF | ~$16/mmBtu | +32% | Q2 2022 |
| Asian Platts JKM | $17.5/mmBtu | +45% | Q2 2022 |
The Coal Re-Entry Paradox and Asian Demand Destruction
Gas demand across Asia fell approximately 1% year-on-year during the first half of 2026, according to IEA data. This contraction reflects active policy responses and market-driven fuel substitution, not a passive withdrawal from consumption.
The primary substitution pathway has been coal re-entry into power generation. When LNG prices at $17.5/mmBtu make gas-fired electricity generation economically unviable for grid operators, coal becomes the least-cost dispatchable alternative in markets where coal capacity remains available. This dynamic, which energy analysts sometimes call the coal re-entry paradox, is particularly acute across Southeast and Northeast Asian power markets.
The coal re-entry paradox describes a scenario where high LNG prices, themselves partly driven by decarbonisation-motivated supply tightening, force power markets back toward coal dependence, thereby undermining the very emissions reduction objectives that justified constraining gas supply investment in the first place.
The policy dilemma this creates for Asian energy regulators is acute, and energy transition pressures are making these trade-offs increasingly difficult to manage:
-
Maintaining gas-fired generation at high spot prices increases electricity costs for consumers and industries, eroding economic competitiveness.
-
Switching to coal preserves near-term affordability but increases carbon emissions and contradicts regional and national climate commitments.
-
Accelerating renewable deployment addresses both constraints over the medium term but cannot resolve immediate supply gaps measured in months rather than years.
Different Asian economies are navigating this trilemma through divergent policy responses, with some prioritising grid stability through coal re-activation, others deploying emergency demand-side management programmes, and a smaller number accelerating FSRU (floating storage and regasification unit) procurement to diversify import optionality.
Could 2026 Deliver the First Annual LNG Supply Decline Since 2012?
The IEA's Q3 2026 report identifies a critical threshold scenario. If the Strait of Hormuz remains partially or fully restricted into the fourth quarter of 2026, global LNG supply could register its first annual decline since 2012, a year when a series of production outages briefly interrupted the market's previously uninterrupted growth trajectory. According to the IEA's Gas Market Report Q2 2026, the global gas demand fall is now firmly linked to this sustained infrastructure vulnerability.
At present, increased production from alternative LNG-exporting regions, including the United States and Australia, is expected to partially offset Gulf losses. However, the capacity constraints facing these producers are real:
-
U.S. LNG export terminals are already operating near nameplate capacity, with meaningful additional liquefaction capacity not expected online until later in the decade.
-
Australian LNG facilities face their own operational constraints and have limited ability to rapidly increase throughput beyond contracted volumes.
-
Geographic arbitrage limitations mean that redirecting Australian or U.S. cargoes to replace Gulf supply involves longer shipping routes and higher freight costs, partially eroding the commercial attractiveness of substitution.
The cumulative LNG supply loss attributable to the Gulf disruption is projected at approximately 120 bcm between 2026 and 2030, representing roughly 15% of anticipated global LNG supply over that period. A sustained deficit of this magnitude would rank among the most consequential medium-term energy supply contractions since the oil shocks of the 1970s.
The next major ASX story will hit our subscribers first
Policy Responses: What Energy Regulators Must Prioritise
Rethinking Supply Chain Concentration Risk
The 2026 crisis has laid bare a structural fragility that energy security frameworks have historically underweighted: the degree to which global LNG trade depends on the uninterrupted operation of a small number of geographic chokepoints and exporting facilities. Effective policy responses include:
-
Mandating supply source diversification requirements within national energy security frameworks, particularly for LNG-dependent economies.
-
Establishing minimum long-term contract coverage thresholds that reduce importing nation exposure to spot market volatility during supply disruptions.
-
Developing multilateral energy security protocols that provide coordinated response mechanisms when major transit corridors are compromised.
Demand-Side Instruments That Reduce Price Vulnerability
The European Union's gas demand reduction frameworks, developed rapidly in response to the 2022 supply crisis, demonstrated that coordinated demand-side management can meaningfully reduce consumption without equivalent economic damage. Elements of that model that are transferable to Asian regulatory environments include:
-
Industrial gas demand caps applied to high-intensity non-essential users during supply stress periods.
-
Strategic storage mandates requiring importing nations to maintain minimum gas inventories as a buffer against geopolitical disruption.
-
Carbon pricing mechanisms that accelerate structural fuel switching away from gas dependency over the medium term, reducing the exposure of power sectors to future LNG price spikes.
Infrastructure Investment Priorities
From an infrastructure perspective, the 2026 disruption strengthens the policy case for several key actions. Furthermore, the Oxford Institute for Energy Studies' analysis of global gas demand outlooks reinforces the urgency of structural reform:
-
Accelerating FSRU deployments in high-risk import markets, given their faster deployment timelines compared to conventional onshore regasification terminals.
-
Diversifying LNG import terminal geography to reduce dependence on single supply corridors.
-
Expanding domestic renewable capacity as a structural hedge against future LNG price shocks, recognising that gas-to-renewables substitution in power generation addresses the root cause of price vulnerability rather than merely managing its symptoms.
Frequently Asked Questions: The Global Gas Demand Fall and the IEA Report
What is driving the global gas demand fall in 2026?
The primary driver is a severe supply shock originating from the disruption of LNG flows through the Strait of Hormuz following the U.S.-Iran conflict. Reduced Gulf LNG availability has driven European and Asian benchmark prices to multi-year highs, which in turn has suppressed demand from power generators and industrial consumers through a combination of fuel switching and output reduction.
How much has global gas demand fallen in 2026?
Global natural gas consumption is forecast to contract by approximately 0.5%, equivalent to around 20 bcm, making 2026 the third year of demand decline this decade.
What is the Strait of Hormuz and why does it matter for gas markets?
The Strait of Hormuz is a narrow maritime passage between the Persian Gulf and the Gulf of Oman. Roughly 20% of all globally traded LNG transits this corridor. Any restriction to shipping through the Strait translates almost immediately into reduced LNG supply availability across both European and Asian markets, with corresponding price consequences.
What are the TTF and JKM benchmarks?
The Title Transfer Facility (TTF) is Europe's principal natural gas trading hub and price benchmark, located in the Netherlands. The Platts Japan Korea Marker (JKM) is the equivalent spot price reference for LNG deliveries into Northeast Asia. Both serve as global reference points for gas contract pricing and market sentiment.
How long could the LNG supply disruption last?
The duration depends primarily on whether the Strait of Hormuz resumes full operational status before Q4 2026 begins. If access is restored in time, global LNG supply for the full year is expected to remain broadly flat relative to 2025. If restrictions persist into Q4, the market faces its first recorded annual LNG supply decline since 2012.
What is the long-term outlook for global gas markets?
Cumulative LNG supply losses from the Gulf disruption are projected at approximately 120 bcm through 2030, representing roughly 15% of expected global LNG supply over that window. Market tightening is expected to persist through 2026 and into 2027, with meaningful supply normalisation contingent on both geopolitical resolution and the acceleration of alternative production capacity.
Key Takeaways
-
A 20 bcm demand contraction in 2026 marks the third annual decline this decade, confirming a structural rather than purely cyclical shift in global gas market dynamics.
-
Price escalation of 32–45% across the TTF and JKM benchmarks reflects supply-side failure rather than demand-driven tightening, a fundamentally different and more concerning market dynamic.
-
Gulf LNG output fell approximately 80% during Q1–Q2 2026, creating a supply gap that alternative producers cannot fully offset given existing infrastructure constraints.
-
A 120 bcm cumulative supply deficit projected through 2030 represents a medium-term constraint with far-reaching consequences for investment, policy, and energy security planning globally.
-
The Strait of Hormuz remains the single most consequential variable in global gas market stabilisation, and its operational status before Q4 2026 will determine whether the market records its first annual LNG supply decline in 14 years.
This article is for informational purposes only and does not constitute financial or investment advice. Projections and forecasts referenced are drawn from IEA reporting and carry inherent uncertainty. Readers should consult independent sources before making any investment or policy decisions. For further context on global LNG market dynamics, the International Energy Agency's official publications are available at iea.org.
Want to Track the ASX Stocks Best Positioned to Benefit From Global Energy Shifts?
Discovery Alert's proprietary Discovery IQ model delivers real-time alerts on significant ASX mineral discoveries — including energy commodities directly exposed to LNG supply disruptions and shifting global demand dynamics — transforming complex market data into actionable investment insights. Explore historic examples of major discovery returns to understand the scale of opportunity these market inflections can create, and begin your 14-day free trial today to position yourself ahead of the broader market.