June 24, 2026
What the 2025 Global Gas Flaring Data Actually Reveals
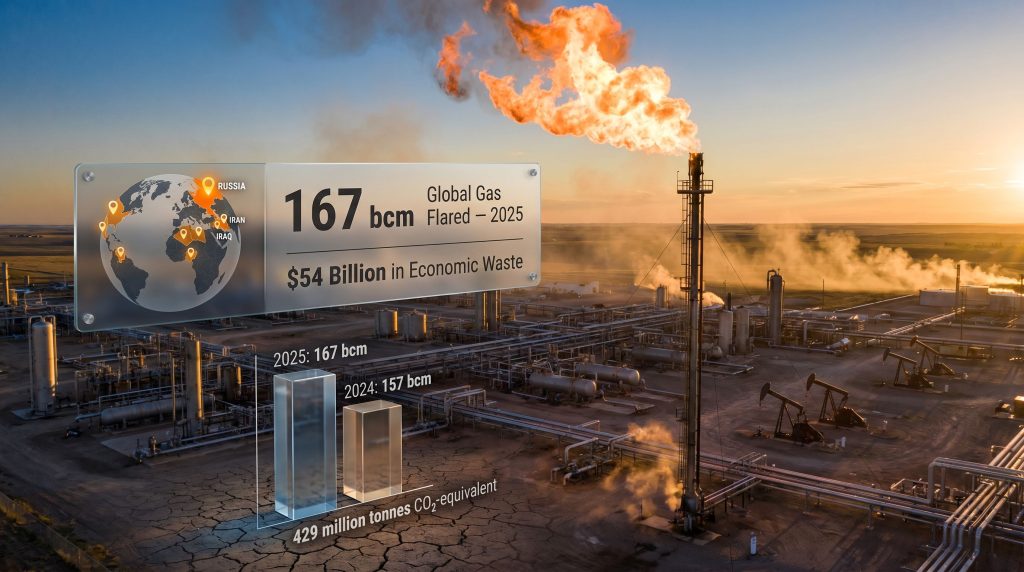
Global gas flaring rises again world bank data confirms, with 167 billion cubic meters (bcm) of gas flared globally in 2025. That figure, drawn from the World Bank's satellite-verified Global Gas Flaring Tracker, represents a 6.4% increase from 157 bcm in 2024 and marks the highest recorded volume since 2019. Voluntary climate frameworks have accumulated an impressive roster of signatories, yet the atmospheric chemistry above oil fields tells a different story.
When commitment platforms lack enforcement teeth, the gap between pledged ambition and operational reality tends to widen with each passing year. That dynamic is now playing out in real time across the global upstream oil sector, where gas flaring volumes have climbed for three consecutive years. This is happening despite the participation of nations representing the majority of total flared gas in a framework explicitly designed to eliminate the practice by 2030.
Understanding why this divergence persists requires examining not just who is flaring more, but the structural economics, infrastructure deficits, and governance architecture that make flaring the path of least resistance for producers operating across wildly different regulatory environments. Furthermore, the natural gas price trends in global markets add another layer of complexity to the already difficult economics of gas capture investment.
To appreciate the scale of what 167 bcm represents: it exceeds the total volume of LNG that transited the Strait of Hormuz in 2025, a waterway whose disruption routinely triggers emergency policy responses at the highest levels of international energy governance. The gas simply burned off at wellheads, invisibly and without consequence for the producers responsible.
The shift from self-reported estimates to satellite-verified data, tracked through the World Bank's Global Gas Flaring Tracker, has been one of the most transformative accountability developments in upstream emissions monitoring. Prior to satellite tracking, flaring volumes were routinely understated in national reporting. Current methodology is not without limitations, however. Incomplete combustion, low-intensity flares, and methane slip events remain difficult to fully capture, meaning published figures likely represent a conservative floor rather than a ceiling.
Key Statistics at a Glance
| Metric | 2024 | 2025 | Change |
|---|---|---|---|
| Total Gas Flared (bcm) | 157 | 167 | +6.4% |
| CO₂-Equivalent Emissions (mn t) | ~400 | ~429 | +7.3% |
| Unburned Methane Emissions (mn t CO₂e) | — | 50 | — |
| Estimated Economic Waste (USD) | — | $54 billion | — |
| Flaring Intensity (m³/barrel) | 5.0 | 5.1 | +2.0% |
Total greenhouse gas emissions attributable to 2025 flaring reached approximately 429 million tonnes of CO₂-equivalent, of which 50 million tonnes derived from unburned methane released through incomplete combustion. Methane's warming potential over a 20-year horizon is approximately 80 times greater than CO₂, making incomplete combustion a disproportionately powerful near-term climate forcing mechanism that headline CO₂ accounting consistently underweights.
When big ASX news breaks, our subscribers know first
Which Countries Are Driving the Global Flaring Surge
Nine nations account for approximately 83% of all gas flared globally while producing roughly half of the world's oil output. The concentration of flaring responsibility within such a small group of producers is a structural feature of the problem, not an anomaly. It also means that targeted policy pressure applied to a handful of jurisdictions holds genuinely leverage potential that broad multilateral frameworks cannot replicate.
Russia, Iran, Iraq, Venezuela, Mexico, Libya, Algeria, Nigeria, and the United States form this group. Three of them were responsible for more than 60% of the total increase recorded in 2025.
Russia
Russia extended its position as the world's largest flaring nation, increasing volumes by approximately 9%, or around 2.5 bcm. The structural barriers are well-documented: ageing gas gathering infrastructure built during the Soviet era, limited commercial incentives to monetise associated gas in domestic markets where prices remain administratively suppressed, and geopolitical isolation that has effectively closed off technology transfer partnerships with Western operators who have made meaningful flaring reductions at comparable assets.
Mexico
Mexico recorded the steepest percentage increase among major flaring nations at 28%, adding approximately 2.1 bcm to global totals. The primary driver is a combination of state-owned operator capacity constraints and chronic underinvestment in associated gas capture and processing infrastructure. The Mexican case illustrates a pattern common across national oil company-dominated upstream sectors: when capital allocation prioritises crude production targets over midstream buildout, associated gas management deteriorates in parallel with rising output.
Iran
Iranian flaring rose by approximately 5%, adding around 1.4 bcm, driven by increased crude production against a backdrop of chronically underdeveloped gas gathering and reinjection infrastructure. Decades of international sanctions have materially limited access to the compression and separation technologies that would make gas capture commercially viable at many Iranian fields. This creates a compounding dynamic: sanctions imposed partly for geopolitical reasons produce an inadvertent climate externality that no current enforcement framework addresses.
The One Country That Moved in the Right Direction: The United States
Against the global trend, U.S. flaring volumes fell by approximately 7%, a reduction of roughly 400 million cubic meters representing the largest single-country improvement recorded in 2025. The mechanism was direct and instructive: the completion of the Matterhorn Express pipeline alleviated a long-standing gas takeaway bottleneck in the Permian Basin, enabling producers to capture and transport associated gas that had previously been flared due to the absence of export capacity.
The U.S. experience in 2025 offers one of the clearest empirical demonstrations in recent history that midstream infrastructure investment, not regulatory mandates alone, delivers the most reliable and measurable flaring reductions at scale.
The Bakken shale basin partially offset Permian gains, where gas production continued to outstrip available pipeline capacity. This dynamic reinforces a recurring pattern: flaring is most persistently concentrated in basins where production growth consistently outpaces infrastructure development, regardless of the regulatory environment.
Is the Zero Routine Flaring by 2030 Target Still Mathematically Achievable?
The World Bank launched the Zero Routine Flaring by 2030 initiative in 2015 as a voluntary commitment platform through which governments and oil companies pledge to eliminate routine flaring. Signatories now represent approximately 60% of total global flaring volumes and have, in aggregate, outperformed non-signatory peers in relative terms since 2012.
The critical caveat is that relative outperformance does not constitute absolute progress. Even signatory nations collectively flared more gas in 2025 than in prior years. With five years remaining until the target deadline and flaring having risen for three consecutive years, the mathematics of the remaining task have become severe.
Eliminating routine flaring by 2030 from current trajectory levels would require a sustained annual reduction rate of approximately 23% per year through to the deadline. No comparable scale of sustained annual reduction has been achieved historically at the global level.
Comparing Voluntary vs. Regulatory Frameworks for Flaring Reduction
| Framework Type | Example | Enforcement | Outcome Reliability |
|---|---|---|---|
| Voluntary pledge (no penalty) | World Bank ZRF | None | Low |
| National regulation with fines | U.S. EPA methane rules | Moderate | Medium |
| Carbon pricing with flaring inclusion | EU ETS (partial) | High | High |
| Infrastructure financing conditionality | World Bank project loans | Conditional | Medium-High |
The initiative's fundamental structural limitation is the absence of binding enforcement mechanisms, financial penalties, or trade-linked compliance triggers. Countries that sign the commitment face no consequence for continued flaring beyond reputational exposure, which has demonstrably proven insufficient to alter operational behaviour at scale.
The Climate and Economic Cost of Continued Flaring
The $54 billion in estimated economic value destroyed through flaring in 2025, calculated using blended U.S., European, and Asian natural gas prices, exceeds the annual GDP of many of the oil-producing nations responsible for the volumes. It also dwarfs the capital investment that would be required to construct gas capture infrastructure at the majority of the facilities responsible.
This creates what might be described as the central paradox of the flaring problem: producers simultaneously destroy valuable energy assets while citing infrastructure financing constraints as the reason reduction is not feasible. The financing gap argument is real in many contexts, but the economic arithmetic consistently suggests that gas capture pays for itself over relatively short timeframes at most large-scale flaring sites.
Considering oil's global economic role, the persistent destruction of associated gas represents a compounding inefficiency that extends beyond emissions and into broader energy security concerns. The gas volumes burned through flaring in 2025 were comparable in scale to total annual LNG volumes transiting the Strait of Hormuz. The policy community applies enormous urgency to the prospect of that waterway being disrupted, yet the equivalent energy volume being permanently destroyed through flaring has not attracted comparable institutional response.
Beyond CO₂, the climate damage compounds in ways that headline figures obscure. The 50 million tonnes of CO₂-equivalent released through unburned methane during incomplete combustion represent a short-term warming agent of exceptional potency. Additionally, flaring in Arctic-adjacent regions generates black carbon soot that deposits on ice and snow surfaces, reducing their reflectivity and accelerating melt in ways that are entirely absent from standard CO₂ accounting frameworks.
How Flaring Intensity Exposes Deteriorating Operational Standards
Absolute volume figures, while striking, can obscure a more troubling trend embedded in flaring intensity data. Flaring intensity, measured as cubic metres of gas flared per barrel of oil produced, rose from 5.0 m³/barrel to 5.1 m³/barrel between the most recent comparable periods, with 2025 data indicating continued deterioration.
Rising intensity means producers are becoming less efficient at capturing associated gas even as production technology has generally improved. It also closes off the argument that higher absolute flaring volumes are simply a function of rising production: intensity metrics adjust for output growth and expose operational regression on its own terms.
How Flaring Intensity Is Calculated and Why It Matters for Policy
- Measure total gas flared at the field or country level using satellite infrared data
- Divide by total oil production in barrels over the same period
- Compare against a baseline year to determine whether operational performance is improving or deteriorating
- Apply intensity thresholds to identify specific facilities or basins where flaring reduction is technically and economically feasible
- Embed intensity benchmarks into financing conditionality, regulatory frameworks, and corporate ESG disclosure requirements to create accountability at the asset level rather than only at the national level
Intensity-based frameworks are increasingly used by multilateral lenders when structuring upstream project finance conditions, because they allow performance assessment that is independent of production volume arguments.
What Policy Interventions Have Proven Most Effective?
The evidence base for flaring reduction now spans multiple decades and jurisdictions. Several intervention types have demonstrated measurable efficacy, though none operates effectively in isolation.
Infrastructure Investment
Pipeline capacity expansion and gas processing facility construction directly remove the most common technical justification for flaring. The Permian Basin case in 2025 confirms that a single midstream project can produce country-scale emissions reductions within a single reporting year.
Regulatory Mandates with Financial Penalties
Jurisdictions with legally enforceable flaring intensity limits and escalating financial penalties have achieved sustained absolute reductions over time. The principal constraint is enforcement capacity: the major flaring nations lack either the institutional capability or the political will to apply such frameworks consistently.
Carbon Pricing Mechanisms
Incorporating flared gas volumes into national carbon pricing schemes creates a direct and continuous financial incentive for capture investment. The limitation is coverage: the majority of global flaring occurs in jurisdictions with no effective carbon price, meaning this mechanism's aggregate impact remains limited despite its theoretical efficacy.
Financing Conditionality
Multilateral development banks and export credit agencies are attaching flaring reduction milestones to upstream project financing with increasing frequency. This approach uses capital access as a behavioural lever without requiring domestic regulatory reform, making it potentially applicable in jurisdictions where enforcement frameworks are weak.
Gas Monetisation Incentives
In Nigeria, Algeria, and Iraq, very large gas volumes are flared in close proximity to domestic energy markets that remain chronically undersupplied. Creating domestic pricing frameworks that make gas capture and distribution commercially attractive simultaneously reduces flaring and improves energy access — a rare double-dividend in climate policy design. In addition, the global LNG supply outlook suggests that captured gas from these regions could meaningfully contribute to global supply if the right infrastructure and incentive structures are established.
The next major ASX story will hit our subscribers first
The Road to 2030: Three Scenarios
| Scenario | Annual Reduction Rate | Key Driver | 2030 Flaring Estimate |
|---|---|---|---|
| Business as Usual | +2 to +6% | No structural change | 185+ bcm |
| Accelerated Infrastructure | -15 to -20% | Targeted midstream investment | ~110 bcm |
| Regulatory and Market Integration | -23%+ | Binding standards + carbon pricing | Near zero routine flaring |
Scenario A: Business as Usual sees flaring continuing to rise along its current trajectory. The ZRF 2030 target would be missed by a margin exceeding 100 bcm, generating cumulative additional emissions of over 400 million tonnes CO₂-equivalent annually through the remainder of the decade.
Scenario B: Accelerated Infrastructure Investment targets midstream pipeline and gas processing buildout in the five highest-flaring nations. Modelled reduction potential reaches 30 to 40 bcm annually within three years, at an estimated capital requirement of approximately $15 to $20 billion — a fraction of the $54 billion in annual economic waste the current trajectory sustains.
Scenario C: Regulatory and Market Integration combines binding flaring intensity standards embedded in national legislation across the top nine flaring nations, carbon pricing mechanisms extended to cover flared gas volumes, and universal multilateral financing conditionality. Under coordinated implementation commencing by 2027, the ZRF 2030 target remains theoretically achievable, though it would require a pace of institutional reform with no clear historical precedent.
Consequently, the broader energy transition demand environment adds pressure to resolve the flaring problem, as policymakers increasingly link upstream emissions performance to wider decarbonisation credibility. The renewable energy transition further underscores why eliminating wasteful fossil fuel combustion like routine flaring remains a foundational step in any credible net-zero pathway.
With global gas flaring rises again world bank data confirming a third consecutive annual increase, the credibility gap between voluntary climate commitments and verifiable outcomes has become impossible to attribute to data limitations or transitional factors. The 2025 results will intensify pressure for binding flaring standards in the lead-up to COP 31 in Antalya, where Turkey's proposed electrification targets and the broader fossil fuel transition roadmap will provide adjacent political contexts for exactly this conversation.
The 2026 to 2028 window is widely regarded as the last viable period during which course correction could make the 2030 deadline mathematically recoverable. Beyond that point, the annual reduction rate required becomes so steep as to exceed any precedent in the sector's history. Framing flaring reduction as simultaneously a climate obligation, an energy security imperative, and an economic efficiency priority — rather than purely an environmental compliance issue — remains the most promising avenue for building the cross-constituency political coalition that binding enforcement would require. The World Bank's gas flaring reduction programme continues to provide the primary institutional framework through which such a coalition might be coordinated, though its voluntary architecture will need fundamental reform if the 2030 target is to retain any practical meaning.
This article contains forward-looking analysis including scenario modelling and policy projections. These represent analytical frameworks based on publicly available data and should not be interpreted as definitive forecasts. Readers are encouraged to consult primary sources including the World Bank's Global Gas Flaring Tracker and Argus Media's ongoing upstream oil and gas market coverage for the most current data.
Want to Stay Ahead of the Next Major ASX Resource Discovery?
While global energy markets grapple with structural inefficiencies like routine gas flaring, Discovery Alert's proprietary Discovery IQ model scans ASX announcements in real time, instantly alerting subscribers to significant mineral discoveries across more than 30 commodities — explore historic discoveries and their returns to see what's possible, then begin your 14-day free trial at Discovery Alert to position yourself ahead of the broader market.