
June 26, 2026
The Inventory Clock That Diplomacy Cannot Stop
Energy markets have a long history of pricing in outcomes that physical supply chains take months or years to deliver. From the post-Gulf War oil recovery of the early 1990s to the European natural gas crisis of 2022, financial markets consistently re-rate before the underlying infrastructure has confirmed the narrative. The pattern playing out across global oil markets in mid-2026 is a near-perfect replica of this dynamic, and the consequences of misjudging the timeline could be severe for traders, refiners, and oil-importing economies alike.
The central tension is straightforward: futures markets are behaving as though a peace deal automatically unlocks Persian Gulf oil supply, while the physical market is telling an entirely different story. Global oil inventories and Strait of Hormuz recovery are not progressing in tandem, and inventories are approaching structural thresholds that have not been tested in more than two decades. Furthermore, the multi-stage recovery sequence required to replenish them cannot be compressed by diplomatic announcements alone.
When big ASX news breaks, our subscribers know first
How Depleted Are Global Oil Inventories Right Now?
OECD Stockpiles Approaching Generational Lows
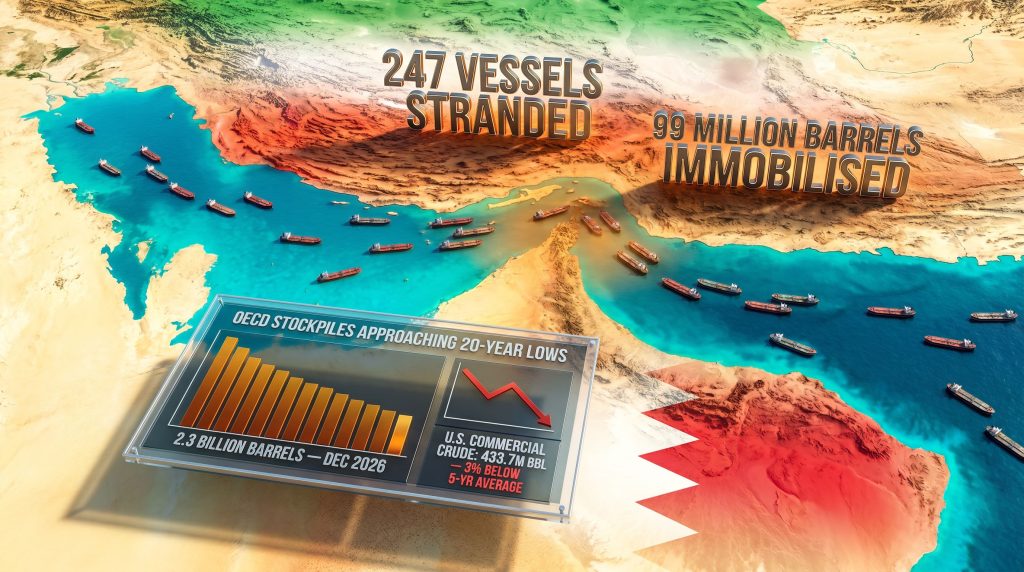
The scale of the inventory deterioration now visible in global oil markets is difficult to overstate. According to projections from the U.S. Energy Information Administration, OECD oil stockpiles are on track to fall to their lowest point since 2003, declining to just under 2.3 billion barrels by December 2026. Critically, this is not a demand-driven decline. It reflects sustained supply-side disruption concentrated in the Persian Gulf corridor, where the Strait of Hormuz crisis severed the arterial flow of crude to global markets for an extended period.
Goldman Sachs analysts have taken the projection further, modelling a scenario in which global visible inventories reach their lowest-ever recorded level, anchored by an estimated supply shortfall running at approximately 11 million barrels per day. That figure represents not just a short-term disruption but a structural hole in global supply that took months to accumulate and will require a similarly extended period to fill. For a broader crude market overview, the comparison to prior disruption cycles is instructive.
U.S. Commercial Crude: Nine Weeks of Consecutive Drawdown
The domestic U.S. picture sharpens the global trend into something more immediately measurable. Data from the American Petroleum Institute shows that U.S. commercial crude inventories recorded a cumulative reduction of 52 million barrels across nine consecutive weeks. A single-week draw of 8.0 million barrels brought total U.S. commercial stocks to 433.7 million barrels, a level sitting 3% below the five-year seasonal average.
The situation at Cushing, Oklahoma, the designated delivery point for WTI futures contracts and the operational heartbeat of U.S. crude pricing, is particularly instructive. Stocks at Cushing have declined to approximately 21 million barrels, and industry analysis has identified 20 million barrels as the operational floor below which tank operators begin encountering meaningful logistical complications. These are not theoretical thresholds.
When storage infrastructure approaches minimum working levels, the ability to blend, buffer, and move crude through the pipeline system becomes constrained, and physical prices begin to decouple from benchmark futures in ways that can be sudden and disorderly. Consequently, understanding the full range of oil logistics risks has become essential for anyone operating in physical crude markets.
Exxon's senior vice president Neil Chapman framed the situation in unusually direct terms in early June, describing current inventory conditions as approaching levels that are genuinely unprecedented in the modern era of oil markets. His assessment — that once minimum operational thresholds are breached prices will respond sharply and swiftly — carries particular weight given that major integrated oil companies have direct visibility into both physical supply availability and downstream demand that futures market participants simply do not possess.
The Strategic Petroleum Reserve: A Weakened Backstop
The U.S. Strategic Petroleum Reserve, which exists precisely to absorb disruptions of this magnitude, is no longer in a position to serve that function effectively. Approximately 180 million barrels were released from the SPR during the 2022 energy price crisis triggered by Western sanctions on Russian oil exports, and that capacity has not been fully restored. The SPR now competes directly with commercial buyers in a market where physical crude is scarce, rather than acting as a countercyclical buffer.
This is not a uniquely American problem. Multiple oil-importing nations drew on strategic reserves during the Hormuz crisis, meaning that once supply normalises, a coordinated wave of restocking demand will materialise simultaneously across multiple economies. That restocking overhang represents a form of deferred demand that is invisible in current futures pricing but will have a very real impact on price dynamics once the recovery cycle begins.
What Is the True State of Strait of Hormuz Recovery?
A Reopening in Name Only
The Strait of Hormuz has attracted enormous media attention as ceasefire negotiations advanced, but transit metrics reveal the gap between announcement and operational reality. While vessel crossings recovered from approximately 10 per day at the height of hostilities to 71 confirmed transits over a single weekend, that figure still falls well short of the pre-war benchmark of roughly 120 daily crossings. The strait is technically more open than it was at peak crisis, but it is not functioning normally by any operational definition.
Analysts at Energy Aspects noted at the start of June that even a formally signed peace agreement would not produce an immediate return to pre-war tanker traffic levels. The world has been consuming oil from inventories during the disruption period, and the logistics chain required to shift back to normal production-driven supply involves far more steps than market participants appear to be pricing in. According to the Brookings Institution's analysis of the Hormuz chokepoint, the structural vulnerabilities exposed by this crisis have long been a concern for global energy security planners.
The Five-Stage Recovery Sequence
This is perhaps the most underappreciated structural reality of the current situation. Restoring Persian Gulf oil flows to pre-crisis levels is not a single event. It is a sequential process in which each stage depends on the completion of the one before it.
| Recovery Stage | Key Dependency | Estimated Timeline |
|---|---|---|
| 1. Insurance reinstatement | Ceasefire verification and independent risk reassessment | Weeks to months |
| 2. Tanker re-entry into Hormuz waters | Insurance coverage plus safety clearance | Follows insurance |
| 3. Upstream production restart | Vessel availability and port clearance | Weeks after tanker re-entry |
| 4. Refinery recommissioning | Crude supply restoration and infrastructure integrity checks | Weeks to months |
| 5. Full inventory replenishment | All prior stages complete | Potentially into 2027 |
Insurance reinstatement is the binding constraint that most commentary overlooks entirely. Vortexa senior market analyst Xavier Tang outlined the sequence precisely, noting that tanker transits will increase only after insurers are willing to cover vessels, followed by production restarts, and then refinery recommissioning. The entire sequence is contingent on the first step, and insurers have made clear they are not moving on the basis of political announcements alone. They require verified, sustained ceasefire conditions before reassessing war risk premiums.
The global head of shipping research at Oil Brokerage Ltd., Anoop Singh, reinforced this point publicly, indicating that major shipowners were not changing their operational posture based on ceasefire reports alone, and that the specific terms and text of any agreement needed to be fully understood before the industry could act.
Stranded Vessels, Trapped Crude, and a Backlog Markets Are Ignoring
As of early June 2026, more than 247 vessels, including fully laden crude tankers, remained stranded within Hormuz waters. Approximately 99 million barrels of crude oil were immobilised aboard these vessels, creating a situation where Gulf producers cannot restart upstream extraction until the backlog clears and loading infrastructure is freed.
Iraqi onshore crude stocks declined by an estimated 4 million barrels since mid-April as operators drew from storage to load available cargoes while production remained suspended. Physical damage to oil infrastructure across Iraq and Kuwait is expected to push full production restoration into 2027 under most analytical scenarios.
Even under an optimistic recovery pathway, analysts estimate that only 85% of lost oil volumes could be restored by October 2026. Long-term traffic normalisation through the strait may plateau at just 60 to 70% of pre-war crossing levels due to persistent safety concerns, residual mine clearance requirements, and fundamental shifts in how shipping operators assess Hormuz transit risk on an ongoing basis. The EIA's detailed assessment of world oil transit chokepoints underscores why this corridor remains so central to global supply stability.
Why Are Futures Markets Pricing in Recovery That the Physical Market Has Not Delivered?
The Dual-Market Divergence
One of the more analytically interesting features of the current situation is the simultaneous operation of two oil markets with contradictory price signals. Brent crude has declined toward and below $80 per barrel as futures traders respond to ceasefire optimism, pricing in a rapid normalisation that physical supply chains cannot currently support. Meanwhile, actual crude prices for immediate delivery have traded at significant premiums to benchmark futures, reflecting genuine scarcity and the competition among refinery operators and national oil companies for available spot cargoes.
This divergence mirrors patterns observed during previous geopolitical disruptions where futures markets re-rated before physical supply chains recovered. The 2022 European gas crisis provided a comparable template, with financial markets pricing in normalisation months before actual supply flows confirmed it.
However, the trade war oil impact adds an additional layer of complexity, as tariff-driven demand uncertainty interacts with the supply-side disruption in ways that conventional price models struggle to capture simultaneously.
Three structural factors drive this disconnect:
-
Information asymmetry: Futures traders respond to headline developments in diplomatic negotiations. Physical crude buyers respond to cargo availability, and those two information sets are not the same thing at this point in the recovery cycle.
-
Time horizon mismatch: Futures contracts price expectations weeks or months forward. Physical buyers need crude today, and today the supply is constrained regardless of what a peace agreement says.
-
Insurance and logistics opacity: The timeline for tanker operators to re-enter Hormuz waters is determined by insurance market dynamics that are not publicly visible in futures pricing models, creating a systematic blind spot in forward price discovery.
Chevron's CEO Mike Wirth captured the physical market's trajectory in early June, noting that supply pressures were expected to transmit more directly into physical prices over the following weeks, with further upward pressure anticipated through June and into July. That warning was directed at the physical market reality, not at the futures curve that was simultaneously moving in the opposite direction.
How Long Will It Take for Global Oil Inventories to Rebuild?
Three Recovery Pathways
The range of plausible outcomes for global oil inventories and Strait of Hormuz recovery is wide, and the difference between scenarios has material price implications across a multi-year horizon.
| Scenario | Hormuz Recovery Pace | Inventory Rebuild Completion | Price Trajectory |
|---|---|---|---|
| Optimistic | 85% flow restoration by October 2026 | Mid-2027 | Elevated through Q1 2027, then easing |
| Base Case | Gradual recovery through late 2026 | Late 2027 | Persistently high through 2026 |
| Pessimistic | Traffic stabilises at 60-70% of pre-war levels | 2028 or beyond | Structurally elevated for two or more years |
The Restocking Demand Overhang
A dynamic that receives insufficient attention in most market commentary is what happens to demand when supply finally normalises. Nations that drew down strategic and commercial reserves during the crisis will attempt to rebuild those buffers simultaneously, creating a period where purchasing activity substantially exceeds actual consumption needs.
Historical precedent from previous major supply disruptions suggests that restocking cycles can add 5 to 15% to effective demand for periods of six to eighteen months following the resolution of a crisis. This means that even as production recovers and Hormuz transit volumes increase, the demand side of the equation will be amplified by restocking activity, potentially keeping prices elevated well past the point at which the physical supply shortfall is technically resolved.
Some economic modelling indicates that sustained oil prices around $70 per barrel could support approximately 7% GDP growth in major oil-importing economies such as India. However, the combination of depleted global oil inventories and incomplete Strait of Hormuz recovery makes a sustained return to sub-$75 pricing structurally implausible in the near term. The IEA has projected a potential large oil surplus in 2027, but that projection is conditioned entirely on Middle East supply returning fully and on schedule, a scenario that current physical market evidence does not support.
Knock-On Effects Beyond Crude Oil Prices
Tanker Markets and Downstream Ripple Effects
The dislocation in tanker markets has been extreme. Very Large Crude Carrier earnings reached approximately $470,000 per day during peak Hormuz crisis conditions, a figure that reflects both genuine scarcity of available tonnage and the war risk premium demanded by operators willing to navigate contested waters. Middle East fuel oil exports are tracking toward a four-month high, suggesting some normalisation at the margins, but not at a scale sufficient to relieve the broader inventory deficit.
Downstream markets have experienced their own divergences. U.S. airlines are estimated to capture approximately $40 billion in aggregate savings as jet fuel prices retreat from crisis peaks. Gasoline and heating oil futures, however, remain elevated, reflecting the lag between upstream supply normalisation and downstream price relief. European economies continue absorbing the residual energy price shock from the crisis period, with the European Central Bank explicitly noting that even a completed Iran peace agreement will not reverse the accumulated inflationary damage from months of elevated energy costs.
Geopolitical Wildcards That Could Reshape the Timeline
Several parallel developments have the potential to significantly alter the recovery trajectory in either direction:
-
Iran's frozen assets: Reports indicate the U.S. may unblock approximately $12 billion in frozen Iranian funds, a development that could accelerate diplomatic normalisation but does not directly restore oil production infrastructure or resolve the insurance and logistics bottlenecks.
-
Iraq's OPEC posture: Iraq has reportedly been exploring the possibility of exiting OPEC to pursue independent production increases. In addition, OPEC market influence over production ceilings means any unilateral Iraqi expansion could trigger broader alliance tensions and further complicate the supply recovery timeline.
-
Russia's compounding disruptions: A major Moscow refinery is projected to remain offline until 2027, and Russia is simultaneously considering a complete ban on diesel exports. These developments add a separate, independent layer of global refined product tightness that operates entirely outside the Hormuz recovery timeline.
-
China's teapot refinery contraction: China's independent refinery sector has cut operations to levels not seen since 2017, which has partially offset global demand pressure but also signals broader economic fragility in the world's largest crude importer.
The next major ASX story will hit our subscribers first
FAQ: Global Oil Inventories and Strait of Hormuz Recovery
What level do U.S. crude inventories need to reach before prices spike sharply?
Industry analysts have identified approximately 20 million barrels at Cushing as the critical operational threshold, below which storage infrastructure faces functional constraints and physical prices can disconnect sharply from futures benchmarks.
How quickly can the Strait of Hormuz return to full operational capacity?
Full restoration requires sequential completion of insurance reinstatement, tanker re-entry, upstream production restart, and refinery recommissioning. Under the most optimistic modelling, 85% of lost volumes could recover by October 2026, with full restoration potentially extending into 2027.
Why are oil futures falling while physical crude remains tight?
Futures markets are pricing geopolitical optimism following ceasefire developments, while physical markets reflect depleted inventories, stranded vessels, and the multi-stage logistics required to restore normal supply flows. This is a known and recurring feature of post-disruption oil market dynamics, one that has also shaped the recent oil price rally driven by tariff and supply uncertainty.
What happens to demand when restocking begins?
When supply normalises, oil-importing nations will simultaneously attempt to rebuild strategic and commercial reserves, creating a restocking overhang that can add 5 to 15% to effective demand for an extended period and potentially sustain elevated prices even as production recovers.
Could the Strait of Hormuz permanently lose traffic volume?
Analysis suggests that long-term traffic may stabilise at 60 to 70% of pre-war levels due to persistent safety concerns, mine clearance timelines, and structural changes to how shipping operators price Hormuz transit risk on an ongoing basis.
What the Market Is Getting Wrong
The oil market is not navigating a simple geopolitical risk premium that dissolves when a peace agreement is signed. It is confronting a structural inventory deficit that accumulated over months of disrupted Persian Gulf supply, and that deficit will require an equally extended period to resolve regardless of the diplomatic outcome.
The physical market operates on a multi-stage recovery sequence that cannot be compressed by political agreements. Diplomatic announcements address the cause of the disruption. They do not repair infrastructure, reinstate insurance, unblock stranded tankers, restart upstream production, or refill depleted storage caverns.
The key conclusions for energy market participants are these:
-
Global oil inventories and Strait of Hormuz recovery are deeply intertwined, with OECD stockpiles projected to reach their weakest position since 2003 by end-2026, underpinned by a supply shortfall estimated at 11 million barrels per day.
-
The futures-physical market divergence creates both risk and opportunity. Bearish futures positioning may prove premature if physical supply constraints persist longer than the consensus recovery narrative implies.
-
Infrastructure damage, mine clearance, and insurance reinstatement are the binding constraints that financial markets are systematically underweighting in current price formation.
-
Restocking demand will amplify price pressure once the recovery cycle begins, potentially extending elevated pricing well beyond the point at which the Strait of Hormuz technically reopens to normal traffic.
-
Parallel disruptions in Russia's refining sector add an independent layer of refined product tightness that compounds the Persian Gulf recovery challenge and is not fully reflected in current benchmark prices.
This article is intended for informational purposes only and does not constitute financial or investment advice. Energy market forecasts, scenario projections, and price estimates carry inherent uncertainty and should not be relied upon as the basis for investment decisions. Past market dynamics may not reliably predict future outcomes.
Want to Stay Ahead of the Next Major Resource Discovery While Energy Markets Shift?
While oil market dynamics and supply chain disruptions reshape the investment landscape, significant mineral discovery opportunities continue to emerge on the ASX — and Discovery Alert's proprietary Discovery IQ model delivers real-time alerts the moment they are announced, turning complex data across more than 30 commodities into clear, actionable insights. Explore how historic discoveries have generated substantial returns on Discovery Alert's dedicated discoveries page, and begin your 14-day free trial today to position yourself ahead of the broader market.