July 7, 2026
When the World's Oil Buffer Runs Dry: Understanding the Depth of the 2026 Supply Crisis
Energy markets have spent decades wrestling with the question of concentration risk. The global oil system was never truly diversified — it was always one serious disruption away from a buffer crisis. As crude oil market trends have long indicated, what distinguishes the current situation from every prior supply shock is not simply the scale of lost production, but the simultaneous compression of the two mechanisms designed to absorb exactly this kind of event: physical supply from Gulf producers, and the strategic reserves held to backstop it. Both are being drained at the same time, and the arithmetic of that reality is severe.
When big ASX news breaks, our subscribers know first
How Severe Is the Global Oil Inventory Drawdown in 2026?
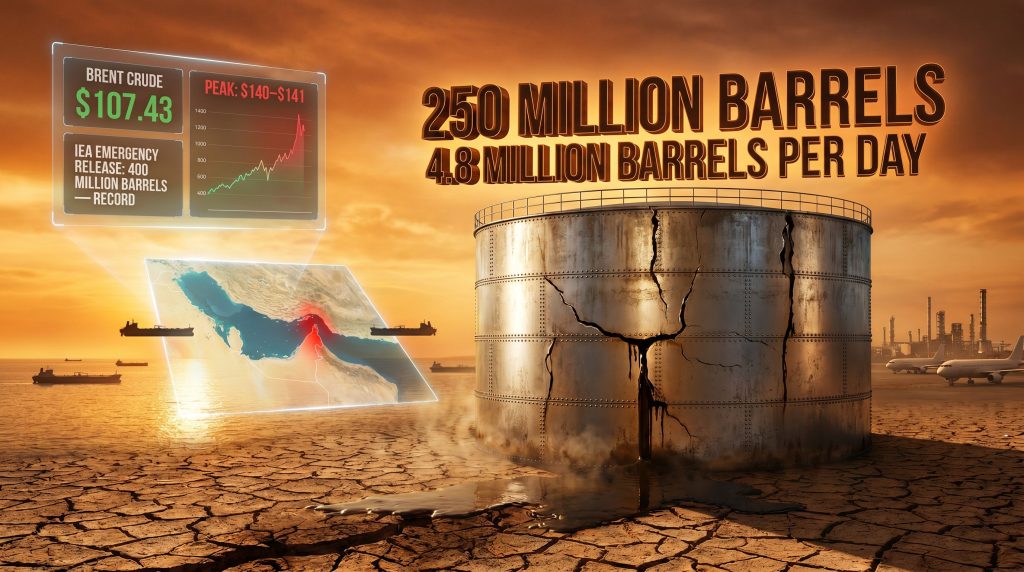
The International Energy Agency's May 2026 oil market report confirmed what traders had feared for weeks. Global oil stockpiles plunge as Iran war chokes supply has become one of the defining economic narratives of the year, and the data behind that statement is striking. Observed global inventories, including oil held on tankers at sea, fell by approximately 250 million barrels across March and April 2026 combined.
The average daily drawdown rate across those two months was 4 million barrels per day. Between March 1 and April 25, Fortune data pointed to a slightly faster pace of 4.8 million barrels per day. To place that in context, the combined daily oil consumption of the entire European Union is roughly 12 to 13 million barrels. The world burned through its backup supply at a rate equivalent to one-third of European daily demand, every single day, for nearly two months.
The Scale of Depletion: Numbers That Define a Crisis
| Metric | Figure |
|---|---|
| Global inventory drawdown (March-April 2026) | 250 million barrels |
| Average daily drawdown rate (March-April) | 4 million barrels per day |
| Daily drawdown rate (March 1 to April 25) | 4.8 million barrels per day |
| Cumulative supply losses from Gulf producers | Exceeds 1 billion barrels |
| Volume of oil currently shut in | More than 14 million barrels per day |
| Global oil supply in April 2026 | 95.1 million barrels per day |
| Total supply losses since February 2026 | 12.8 million barrels per day |
| Global oil supply decline in April alone | 1.8 million barrels per day |
| Emergency reserves pledged by IEA member nations | 400 million barrels (record release) |
| Visible global oil stocks | Near lowest levels since 2018 |
Critical Context: A drawdown rate of 4 to 4.8 million barrels per day is not a market fluctuation. It is a structural depletion of the global oil buffer at a speed with no modern precedent. Emergency reserve releases are absorbing part of the shock but are masking the true scale of the underlying supply deficit.
According to a detailed analysis by oilprice.com, what makes this episode genuinely different from prior disruptions is the combination of pressures acting simultaneously. Historical supply shocks — the 1973 OPEC embargo, the Gulf War of 1990 to 1991, or the COVID demand collapse of 2020 — each compressed one side of the oil market equation at a time. The 1973 embargo hit supply but left reserves largely intact. The 2020 crash destroyed demand but left supply infrastructure unaffected.
The current crisis compresses both the supply side through blocked exports and the buffer side through record strategic reserve drawdowns, at the same time. The IEA has described this as an unprecedented supply shock, language the organisation deploys with considerable restraint.
What Is the Strait of Hormuz and Why Its Closure Changes Everything
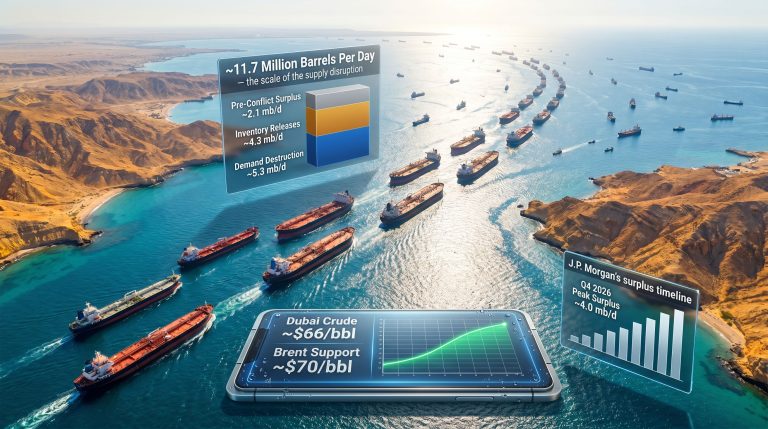
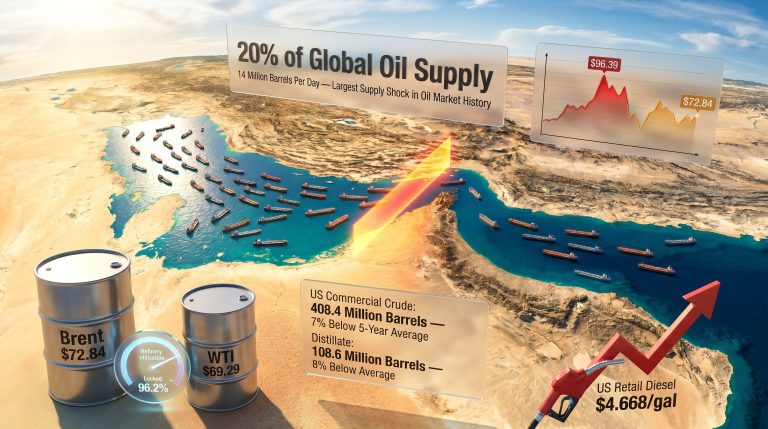
The Strait of Hormuz is a narrow maritime corridor connecting the Persian Gulf to the Gulf of Oman. At its narrowest point it measures approximately 33 kilometres wide, yet under normal operating conditions it carries roughly one-fifth of all seaborne crude oil traded globally. No other single geographic chokepoint carries a comparable share of world energy supply.
When traffic through Hormuz is restricted, the effect is not regional. It is systemic. Buyers in Asia, Europe, and the Americas who depend on Gulf crude must compete for a sharply reduced pool of available oil, regardless of their proximity to the conflict.
How Restricted Tanker Traffic Reshapes Global Supply Chains
- More than 14 million barrels per day of Gulf production is effectively shut in due to restricted tanker movement
- A fragile ceasefire has not materially restored commercial tanker traffic, leaving exporters unable to move product even where onshore production continues
- Alternative routing options, such as diverting tankers around Africa's Cape of Good Hope, add approximately two to four weeks to delivery timelines and significantly increase freight costs
- Shipping insurance premiums for Gulf-origin voyages have escalated sharply, adding a further cost layer that ripples through to refined product prices
- Three supertankers carrying a combined 6 million barrels were among the limited vessels that managed to exit the strait in late April, underscoring just how constrained traffic has become
A less widely understood dimension of the Hormuz crisis is what happens to oil that cannot be exported. Iran's floating oil stockpile, crude held on tankers offshore rather than delivered to buyers, reportedly jumped by approximately 65% as a US naval blockade restricted outbound movement. This oil exists but is functionally inaccessible to global markets, creating a paradox where production continues but supply does not reach consumers.
Which Sectors Are Being Hit Hardest
The IEA identified the petrochemical and aviation sectors as the most severely affected industries, but the transmission of the oil shock runs across virtually every energy-intensive part of the global economy.
Sector-by-Sector Impact Assessment
Petrochemicals
- Feedstock availability is becoming critically constrained, disrupting plastics, fertiliser, and chemical production chains globally
- Refinery crude throughputs have fallen by an estimated 4.5 million barrels per day in the second quarter of 2026 alone
- This is not simply a price problem. Physical feedstock shortages are beginning to curtail production volumes, not just margins
Aviation
- Jet fuel stocks in Europe are approaching critically low thresholds ahead of the peak summer travel season
- Aviation activity is running well below normal seasonal levels globally
- Indian airlines formally requested that domestic refiners delay scheduled jet fuel price increases, reflecting the acute pressure on carriers already operating with compressed margins
- Australia has turned to China for emergency jet fuel supplies, a geopolitically unusual arrangement that reflects the depth of the supply problem in Asia-Pacific
Retail Fuel and Consumer Transport
- Brent Crude peaked at approximately $140 to $141 per barrel for physical delivery at the height of tensions in April 2026
- China raised domestic fuel price caps multiple times in rapid succession in response to surging import costs
- India implemented fuel price increases twice within a single week, with the country's Prime Minister reportedly ordering a 50% reduction in official motorcade sizes as a demand-saving signal
- Brent was trading at approximately $107.43 at the time of the IEA's May report, well above pre-conflict levels but meaningfully below the April peak
Industrial and Manufacturing
- Energy-intensive industries face compounding input cost pressures as both crude and refined product prices remain elevated across all contract tenors
- The IEA acknowledged that demand-saving measures and economic softening are beginning to suppress industrial fuel consumption, though this demand destruction process takes time to materialise at scale
Regional Responses: How Different Markets Are Managing the Shock
A Regional Breakdown of Supply Stress
United States
- US crude inventories are falling rapidly, though they remain marginally elevated year-on-year due to a buildup earlier in 2026
- Americas supply growth expectations have been revised upward by more than 600,000 barrels per day since the start of 2026, now projected at an average of 1.5 million barrels per day for the full year
- US authorities temporarily waived sanctions on Russian oil in transit, enabling additional crude volumes to reach international markets
Europe
- Jet fuel stocks are approaching critically low seasonal levels ahead of the summer travel peak
- The UK introduced new tax measures in response to intensifying energy security concerns, while also selectively easing some Russian oil sanctions as domestic fuel prices surged
- Equinor and Eneco signed a new long-term gas supply agreement, reflecting accelerated efforts to reduce energy vulnerability through contractual security rather than spot market exposure
Asia-Pacific
- Japan's crude imports from the Middle East fell to their lowest level on record, an extraordinary data point for a country that has depended on Gulf crude for decades
- Japan and South Korea deepened bilateral energy cooperation arrangements in direct response to the Hormuz crisis
- India's strategic petroleum reserves cover only a limited number of days of national demand, creating acute near-term vulnerability. The country is exploring direct Gulf oil loading arrangements designed to bypass Hormuz restrictions where feasible
- China boosted domestic stockpiles despite a significant plunge in import volumes, a strategically rational response that partly explains the disconnect between import data and domestic fuel availability
Middle East Non-Conflict Producers
- Saudi Arabia's crude export revenues reached a 3.5-year high in March 2026 as prices surged, even as JODI data confirmed that actual Saudi crude export volumes sank to record lows. This apparent paradox is resolved by the mathematics of high prices more than offsetting lower volumes in revenue terms
- Saudi Arabia simultaneously began importing fuel oil to compensate for declining domestic gas output, a notable vulnerability for a country that is nominally one of the world's largest energy producers
- Nigeria set a target to increase output by 100,000 barrels per day to capitalise on the supply gap, while the UAE's exit from OPEC rattled the organisation's cohesion and created new market dynamics that remain unresolved
Russia
- Repeated strikes on Russian refinery infrastructure have had a paradoxical effect: by reducing domestic refined fuel consumption, they have redirected unprocessed crude toward export markets, increasing Russian crude export volumes at a time when Gulf supply is constrained
What OPEC and IEA Forecasts Reveal About Where Markets Are Heading
The two most influential energy forecasting bodies in the world are telling meaningfully different stories about the trajectory of oil demand, and the divergence carries important implications for price outlook. Furthermore, OPEC's market influence over production decisions continues to shape how quickly alternative supply can realistically come online.
| Forecast Metric | IEA Position | OPEC Position |
|---|---|---|
| Global oil demand change (Q2 2026 year-on-year) | -2.4 million b/d | Revised growth to 1.2 million b/d for full year |
| Previous OPEC demand growth forecast | N/A | 1.4 million b/d |
| Supply growth revision (Americas) | +600 kb/d upward revision | Not specified |
| Refinery throughput decline (Q2 2026) | -4.5 million b/d | Not specified |
| Trader stance | Mixed, profit-taking noted | Broadly bullish maintained |
OPEC's monthly market report noted that net long positions in ICE Brent declined across April, driven by profit-taking from previously accumulated positions amid mixed geopolitical signals and the possibility of de-escalation. Despite this, institutional money managers and hedge funds maintained a broadly bullish posture on crude. Traders are pricing in oil remaining above $81 per barrel across the next 12 months based on current market positioning data.
Analyst Perspective: The gap between the IEA's demand destruction projection and OPEC's relatively constructive demand growth estimate reflects a genuine disagreement about how quickly economic softening translates into fuel consumption declines. Historical evidence from prior oil price shocks suggests demand destruction tends to lag price signals by six to twelve months, meaning sustained elevated prices are probable even if the geopolitical trigger eventually resolves.
Goldman Sachs separately sounded fresh alarms on the state of global oil stockpiles, adding weight to the IEA's assessment and reinforcing the view that the visible inventory drawdown is not a statistical artefact but a genuine physical depletion of the world's oil buffer.
The next major ASX story will hit our subscribers first
How Long Can Emergency Reserves Actually Sustain Markets
IEA member nations have collectively pledged a record 400 million barrels from strategic petroleum reserves. This is the largest coordinated emergency release in the organisation's history, surpassing even the releases undertaken during the 1991 Gulf War and the 2022 energy crisis.
At the current drawdown rate of 4 to 4.8 million barrels per day, 400 million barrels provides approximately 83 to 100 days of buffer supply in theory. In practice, logistical constraints mean pledged barrels do not all reach markets simultaneously. Refinery compatibility, shipping availability, and contractual delivery timelines all slow the effective release rate.
Why Strategic Reserves Cannot Solve a Structural Problem
- SPR releases are a bridge mechanism, not a supply replacement. They buy time but do not address the underlying production and transport disruption
- Once reserve inventories are drawn down, rebuilding them requires purchasing oil on the open market, which itself adds demand pressure and creates upward price momentum during the recovery phase
- The US, Japan, and India all hold reserves covering a limited number of days of national consumption at current demand rates
- Europe's jet fuel stocks, in particular, are approaching thresholds where available emergency reserves may be insufficient to prevent visible shortages before the summer travel season peaks in July and August
- The IEA has explicitly flagged that oil markets could enter what it described as a critical zone by July or August 2026 if Hormuz traffic does not normalise substantially
Warning: Markets currently being stabilised by emergency reserve releases face a compounding pressure event when conflict eventually de-escalates. The cessation of emergency releases removes artificial supply support at the same moment that inventory rebuilding adds new demand to the market. This dynamic could sustain elevated prices well beyond any political resolution.
Can Non-Middle East Producers Fill the Gap
The honest answer is no, at least not at the scale required. The oil price shock drivers that analysts have long modelled as tail risks have now materialised together, and Americas supply growth of 1.5 million barrels per day represents roughly 10% of the 14 million barrels per day currently shut in from the Gulf. Norwegian offshore production beat forecasts in April 2026, and Nigeria's targeted 100,000 barrel per day increase is meaningful in isolation. However, these contributions are marginal relative to the structural hole in global supply.
Scenario: What Happens If the Conflict Resolves Within 60 Days
Even under an optimistic resolution timeline, a rapid price normalisation is unlikely for several reasons:
- Hormuz tanker traffic would not normalise immediately. Mine clearance operations, shipping insurance reinstatement, and restoration of commercial confidence in the corridor take weeks to months even after a ceasefire holds
- Gulf producers would require time to ramp production back to pre-conflict levels, as wells and processing infrastructure that have been idle for extended periods cannot be instantly restored to full output
- Inventory rebuilding demand would add upward price pressure for three to six months post-conflict as importers scramble to restore depleted national stockpiles
- Aviation and petrochemical sectors, the hardest hit, face the longest recovery timelines due to supply chain complexity and the time required to rebuild feedstock inventories
- Inflation embedded from the energy price spike would persist in consumer economies for six to twelve months regardless of when crude prices begin to normalise
The Energy Transition Dimension: Crisis as Accelerant
One largely unintended consequence of the supply shock is that it is functioning as a powerful accelerant for structural change. The broader energy transition shift is gaining momentum, with the IEA confirming that the oil shock is driving a measurable and significant surge in electric vehicle sales globally. Europe's EV adoption is accelerating as consumers seek insulation from volatile fuel costs. China's solar exports are surging as the world grapples with the energy crisis. US energy storage installations posted a record first quarter in 2026.
Perhaps most symbolically, wind and solar electricity generation surpassed gas-fired generation for the first time on record, a structural milestone that the supply shock has almost certainly accelerated by several years relative to baseline transition projections.
The paradox is clear: short-term pain from high fuel prices and physical shortages is creating precisely the long-term structural incentives needed to reduce oil dependency. However, the transition timeline means liquid fuels remain critical for years to come, and the world cannot simply will itself off oil in the space of a supply crisis. Inventory management, supply security, and strategic reserve architecture remain non-negotiable priorities for energy policymakers even as the longer-term direction of travel is unmistakable. For a broader context on where markets stand today, the current crude market overview provides essential baseline data.
Frequently Asked Questions
How much oil has been lost from global inventories since the conflict began?
Global oil stockpiles plunge as Iran war chokes supply remains the defining story here. Global inventories fell by approximately 250 million barrels across March and April 2026 alone, at an average rate of 4 million barrels per day. Cumulative supply losses from Gulf producers have exceeded 1 billion barrels since the conflict's onset.
What is the current price of Brent Crude?
Brent Crude peaked at approximately $140 to $141 per barrel at the height of tensions and was trading at around $107 at the time of the IEA's May 2026 report. Trader positioning implies expectations that oil will remain above $81 per barrel for the next 12 months.
Which countries are most vulnerable to the oil supply shock?
Japan, India, and European nations with limited strategic reserves and high Middle East import dependency face the greatest near-term vulnerability. Japan's Middle East crude imports have fallen to record lows, and India's strategic reserves cover only a limited number of days of national demand.
Are emergency oil reserves sufficient to prevent shortages?
The IEA coordinated a record 400 million barrel emergency release. At current drawdown rates, this provides approximately 83 to 100 days of theoretical buffer, but logistical constraints reduce real-world effectiveness. Furthermore, rebuilding depleted reserves post-conflict will itself add demand pressure. Reporting from the Economic Times has described this dynamic as rapidly wiping out the world's oil stockpile cushion.
Which sectors are most affected?
The petrochemical and aviation sectors have been identified as the most severely impacted. Refinery throughputs have fallen by approximately 4.5 million barrels per day in the second quarter of 2026, and European jet fuel stocks are approaching critically low levels ahead of summer. Consequently, global oil stockpiles plunge as Iran war chokes supply continues to shape both short-term operations and longer-term strategic planning across virtually every energy-intensive industry.
Disclaimer: This article is for informational purposes only and does not constitute financial or investment advice. Forward-looking statements, price forecasts, and scenario projections involve uncertainty and should not be relied upon as predictions of future market outcomes. Readers should conduct their own research and consult qualified advisors before making investment decisions.
Want to Identify the Next Major Commodity Discovery Before the Broader Market?
While oil supply shocks reshape global energy economics, the flow-on effects across mining, exploration, and commodity markets create significant opportunities for well-positioned investors. Discovery Alert's proprietary Discovery IQ model delivers real-time notifications on significant ASX mineral discoveries — instantly translating complex commodity data into actionable investment insights — so subscribers can act decisively as major opportunities emerge. Explore Discovery Alert's discoveries page to understand how historic mineral discoveries have generated substantial returns, and begin a 14-day free trial to secure a market-leading edge today.