July 12, 2026

Modern global economies exist in a delicate equilibrium where energy costs serve as the foundation for virtually every productive activity. The mathematical relationship between oil prices and gross domestic product has evolved significantly since the supply shocks of the 1970s, yet the fundamental vulnerability remains intact. As geopolitical tensions escalate and supply chains face unprecedented disruptions, financial markets increasingly price in scenarios where crude oil could reach $150 per barrel, potentially triggering a global recession if oil goes to $150 and creating widespread economic contraction across multiple regions simultaneously.
Understanding the Economic Threshold: Why $150 Per Barrel Matters
The Mathematical Reality of Oil Price Impact on GDP
The correlation between oil price spikes and economic contraction follows predictable patterns that have remained consistent across different decades of energy crises. During the 1973 Arab Oil Embargo, crude prices increased from approximately $3 to $12 per barrel whilst OPEC nations reduced production by 5%, ultimately contributing to a 6% decline in US GDP during the combined 1974-1975 period. This established the foundational understanding that oil price multipliers cascade through economies via interconnected supply chains.
The International Monetary Fund's analysis demonstrates that sustained $10 increases in oil prices typically reduce global GDP growth by 0.1 to 0.4 percentage points, depending on economic structure and adjustment mechanisms. However, these estimates assume gradual price increases rather than the shock scenarios that could emerge from geopolitical disruptions. Furthermore, a sudden spike to $150 per barrel would represent a doubling from current levels, creating inflation transmission mechanisms that central banks would struggle to contain through conventional monetary policy tools.
Energy costs comprise approximately 8-10% of total producer price indices across developed economies, making them significant drivers of inflation dynamics. The Federal Reserve's research indicates that a $50 sustained increase in oil prices can add 0.5-1.0 percentage points to headline inflation, with core inflation increasing 0.2-0.3 percentage points as production costs become incorporated into pricing strategies across manufacturing and service sectors. This analysis aligns with broader concerns about the US economy and inflation facing additional pressures from multiple fronts.
| Oil Price Level | Historical GDP Impact | Inflation Effect | Recovery Timeline |
|---|---|---|---|
| $12 (1973 Crisis) | -6% GDP decline (US) | 12-15% OECD inflation | 5-7 years |
| $40 (1979 Crisis) | -3.2% GDP decline (US) | 13.5% peak inflation | 4-6 years |
| $147 (2008 Peak) | -4.3% GDP decline (US) | 5.6% peak inflation | 3-4 years |
| $150 (Projected) | -5% to -8% potential decline | 8-12% potential inflation | 4-7 years estimated |
Central Bank Policy Dilemmas at Extreme Price Levels
Central bank responses to energy-driven inflation create complex policy trade-offs that become increasingly difficult to navigate as oil prices reach extreme levels. The stagflation scenarios of the 1970s occurred precisely because monetary authorities faced the impossible choice between fighting inflation through restrictive policies or supporting economic growth through accommodative measures. Modern central banks possess more sophisticated tools, yet the fundamental dilemma remains unchanged when energy costs surge beyond sustainable thresholds.
Interest rate policy constraints emerge when energy-driven inflation becomes embedded in wage expectations and long-term contracts. If oil prices sustained levels around $150 per barrel for extended periods, central banks would face pressure to raise rates aggressively to prevent inflation expectations from becoming unanchored. However, such aggressive tightening during an energy-induced supply shock would amplify the recessionary effects and potentially create deflationary spirals once energy prices eventually normalise.
Currency stability challenges become particularly acute for oil-importing nations during extreme price spikes. Countries with current account deficits face triple pressures: higher import costs, capital flight seeking inflation hedges, and reduced competitiveness as domestic costs rise faster than trading partners. Consequently, the resulting currency depreciation creates additional inflationary pressures through import price channels, forcing central banks into even more restrictive policy stances.
When big ASX news breaks, our subscribers know first
What Historical Precedents Reveal About Oil Shock Economics?
Comparative Analysis: 1970s vs. 2008 vs. Potential 2026 Crisis
The structural characteristics of economies during different oil shock periods reveal important insights about resilience mechanisms and vulnerability factors. The 1970s crisis occurred when manufacturing represented approximately 25% of OECD GDP compared to roughly 12% today, creating different transmission channels and adjustment requirements. Fixed exchange rate systems initially constrained monetary policy responses, while synchronised global production cycles amplified shock effects across interconnected economies.
By contrast, the 2008 oil price spike to $147.27 per barrel occurred within service-oriented economies where 65% of output had lower direct energy intensity. More flexible labour markets enabled faster adjustment mechanisms, while floating exchange rates allowed currency depreciation for deficit nations to partially offset higher energy costs. Established strategic petroleum reserves provided some buffer capacity, though coordination mechanisms remained limited during the initial crisis phases.
A potential 2026 scenario involving $150 oil would differ fundamentally from previous crises due to structural changes in energy consumption patterns and economic composition. Global energy intensity has improved by approximately 1.8% annually since 2000, reducing oil's GDP impact per unit price increase. Renewable energy now constitutes over 30% of electricity generation in many OECD nations, reducing oil's leverage over overall energy costs compared to previous decades.
| Crisis Period | Peak Oil Price | GDP Impact | Inflation Peak | Unemployment Peak | Recovery Timeline |
|---|---|---|---|---|---|
| 1973-1974 | $12/barrel | -6.0% (US) | 15.0% (OECD) | 7.2% (US) | 5-7 years |
| 1979-1980 | $40/barrel | -3.2% (US) | 13.5% (US) | 7.8% (US) | 4-6 years |
| 2008 | $147/barrel | -4.3% (US) | 5.6% (US) | 10.0% (US) | 3-4 years |
| 2026 (Projected) | $150/barrel | -5% to -8% | 8-12% estimated | 8-12% estimated | 4-7 years |
Regional Vulnerability Assessment
Regional economic vulnerabilities to extreme oil prices vary significantly based on energy dependency ratios, economic structure, and policy response capabilities. European economies face particular exposure due to limited domestic energy production and manufacturing sectors that remain energy-intensive despite efficiency improvements. Germany's industrial base consumes approximately 2.3 million barrels per day of oil equivalent, making sustained $150 prices potentially devastating for export competitiveness and employment levels.
Emerging market economies demonstrate higher vulnerability coefficients due to several compounding factors. Lower foreign exchange reserves limit import financing capacity during extended high-price periods, while manufacturing sectors typically maintain higher energy intensity ratios compared to developed service economies. Countries like India and Brazil would face deeper recession risks, as experienced during 2008 when they contracted by 5.2% and 7.0% respectively, compared to milder impacts in developed nations.
The United States maintains relative resilience factors through domestic energy production capabilities and dollar reserve currency status, yet remains vulnerable through consumer spending channels. American households allocate approximately 3-4% of total expenditures to gasoline under normal conditions, but this ratio could reach 6-8% at sustained $150 oil prices, creating significant discretionary spending reductions that propagate through retail and service sectors.
How Do Geopolitical Chokepoints Amplify Economic Risk?
The Strait of Hormuz: Critical Infrastructure Economics
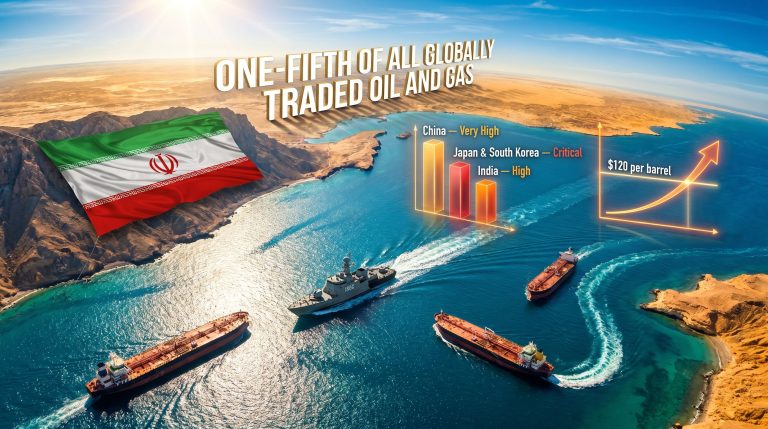
The Strait of Hormuz processes approximately 21 million barrels per day of crude oil, representing 21% of globally traded petroleum, along with LNG throughput averaging 75-85 billion cubic metres annually. This concentration creates irreplaceable dependency relationships that cannot be redirected through alternative routes without massive logistical disruptions and cost increases. The total energy value transiting Hormuz approaches $100-120 billion annually at current price levels, demonstrating the scale of economic activity dependent on this single geographic chokepoint.
Current disruptions have reached unprecedented levels according to the International Energy Agency's characterisation of present conditions as the largest oil supply disruption in history. The conflict has essentially halted shipments through the strait, creating supply shortages that ripple through global markets within weeks rather than months. Even temporary closures create lasting price premium effects as markets price in elevated geopolitical risk probabilities for extended periods.
Alternative routing mechanisms prove inadequate for handling Hormuz-level throughput volumes under crisis conditions. The Suez Canal handles different trade flows with limited spare capacity, while the Trans-Arabian Pipeline maintains maximum capacity of only 5 million barrels per day versus 21 million through Hormuz. In addition, routing around the Cape of Good Hope adds 6,000+ nautical miles and 2-3 weeks transit time, increasing shipping costs by $2-4 per barrel whilst straining global tanker fleet capacity beyond sustainable levels.
| Chokepoint | Daily Throughput | Global Share | Alternative Capacity | Rerouting Cost |
|---|---|---|---|---|
| Strait of Hormuz | 21 million bpd | 21% | 5 million bpd max | +$2-4/barrel |
| Suez Canal | 5.5 million bpd | 5.5% | Limited spare | +$1-2/barrel |
| Strait of Malacca | 15.6 million bpd | 15.6% | Lombok/Makassar | +$0.50-1/barrel |
| Bab el-Mandab | 6.2 million bpd | 6.2% | Cape of Good Hope | +$3-5/barrel |
Iran's Economic Leverage Through Energy Disruption
Iran's strategic positioning creates credible deterrent effects without necessarily requiring full implementation of disruption threats. The mere possibility of closure elevates risk premiums embedded in oil price forward curves by 10-15% during periods of elevated tensions, costing global economies approximately $15-25 billion annually in excess energy costs. This threat premium mechanism provides Iran with economic leverage that extends far beyond its direct market share participation.
According to BlackRock CEO warnings, sustained threats to regional trade and peaceful coexistence could result in years of oil prices above $100 and approaching $150, with profound economic implications that could trigger a global recession if oil goes to $150.
"If the price of oil hits $150 a barrel, it will trigger a global recession. The resulting economic disruption would be stark and steep, potentially lasting years," warned Larry Fink, highlighting the interconnected nature of energy markets and global economic stability.
Game theory applications to energy geopolitics reveal that Iran's optimal strategy involves maintaining credible threats rather than actual implementation, as full closure would invite military intervention whilst partial restrictions maximise economic disruption with reduced escalation risks. This strategic calculation creates persistent uncertainty that keeps risk premiums elevated and energy security concerns at the forefront of economic policy planning across major economies.
Economic warfare implications extend beyond immediate energy markets to encompass global trade flow disruptions, supply chain reconfiguration costs, and military expenditure increases. Defence spending allocations increase substantially during extended geopolitical tensions, diverting resources from productive investment whilst creating inflationary pressures through government deficit spending during periods when tax revenues decline due to slower economic growth.
What Are the Sectoral Cascading Effects of Extreme Oil Prices?
Transportation and Logistics Industry Breakdown
Transportation sectors face immediate cost structure disruptions when oil prices reach extreme levels, as fuel represents 35-45% of operating expenses for trucking companies and 25-30% for airlines. During the 2008 oil spike, major airlines reported fuel costs consuming 41% of operating expenses at peak levels, forcing widespread implementation of baggage fees and route consolidation strategies. A sustained $150 oil environment would require even more dramatic operational adjustments, including potential elimination of less profitable routes and aircraft fleet downsizing.
Consumer behaviour shifts accelerate under extreme energy cost conditions, creating demand destruction patterns that compound transportation industry difficulties. Vehicle miles travelled typically decline 2-4% for every $20 increase in oil prices as consumers consolidate trips, shift to public transportation, and delay discretionary travel. Commercial freight demand experiences similar reductions as businesses minimise inventory levels and optimise supply chain efficiency to reduce transportation cost exposure.
Supply chain reconfiguration scenarios become inevitable when transportation costs increase by 50-100% from baseline levels. Companies begin reshoring production facilities closer to end markets, reducing dependence on long-distance freight transportation. Furthermore, regional supplier networks expand as businesses prioritise proximity over cost optimisation, fundamentally altering global trade patterns that developed during decades of relatively stable energy costs.
Manufacturing Sector Vulnerability Matrix
Energy-intensive manufacturing industries face the most severe disruption risks during extreme oil price scenarios. Aluminium production requires approximately 15,000-20,000 kWh of electricity per ton, whilst steel production consumes equivalent energy amounts through various input channels. Chemical manufacturing, particularly petrochemical derivatives, faces dual pressures from both energy costs and feedstock price increases that can render many production processes economically unviable at $150 oil levels.
Geographic production shift probabilities increase substantially as manufacturers evaluate cost structures across different regions. Energy costs can represent 15-25% of total production costs in heavy manufacturing, making location decisions highly sensitive to regional energy price differentials. Countries with abundant renewable energy capacity or domestic fossil fuel resources gain competitive advantages that drive manufacturing migration patterns over 3-5 year timeframes.
Input cost inflation propagates through manufacturing supply chains via multiple transmission mechanisms simultaneously. Raw material costs increase directly through energy-intensive extraction and processing, whilst transportation costs for intermediate goods create additional layers of cost pressure. Manufacturing companies typically operate on 3-6 month inventory cycles, meaning sustained high energy costs eventually require output price increases that reduce demand and force production adjustments.
How Would Financial Markets Respond to Sustained $150 Oil?
Equity Market Sector Rotation Patterns
Historical equity market performance during oil price spikes reveals predictable sector rotation patterns that amplify during extreme price scenarios. Energy sector stocks typically outperform broader markets by 20-40% during sustained high oil price periods, as higher commodity prices translate directly into improved profit margins for exploration and production companies. However, this outperformance occurs within overall market declines of 15-25% as economic growth concerns dominate investor sentiment.
Defensive positioning strategies become crucial as investors seek protection from energy-induced economic volatility. Consumer staples, utilities with regulated returns, and healthcare sectors historically demonstrate relative resilience during oil shock periods. Technology sector performance depends heavily on energy cost sensitivity and global demand patterns, with hardware manufacturers facing greater pressure than software companies due to supply chain and manufacturing cost exposures.
Transportation stocks, airlines, and energy-intensive manufacturing sectors typically underperform by 30-50% during sustained high oil price environments. Investors anticipate margin compression and reduced profitability, creating valuation adjustments that often exceed the direct financial impact of higher energy costs. Moreover, market psychology amplifies fundamental effects as risk-averse sentiment creates selling pressure beyond rational economic calculations.
| Sector | Historical Performance in Oil Shocks | $150 Oil Scenario Projection |
|---|---|---|
| Energy | +20% to +40% outperformance | +30% to +50% potential gains |
| Airlines | -30% to -50% underperformance | -40% to -60% potential decline |
| Utilities | -5% to +5% (mixed) | -10% to +10% (defensive) |
| Consumer Discretionary | -20% to -35% decline | -25% to -45% potential decline |
| Technology | -15% to -25% decline | -20% to -35% potential decline |
| Consumer Staples | -5% to +10% (defensive) | 0% to +15% (defensive) |
Currency and Bond Market Dynamics
Currency markets experience significant volatility during extreme oil price scenarios as current account balances shift dramatically between oil-importing and oil-exporting nations. The US dollar typically strengthens initially due to safe-haven demand and its role in oil transactions, but sustained high prices can create inflationary pressures that eventually weaken dollar purchasing power. Oil-exporting nations accumulate large dollar surpluses requiring recycling through global financial markets.
Petrodollar recycling effects create complex liquidity flows that influence global credit markets and asset prices. Oil-exporting countries typically invest surplus revenues in sovereign bonds, real estate, and equity markets of developed nations, creating capital inflows that can offset some negative economic effects. However, this recycling process takes 12-18 months to fully materialise, meaning short-term liquidity conditions may tighten significantly during initial oil shock phases.
Sovereign debt sustainability concerns emerge for oil-importing nations with high debt-to-GDP ratios and limited fiscal flexibility. Countries spending 4-6% of GDP on energy imports under normal conditions could face 8-12% of GDP costs at $150 oil prices, requiring substantial fiscal adjustment or increased borrowing. Consequently, credit rating agencies monitor these dynamics closely, with downgrades possible for heavily indebted nations lacking energy self-sufficiency.
What Policy Tools Could Mitigate a $150 Oil Crisis?
Strategic Petroleum Reserve Deployment Strategies
Global strategic petroleum reserves total approximately 4.1 billion barrels across all member countries, with the United States maintaining the largest single reserve at 714 million barrels. However, maximum release rates are limited to approximately 4.4 million barrels per day globally, providing meaningful but temporary relief during supply disruptions. Coordinated release strategies require international cooperation mechanisms that can be difficult to achieve during geopolitical crises when national interests diverge.
Market intervention effectiveness depends heavily on disruption duration and market psychology factors beyond pure supply arithmetic. The 2011 International Energy Agency coordinated release of 60 million barrels provided temporary price relief but failed to prevent continued volatility as markets questioned reserve sustainability. During extended disruptions lasting 6+ months, strategic reserves can only provide bridging capacity whilst alternative supply sources are developed or diplomatic solutions are implemented.
International cooperation frameworks for crisis response have evolved substantially since the 1970s oil shocks, yet remain constrained by political considerations during actual emergencies. The International Energy Agency requires member countries to maintain 90 days of import coverage, but enforcement mechanisms are limited and some major economies remain outside the coordinated response system. Emergency sharing agreements exist on paper but have never been tested during severe, sustained supply disruptions.
Fiscal and Monetary Policy Coordination Requirements
Targeted subsidies versus broad-based economic support present difficult trade-offs for governments facing extreme oil prices. Direct fuel subsidies can cost 2-4% of GDP when oil prices reach $150 levels, creating substantial fiscal burdens whilst potentially preventing necessary demand adjustment. Alternative approaches include targeted support for low-income households and critical industries whilst allowing market prices to incentivise conservation and alternative energy adoption.
Central bank communication strategies become crucial during stagflationary periods when traditional policy tools create conflicting objectives. Clear messaging about temporary versus permanent inflation expectations helps anchor long-term expectations whilst acknowledging near-term price pressures. However, credibility requires demonstrated willingness to tighten policy if energy-driven inflation begins affecting wage and price-setting behaviours across the broader economy.
Structural reform acceleration typically occurs during energy crises as political feasibility increases for policies previously considered too costly or disruptive. Emergency energy efficiency standards, renewable energy deployment incentives, and infrastructure investment programmes gain support when energy security concerns override normal budgetary constraints. In addition, these reforms often provide lasting benefits that reduce future vulnerability to oil price shocks.
The next major ASX story will hit our subscribers first
Which Economic Indicators Should Investors Monitor?
Early Warning System Development
Leading indicators for oil-driven recession probability include several key metrics that provide advance warning of economic deterioration. Consumer confidence indices typically decline 2-3 months before GDP impacts become visible, as households immediately feel energy cost pressures through gasoline and heating expenses. Commercial vehicle sales and freight tonnage data provide real-time indicators of business activity adjustments as companies respond to higher transportation costs.
Credit spreads in energy-intensive sectors widen significantly before broader economic impacts materialise, as bond markets quickly price in reduced profitability expectations. High-yield spreads for transportation, manufacturing, and consumer discretionary sectors often increase by 100-200 basis points within weeks of sustained oil price increases. These financial market indicators can provide 3-6 month advance warning of employment and output effects.
Regional economic divergence patterns reveal important information about adaptation capabilities and vulnerability factors. States or countries with significant energy production typically demonstrate relative resilience, whilst regions dependent on manufacturing or transportation experience earlier and more severe impacts. Furthermore, monitoring employment data and tax revenue collections across different regions provides insights into crisis progression and recovery timeline probabilities.
Corporate Earnings Sensitivity Analysis
Earnings revision patterns across different sectors provide critical insights into market expectations and fundamental business impact assessments. Analyst downgrades typically begin with transportation and energy-intensive manufacturing companies, then spread to consumer discretionary sectors as economic effects broaden. Technology and healthcare sectors usually experience delayed impacts, making them potential relative outperformers during initial crisis phases.
Margin compression analysis reveals which business models remain viable under sustained high energy costs. Companies with strong pricing power and efficient supply chains maintain better margin stability, whilst those in competitive markets with fixed-price contracts face severe profitability pressure. Inventory level adjustments across industries indicate business confidence and demand expectations for future quarters.
Capital expenditure guidance changes signal long-term business investment priorities under altered energy cost assumptions. Energy-efficient equipment investment typically increases, whilst expansion projects in energy-intensive sectors may be delayed or cancelled. These capital allocation shifts provide insights into structural economic changes that persist beyond temporary price spikes.
What Long-Term Structural Changes Could Result?
Energy Transition Acceleration Under Crisis Conditions
Investment flow redirection toward alternative energy accelerates dramatically during sustained high oil price periods as economic incentives for renewable energy and efficiency technologies improve substantially. Solar and wind project economics become compelling without subsidies when oil prices remain above $120-130 per barrel for extended periods. Private investment in clean energy technologies typically increases 50-100% during oil price shock periods as investors seek alternatives to fossil fuel dependency.
Infrastructure development timeline compression occurs through both market forces and policy responses during energy crises. Electric vehicle charging networks, renewable energy transmission lines, and energy storage facilities receive accelerated permitting and funding when energy security becomes a national priority. Projects that might normally require 10-15 years for completion can be fast-tracked to 5-7 years under emergency conditions.
Regulatory framework evolution during energy emergencies often creates lasting policy changes that outlast the immediate crisis. Building efficiency standards, vehicle fuel economy requirements, and renewable energy mandates gain political support when energy costs create visible economic hardship. These regulatory changes typically remain in place permanently, creating structural shifts in energy consumption patterns that reduce future oil shock vulnerability.
How Do Global Trade Dynamics Factor Into Oil Price Impact?
Supply Chain Regionalization Trends
Supply chain regionalisation and friend-shoring trends accelerate when transportation costs increase dramatically due to high oil prices. Manufacturing companies prioritise supplier relationships within continental regions to minimise energy-intensive long-distance shipping. This regionalisation reduces efficiency gains from global optimisation but increases resilience against future energy price shocks and geopolitical disruptions.
Moreover, current oil price rally analysis suggests that various economic pressures could compound to create sustained pricing pressure. Trade tensions and tariff economic implications may further strain global supply chains already stressed by high energy costs.
Energy security integration into trade policy becomes a permanent feature of international relations following severe oil price disruptions. Countries negotiate trade agreements with explicit energy cooperation components, including strategic reserve sharing arrangements and renewable energy technology transfer provisions. Traditional free trade considerations become balanced against energy independence objectives in policy formation.
International Coordination Challenges
Multilateral cooperation mechanisms for crisis prevention expand beyond existing frameworks when the economic costs of energy disruptions become apparent. International early warning systems for supply disruption risks, coordinated strategic reserve policies, and joint renewable energy development projects gain support as countries recognise shared interests in energy market stability. These institutional changes often persist long after immediate crisis conditions resolve.
However, OPEC production impact decisions during crisis periods can either exacerbate or mitigate global economic effects. The organisation's response to supply disruptions significantly influences whether prices stabilise or continue climbing toward recession-inducing levels.
Furthermore, trade war effects on oil markets create additional complications for international coordination efforts. When economic nationalism takes precedence over multilateral cooperation, the effectiveness of traditional crisis response mechanisms becomes severely constrained.
Preparing for Energy-Driven Economic Disruption
Risk Assessment Framework for Stakeholders
Probability-weighted scenario analysis methodology provides essential tools for navigating uncertainty around potential oil price trajectories and economic impacts. Business planners should model multiple scenarios ranging from rapid price normalisation to sustained high prices lasting 3-5 years. Each scenario requires different operational responses, capital allocation priorities, and strategic positioning decisions that must be prepared in advance of actual crisis conditions.
Decision-making frameworks under extreme uncertainty require flexible approaches that maintain optionality rather than committing to single courses of action. Companies should develop contingency plans for different price levels and duration scenarios, with clear trigger points for implementing various response strategies. Supply chain diversification, energy efficiency investments, and financial hedging strategies provide valuable flexibility during volatile periods.
Contingency planning essentials include identifying critical vulnerabilities, developing alternative supplier relationships, and maintaining adequate liquidity reserves for extended high-cost periods. Energy-intensive businesses should evaluate production process alternatives, geographic diversification opportunities, and potential joint venture arrangements that could provide protection against sustained cost pressures. Financial planning should include stress testing under various oil price scenarios with appropriate risk management strategies.
Strategic Positioning for Economic Resilience
Diversification strategies across asset classes and geographies become crucial for investors and businesses preparing for potential energy-driven disruptions. Energy sector exposure can provide portfolio protection during oil price spikes, whilst international diversification across oil-exporting and oil-importing regions can reduce overall volatility. Real assets including commodities, real estate, and inflation-protected securities typically outperform during extended inflationary periods caused by high energy costs.
Operational flexibility requirements for volatile energy environments include maintaining multiple supplier options, developing energy-efficient production processes, and creating scalable business models that can adjust quickly to changing cost structures. Companies with higher fixed costs face greater vulnerability than those with variable cost structures that can adjust proportionally to demand changes during economic contractions.
Long-term value creation opportunities during crisis periods often emerge through strategic investments in energy efficiency, alternative energy technologies, and business model innovations that reduce oil dependency. Companies that successfully navigate oil price shocks typically emerge with competitive advantages including lower energy costs, more efficient operations, and stronger customer relationships built during difficult periods. These crisis-driven improvements often provide lasting benefits that justify the short-term adjustment costs.
Disclaimer: This analysis contains forward-looking statements and scenario projections based on historical data and current market conditions. Actual economic impacts may vary significantly from projected outcomes due to policy responses, technological developments, and unforeseen market dynamics. Investors should conduct their own due diligence and consider consulting financial advisors before making investment decisions based on oil price scenarios.
Ready to Position Your Portfolio for Energy Market Volatility?
As oil prices threaten to reach recession-triggering levels, Discovery Alert's proprietary Discovery IQ model provides critical insights into ASX mineral discoveries that could offer portfolio protection during energy-driven market disruption. With global economies increasingly vulnerable to supply shocks and geopolitical tensions, savvy investors are turning to Discovery Alert's proven track record of identifying significant mineral discoveries before broader market recognition. Start your 14-day free trial today to gain immediate access to real-time alerts that could help navigate the challenging economic landscape ahead.