July 17, 2026
The global steel production decline February 2026 reflects a complex web of economic pressures and regional policy decisions that have reshaped manufacturing landscapes worldwide. Manufacturing cycles rarely announce their turning points with dramatic fanfare. Instead, they reveal themselves through subtle shifts in production data that, when examined closely, illuminate the complex interplay between industrial capacity, regional policy decisions, and global economic momentum. The steel industry, as the backbone of modern industrial economies, serves as one of the most reliable barometers for understanding these broader manufacturing trends and their underlying economic drivers.
Understanding the Broader Economic Context
The global crude steel production landscape in February 2026 revealed a 2.2% year-over-year decline, with output reaching 141.8 million tonnes across the 69 countries tracked by the World Steel Association. This contraction represents more than a simple statistical data point; it reflects the culmination of diverse economic pressures affecting different regions in markedly different ways.
Year-to-date figures through February 2026 show 298.2 million tonnes of production, representing a 1.5% decline compared to the same period in 2025. The February data becomes particularly significant when contrasted with January 2026's more severe 6.5% decline, suggesting potential stabilisation in production patterns as the year progressed.
This production trajectory emerges from a complex web of factors including post-pandemic economic normalisation, evolving industrial activity cycles, and shifting demand patterns across key steel-consuming sectors. Furthermore, the US economic dynamics have played a crucial role in shaping global production patterns through policy initiatives and infrastructure spending commitments.
The data collection methodology employed by the World Steel Association encompasses crude steel production (also referred to as raw or liquid steel) before secondary processing, providing a comprehensive view of primary production capacity utilisation across major steel-producing nations.
When big ASX news breaks, our subscribers know first
Regional Steel Production Patterns: A Comprehensive Analysis
How Did Asia-Pacific Markets Perform in February 2026?
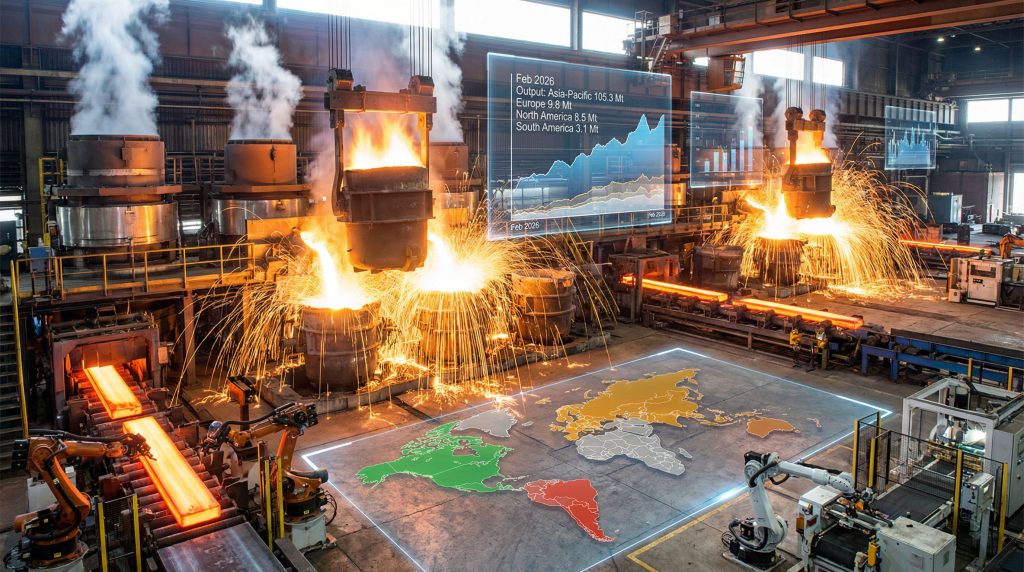
Asia-Pacific's dominance in global steel production continued in February 2026, accounting for 74.3% of total output with 105.3 million tonnes, despite experiencing a 1.9% regional decline year-over-year. This regional performance masks significant variation among individual countries within the region.
China's Production Trajectory and Policy-Driven Adjustments
China maintained its position as the world's largest steel producer with 76.1 million tonnes in February 2026, representing 53.6% of global production. However, the country experienced a 3.6% year-over-year decline, steeper than the global average. This reduction suggests deliberate policy measures affecting output levels, departing from China's historical role as the primary driver of global steel demand growth.
The scale of China's production means that its 3.6% decline alone represents approximately 2.8 million tonnes of reduced global output, contributing substantially to the overall global contraction. This demonstrates China's outsized influence on global steel production patterns and provides valuable iron ore demand insights for understanding commodity market dynamics.
India's Contrasting Growth Momentum
India emerged as a notable countertrend within the regional decline, producing 13.6 million tonnes with a remarkable 7.7% year-over-year increase. This growth trajectory positions India as a significant counterweight to regional decline and suggests that India is gaining market share as other Asian producers contract.
India's performance indicates strong domestic demand drivers supporting increased steel consumption, though the specific sectoral sources of this demand require further analysis to understand sustainability.
Japan's Stagnation Patterns
Japan's steel production remained flat at 6.4 million tonnes with 0% growth year-over-year, representing neither contraction nor expansion. This stagnant output reflects a mature market with stable baseline demand levels that appears disconnected from broader global trends.
South Korea's Marginal Stability
South Korea produced 4.8 million tonnes with a minimal 0.2% increase, representing the thinnest of growth margins. This performance suggests the country is maintaining production levels despite regional headwinds but lacks momentum for significant expansion.
| Country/Region | February 2026 Output (Mt) | YoY Change | Global Market Share |
|---|---|---|---|
| China | 76.1 | -3.6% | 53.6% |
| India | 13.6 | +7.7% | 9.6% |
| Japan | 6.4 | 0% | 4.5% |
| South Korea | 4.8 | +0.2% | 3.4% |
| Asia-Pacific Total | 105.3 | -1.9% | 74.3% |
What Drove Production Changes Across the Americas?
The Americas demonstrated striking internal divergence, with North America achieving modest growth while South America experienced significant contraction. This hemispheric split reflects fundamentally different economic drivers and policy environments.
United States Manufacturing Resurgence
The United States registered the strongest growth rate among major global producers with 6.5 million tonnes output and a 5.8% year-over-year increase. This performance suggests that domestic infrastructure spending commitments are successfully stimulating steel consumption and production, effectively decoupling U.S. production from global contraction trends. However, ongoing concerns about US steel tariffs impact continue to influence market dynamics and international trade patterns.
The United States accounts for 4.6% of global production, making it the world's third-largest steel producer after China and India. The 5.8% increase represents approximately 0.35 million tonnes of additional output during a period when the broader global market contracted.
Brazil's Production Contraction and Market Pressures
Brazil experienced a 5.7% production decline with output of 2.5 million tonnes, representing one of the steepest declines among major producers globally. This contraction is proportionally more severe than the global average, indicating country-specific economic challenges beyond general global headwinds.
Regional Trade Dynamics
North America achieved 8.5 million tonnes with a 0.5% increase, while South America produced 3.1 million tonnes with a sharp 7.7% decline. Together, the Americas represent 8.2% of global production, with the United States contributing the majority of North American output.
| Region/Country | February 2026 Output (Mt) | YoY Change | Regional Context |
|---|---|---|---|
| United States | 6.5 | +5.8% | Strong infrastructure-driven growth |
| Brazil | 2.5 | -5.7% | Steep domestic market decline |
| North America | 8.5 | +0.5% | Modest regional growth |
| South America | 3.1 | -7.7% | Significant regional contraction |
European Steel Sector Response to Market Conditions
European Union member states collectively produced 9.8 million tonnes in February 2026, experiencing a 3.6% year-over-year decline that exceeded the global average contraction. This performance places European steelmakers among the most challenged regions globally, comparable to China's decline rate.
The EU-27's production represents 6.9% of global output, and the steeper-than-average decline suggests region-specific challenges affecting competitiveness and demand patterns. The 3.6% decline contrasts sharply with North America's modest growth (+0.5%), indicating divergent economic conditions and policy environments.
Economic Drivers Behind February's Production Shifts
Supply Chain and Market Dynamics Analysis
The February 2026 production patterns reveal significant regional variations that extend beyond simple demand-supply mechanics. Russia experienced the most severe contraction among major producers with 5.0 million tonnes output and a 10.2% year-over-year decline, representing the steepest reduction globally.
Conversely, Turkey demonstrated resilience with 3.0 million tonnes production and 3.4% growth despite regional European decline and broader global contraction. This counter-cyclical performance suggests either strong domestic demand dynamics or successful market position gains.
Iran produced an estimated 1.7 million tonnes with a minimal 1.3% decline, indicating relative stability in production levels despite regional geopolitical complexities. These developments are closely linked to broader mining industry evolution patterns that influence steel production capabilities worldwide.
Production Efficiency and Capacity Utilisation
The global steel production decline February 2026 data indicates reduced demand signals across multiple regions, though the specific mechanisms driving these changes require careful analysis. Production declines could reflect various factors including:
• Demand-side adjustments from construction sector weakness
• Strategic production management based on inventory levels
• Cost optimisation responses to input price pressures
• Market positioning decisions in response to competitive dynamics
The variation in regional performance suggests that local economic conditions, policy environments, and market structures play crucial roles in production decision-making beyond global demand trends.
Market Demand Analysis: Sector-Specific Impacts
Construction and Infrastructure Sector Dynamics
The relationship between steel production and end-use sectors becomes evident when examining regional performance variations. The United States' strong production growth (+5.8%) during a period of global contraction suggests robust domestic demand drivers, likely linked to infrastructure investment initiatives.
Brazil's sharp decline (-5.7%) compared to the global average indicates potential weakness in construction and industrial sectors, though specific sectoral data would be required to identify the primary demand sources affecting production decisions.
Manufacturing Sector Steel Consumption Patterns
The automotive industry's steel consumption patterns, whilst not directly quantified in available data, can be inferred from regional production trends. Asia-Pacific's continued dominance (74.3% of global production) despite regional decline suggests that manufacturing centres remain concentrated in this region, even as growth rates moderate.
India's exceptional growth (+7.7%) indicates expanding domestic manufacturing capacity and infrastructure development, positioning the country as an increasingly important steel consumer and producer. Consequently, this trend has implications for iron ore price decline patterns as demand shifts regionally.
Financial Performance Implications for Steel Companies
Industry Profitability and Margin Analysis
The global steel production decline February 2026 creates mixed implications for industry profitability. Producers in declining markets may face margin pressure from reduced capacity utilisation, while those in growing markets like India and the United States may benefit from improved pricing power and demand stability.
Regional Margin Differential Factors:
• Energy cost variations affecting production economics across regions
• Raw material logistics and transportation cost differentials
• Currency fluctuations impacting export competitiveness
• Regulatory compliance costs varying by jurisdiction
Investment and Capital Allocation Strategies
The divergent regional performance patterns suggest that steel companies must adopt increasingly sophisticated capital allocation strategies. Growth markets like India present expansion opportunities, whilst mature markets require efficiency optimisation and cost management focus.
Working capital management becomes critical in declining production environments, as companies must balance inventory levels with uncertain demand patterns whilst maintaining operational flexibility.
Comparative Analysis: February 2026 vs Historical Patterns
| Region | Feb 2026 Output (Mt) | YoY Change | Global Share | Historical Context |
|---|---|---|---|---|
| Asia-Pacific | 105.3 | -1.9% | 74.3% | Reflects China's policy adjustments |
| Europe (EU-27) | 9.8 | -3.6% | 6.9% | Steeper decline than global average |
| North America | 8.5 | +0.5% | 6.0% | Infrastructure spending support |
| South America | 3.1 | -7.7% | 2.2% | Sharp domestic demand weakness |
| Others* | 14.1 | -8.8% | 10.6% | Mixed performance across regions |
*Others includes Russia (-10.2%), Turkey (+3.4%), Iran (-1.3%), and additional reporting countries
The February 2026 production data represents a continuation of trends visible from January 2026, when global production declined 6.5%. The moderation from 6.5% to 2.2% decline suggests potential stabilisation, though regional variations indicate different recovery trajectories. According to recent global steel production analysis, these patterns reflect fundamental shifts in the industry structure.
The next major ASX story will hit our subscribers first
Future Production Outlook and Strategic Implications
Factors Shaping Steel Production Through 2026
Several key variables will likely influence global steel production patterns through the remainder of 2026:
Seasonal Demand Patterns: Traditional spring and summer construction seasons may provide demand support, though regional economic conditions will determine the magnitude of any seasonal uptick.
Policy Environment Evolution: China's production policies, U.S. infrastructure spending implementation, and European regulatory developments will significantly influence global production patterns.
Regional Economic Performance: India's growth momentum sustainability, Brazil's economic recovery potential, and European industrial competitiveness will shape regional production trajectories.
Risk Management and Strategic Positioning
Steel industry stakeholders should consider multiple scenario planning approaches given the varied regional performance patterns observed in February 2026:
For Steel Producers:
• Geographic diversification strategies to capitalise on growth markets
• Operational flexibility to adjust production based on regional demand
• Cost structure optimisation to maintain competitiveness across cycles
For Steel Consumers:
• Supply chain diversification to reduce regional concentration risk
• Strategic inventory management based on regional production trends
• Long-term contracting strategies aligned with regional growth patterns
For Investors:
• Regional allocation strategies reflecting growth differentials
• Sector rotation opportunities based on steel demand patterns
• ESG considerations as environmental regulations affect production
Industry experts note that steel market trends indicate a complex interplay between supply constraints and evolving demand patterns that require careful monitoring.
Key Takeaways for Industry Participants
The February 2026 global steel production data reveals several critical insights for market participants:
Market Structure Evolution: Regional performance variations indicate increasing fragmentation in global steel markets, with growth opportunities concentrated in specific geographic areas rather than broad-based expansion.
Policy Impact Significance: Government policies and infrastructure spending commitments demonstrate measurable impacts on production patterns, as evidenced by contrasting U.S. growth and European decline.
Competitive Positioning Changes: Countries like India are gaining relative market position through sustained growth whilst established producers like China adjust output levels, suggesting shifting competitive dynamics.
Investment Timing Considerations: The stabilisation from January's 6.5% decline to February's 2.2% decline may indicate developing investment opportunities for contrarian investors willing to position ahead of potential recovery cycles.
The global steel production decline February 2026 represents a complex interplay of regional policy decisions, demand pattern evolution, and structural economic changes that require nuanced analysis beyond simple production volume comparisons.
Understanding these dynamics requires continuous monitoring of regional production data, policy developments, and sectoral demand indicators to identify emerging trends and investment opportunities within the global steel industry landscape.
Disclaimer: This analysis is based on production data from the World Steel Association as reported by Brasil Mineral. Investment decisions should incorporate additional research and professional financial advice. Steel production forecasts involve significant uncertainties including economic conditions, policy changes, and demand volatility that may materially affect actual outcomes.
Ready to Capitalise on Steel Market Opportunities?
Discovery Alert's proprietary Discovery IQ model delivers instant notifications on significant ASX mineral discoveries, including steel-related commodities, helping investors identify actionable opportunities ahead of the broader market. With the global steel production landscape showing such regional variation, positioning yourself to catch the next major discovery could provide the market edge you need—explore Discovery Alert's dedicated discoveries page to see historic examples of exceptional returns and begin your 14-day free trial today.