
May 22, 2026
Manufacturing cycles and economic indicators across different regions reveal complex patterns that extend far beyond simple supply and demand mechanics. The global steel industry operates as a sophisticated network where localized production decisions ripple through international markets, creating opportunities for strategic investors and manufacturers who understand these underlying dynamics.
Recent production data illustrates how regional economic conditions, policy frameworks, and industrial demand patterns create significant variance in manufacturing output, even during periods of apparent global synchronization. These variations offer insights into broader economic trends, infrastructure investment cycles, and competitive positioning within the international steel market, particularly when examining iron ore price trends and their correlation with production patterns.
What Drove the Global Steel Production Contraction in Early 2026?
Quantifying the Scale of Production Decline
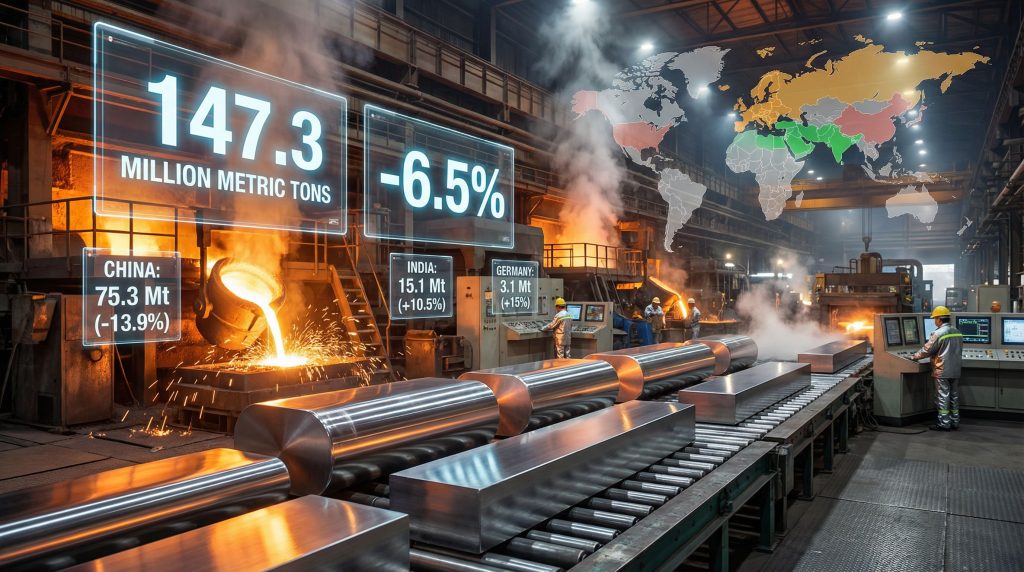
The global steel production decline January 2026 reached 6.5% compared to the same period in 2025, with crude steel output totalling 147.3 million metric tons across 69 reporting nations. This represents the fifth consecutive month of annual production decline, indicating sustained market adjustment rather than a temporary fluctuation.
According to the World Steel Association, daily production rates during January 2026 averaged 4.60 million metric tons, suggesting an annualised production capacity approaching 1.68 billion metric tons globally. However, the consecutive monthly decline pattern signals that the steel industry is experiencing structural recalibration affecting both demand patterns and capacity utilisation strategies.
| Production Metric | January 2026 | Year-over-Year Change |
|---|---|---|
| Global Output | 147.3 Mt | -6.5% |
| Daily Rate | 4.60 Mt | -6.5% |
| Reporting Nations | 69 countries | N/A |
Regional Performance Disparities and Economic Implications
The global steel production decline January 2026 was not uniformly distributed across regions, revealing significant economic disparities:
- Asia-Pacific: 107.6 Mt (-8.6% YoY) – dominated by Chinese production adjustments
- European Union: 10.3 Mt (-2.3% YoY) – relatively modest decline despite broader challenges
- North America: 9.2 Mt (-0.6% YoY) – minimal contraction with internal variations
- Middle East: 4.8 Mt (+12.6% YoY) – strongest regional growth
- Africa: 2.0 Mt (+5.8% YoY) – emerging market resilience
- Russia and CIS + Ukraine: 6.5 Mt (-8.6% YoY) – significant contraction
- South America: 3.4 Mt (-1.2% YoY) – mild decline
The 28.9 percentage point spread between the strongest growth (Iran at +15.1%) and steepest decline (China at -13.9%) indicates heterogeneous economic conditions rather than synchronised global cycles. Furthermore, this variance suggests that localised factors including construction activity, manufacturing demand, and infrastructure investment priorities drive production decisions more significantly than global market sentiment, particularly when considering the impact of potential tariffs global impact on regional trade patterns.
When big ASX news breaks, our subscribers know first
How Did China's Steel Output Reshape Global Production Dynamics?
Analyzing China's 13.9% Production Drop Impact
China's steel output declined to 75.3 million metric tons in January 2026, representing a 13.9% decrease from the previous year. This decline is particularly significant given China's 51.2% global market share, meaning Chinese production decisions directly influence international raw material markets, trade flows, and pricing mechanisms.
The magnitude of China's decline exceeded the global average by more than double (13.9% vs 6.5%), indicating that Chinese mills experienced either deliberate production cutbacks for economic policy reasons or faced demand destruction more severe than other producing regions. This 12 million metric ton reduction in Chinese output alone accounts for approximately 18% of the total global production decline.
"China's disproportionate production decline reflects adjustments to domestic economic policy and demand normalisation following the post-pandemic stimulus period, with implications extending far beyond national borders."
Supply Chain Ramifications Across Manufacturing Sectors
China's production adjustment creates cascading effects throughout global supply chains, particularly in relation to China's iron ore surplus conditions:
Raw Material Market Impact:
- Iron ore procurement: Reduced demand affecting global mining operations and pricing
- Coking coal consumption: Lower blast furnace utilisation impacting metallurgical coal markets
- Scrap steel availability: Increased scrap supply potentially benefiting electric arc furnace operators
- Freight and shipping: Reduced raw material transportation requirements
Manufacturing Sector Adjustments:
- Construction industry: Reduced steel availability for domestic Chinese construction projects
- Export market dynamics: Potential increased availability of Chinese steel for international markets
- Automotive production: Supply chain adjustments for steel-intensive vehicle manufacturing
- Infrastructure development: Alignment of steel production with government infrastructure spending priorities
The interconnected nature of China's steel production with global supply chains means that this 13.9% decline influences manufacturing costs, availability, and competitive positioning across multiple industries and geographic regions.
Which Regional Markets Demonstrated Production Resilience?
North American Steel Sector Performance Analysis
North American steel production demonstrated relative stability with only a 0.6% regional decline, though internal performance varied significantly:
| Country | January 2026 Output (Mt) | YoY Change | Key Performance Factors |
|---|---|---|---|
| United States | 7.1 | +3.3% | Infrastructure spending, manufacturing reshoring |
| Regional Total | 9.2 | -0.6% | Mixed performance across region |
The United States' 3.3% growth contrasts sharply with the regional average decline, suggesting that other North American producers (particularly Canada) experienced offsetting weakness. This divergence indicates that domestic U.S. demand for steel products remained robust, potentially driven by infrastructure investment programmes and manufacturing reshoring initiatives.
European Market Stability Indicators
European steel production exhibited remarkable variance, with Germany achieving exceptional 15% growth to 3.1 million metric tons whilst the broader EU-27 declined 2.3%. This performance differential suggests:
- Industrial demand concentration: German automotive, machinery, and equipment manufacturing maintaining strong steel consumption
- Competitive positioning: German mills capturing market share from other European producers
- Specialised product demand: High-value steel applications supporting premium pricing and production volumes
Germany's growth rate of 15% represents the highest among major global producers, indicating that industrial demand for specialised steel products remains intact despite broader European manufacturing challenges.
Emerging Market Growth Trajectories
Several emerging markets demonstrated strong production growth, indicating regional demand expansion:
Top Growth Performers:
- Iran: 2.6 Mt (+15.1% YoY) – highest individual country growth rate
- India: 15.1 Mt (+10.5% YoY) – second-largest global producer with robust expansion
- Turkey: 3.4 Mt (+5.8% YoY) – regional manufacturing demand
- South Korea: 5.6 Mt (+5.0% YoY) – industrial production resilience
India's position as both the second-largest global producer and a 10.5% growth market creates significant implications for global steel trade patterns. In addition, the contrast between India's expansion and China's 13.9% decline suggests that Asian manufacturing activity is being redistributed regionally rather than universally contracted.
What Economic Factors Explain Regional Production Variations?
Demand-Side Drivers Influencing Output Decisions
The wide variance in regional production performance reflects heterogeneous economic conditions across different markets:
Construction Sector Activity Levels:
- China: 13.9% decline suggests reduced real estate investment and infrastructure spending
- India: 10.5% growth indicates expanding construction demand and urbanisation
- Germany: 15% growth may reflect specialised industrial construction requirements
- United States: 3.3% growth correlates with infrastructure investment programmes
Manufacturing Industry Production Schedules:
- Automotive sector: Electric vehicle transition affecting steel grade requirements and volumes
- Machinery production: Industrial equipment demand varying by region
- Export manufacturing: Trade policy impacts on production allocation decisions
Steel consumption in construction represents approximately 50-60% of total demand in most markets, making construction activity levels the primary driver of regional production variations. The divergence between Chinese construction decline and Indian construction expansion explains much of the production reallocation between these major markets.
Supply-Side Constraints and Capacity Utilisation
Energy Cost Fluctuations:
Steel production requires approximately 20-25 GJ of energy per metric ton of crude steel. Regional energy cost variations create significant competitive advantages:
- Middle East growth (+12.6%): Access to low-cost natural gas and electricity
- Germany's exceptional performance: Potential energy efficiency investments or specialised high-value production
- Russia's decline (-7.4%): Energy sector constraints or export limitations
Raw Material Availability and Transportation:
- Iron ore costs: Regional variations in procurement and transportation expenses
- Scrap steel markets: Local availability affecting electric arc furnace economics
- Coking coal access: Metallurgical coal transportation costs and availability
Environmental Regulations and Operational Flexibility:
- Emissions standards: Carbon pricing mechanisms affecting production economics
- Seasonal restrictions: Air quality management requirements in certain regions
- Efficiency mandates: Technology requirements for operational permits
Trade Policy Implications for Steel Markets
Tariff Structures and Export Competitiveness:
- Import protection measures: Domestic market access advantages for local producers
- Export incentives: Government policies supporting international market penetration
- Anti-dumping measures: Trade restrictions affecting production allocation decisions
Regional trade agreements and bilateral arrangements create preferential market access, influencing where steel production is most economically viable. The global steel production decline January 2026 occurred alongside trade policy adjustments that may have redistributed production geography rather than simply reducing total output.
How Do Current Production Levels Compare to Historical Benchmarks?
Daily Production Rate Analysis
January 2026 daily output of 4.60 million metric tons represents a month-over-month increase of 2.2% from December 2025, despite the 6.5% year-over-year decline. This sequential improvement suggests that:
- Seasonal adjustment patterns: Normal winter-to-spring production ramp-up
- Inventory management cycles: Restocking following year-end adjustments
- Demand recovery signals: Early indicators of market stabilisation
The annualised projection of approximately 1.68 billion metric tons globally would represent a significant capacity utilisation rate considering estimated global crude steel production capacity exceeding 2.2 billion metric tons annually.
Long-term Production Trend Assessment
The fifth consecutive month of annual decline establishes this downturn as more than cyclical volatility. Historical analysis suggests that:
- Cyclical downturns typically resolve within 2-3 months
- Structural adjustments require 6-12 months for market rebalancing
- Capacity rationalisation periods can extend 12-24 months
Steel Market Update reported that comparison to pre-pandemic production levels reveals that current output represents market normalisation rather than crisis contraction. However, the 2019 global crude steel production reached approximately 1.87 billion metric tons, suggesting current production levels remain within historical operating ranges.
What Investment Implications Emerge from Production Data?
Steel Industry Consolidation Opportunities
The global steel production decline January 2026 creates market share redistribution opportunities:
Capacity Rationalisation Benefits:
- High-efficiency producers gaining competitive advantages through lower operating costs
- Integrated mill operators capturing market share from higher-cost competitors
- Specialised product manufacturers maintaining pricing premiums in niche markets
Technology Adoption Acceleration:
- Electric arc furnace expansion benefiting from increased scrap availability
- Digital manufacturing systems improving production flexibility and cost management
- Energy efficiency investments reducing operational expenses relative to competitors
Geographic Positioning Advantages:
- German producers demonstrating exceptional 15% growth amid European challenges
- Indian manufacturers expanding capacity in growing domestic market
- Middle Eastern operations leveraging energy cost advantages
Raw Material Sector Impact Assessment
Production adjustments create cascading effects throughout raw material markets, including impacts on oil price movements as energy costs significantly influence steel production economics:
Iron Ore Market Dynamics:
- Reduced Chinese demand affecting global mining operations and pricing
- Indian production growth supporting continued ore demand in specific regions
- Transportation cost adjustments as shipping patterns adapt to new demand geography
Coking Coal Consumption Patterns:
- Blast furnace utilisation declining with reduced integrated steel production
- Metallurgical coal pricing adjusting to lower overall demand levels
- Regional supply agreements adapting to changed consumption patterns
Scrap Steel Market Evolution:
- Increased availability from reduced production creating supply surpluses
- Electric arc furnace economics potentially improving with lower scrap costs
- Regional scrap markets developing pricing advantages in specific geographies
Infrastructure Investment Correlation Analysis
Steel production patterns correlate strongly with infrastructure investment cycles:
Government Spending Programmes:
- U.S. infrastructure legislation supporting domestic steel demand (+3.3% growth)
- Indian development programmes driving robust production expansion (+10.5%)
- Chinese policy adjustments reducing infrastructure steel consumption (-13.9%)
Private Sector Construction Activity:
- Commercial construction demand varying by regional economic conditions
- Residential building activity influenced by interest rates and demographic trends
- Industrial facility development driven by manufacturing reshoring initiatives
Infrastructure investment represents the most predictable component of steel demand, making government spending priorities a reliable indicator for production planning and investment decision-making.
The next major ASX story will hit our subscribers first
How Might Steel Production Trends Evolve Through 2026?
Demand Recovery Scenario Modelling
Several factors suggest potential stabilisation or recovery in global steel production:
Positive Recovery Indicators:
- Month-over-month growth of 2.2% from December 2025 to January 2026
- Regional growth markets maintaining expansion trajectories (India, Germany, Middle East)
- U.S. infrastructure spending providing sustained demand support
- Automotive sector stabilisation following supply chain adjustments
Continued Adjustment Factors:
- Chinese market normalisation potentially requiring additional months of adjustment
- European manufacturing challenges limiting broader regional recovery
- Global trade policy uncertainties affecting production allocation decisions
Base case scenarios suggest that the global steel production decline January 2026 may represent peak contraction, with sequential monthly improvements likely throughout the remainder of 2026, particularly as industry evolution trends accelerate technological adoption and efficiency gains.
Supply Chain Optimisation Strategies
Steel producers are adapting operational strategies to navigate production volatility:
Inventory Management Evolution:
- Just-in-time delivery systems reducing working capital requirements
- Strategic stockpiling in regions with expected demand growth
- Flexible supply contracts accommodating production volume variations
Regional Production Networks:
- Geographic diversification reducing market concentration risks
- Local supply chain development enhancing supply security
- Cross-border capacity sharing optimising utilisation rates
Technology Integration Acceleration:
- Digital manufacturing platforms improving production scheduling flexibility
- Predictive maintenance systems reducing unplanned downtime
- Energy management technologies optimising operational cost structures
Technology Integration and Efficiency Gains
The production adjustment period is accelerating technology adoption across the steel industry:
Process Innovation Priorities:
- Electric arc furnace expansion replacing blast furnace capacity
- Hydrogen-based steel production pilot programmes and feasibility studies
- Carbon capture technologies addressing environmental compliance requirements
Operational Efficiency Improvements:
- Artificial intelligence applications for production optimisation and quality control
- Automated materials handling reducing labour costs and improving safety
- Real-time monitoring systems enhancing production control and yield optimisation
Sustainability Initiative Integration:
- Circular economy principles increasing scrap steel utilisation rates
- Renewable energy adoption for steel production processes
- Waste heat recovery systems improving overall energy efficiency
What Strategic Considerations Should Stakeholders Evaluate?
Market Positioning for Recovery Phase
Strategic positioning during the adjustment period determines competitive advantages when demand recovery materialises:
Capacity Expansion Timing:
- Growth market opportunities in India, Germany, and Middle Eastern regions
- Technology upgrade investments during lower utilisation periods
- Strategic acquisitions of distressed assets at attractive valuations
Product Mix Optimisation:
- High-value specialty steels maintaining pricing premiums
- Construction-grade products positioning for infrastructure demand recovery
- Automotive steel grades adapting to electric vehicle requirements
Geographic Market Development:
- Export market penetration leveraging competitive cost structures
- Regional supply agreements securing long-term demand relationships
- Value-added processing capabilities enhancing margin potential
Risk Management in Volatile Production Environment
The global steel production decline January 2026 demonstrates the importance of comprehensive risk management:
Financial Risk Mitigation:
- Commodity price hedging for raw materials and energy costs
- Currency exposure management for international operations
- Working capital optimisation during production volume fluctuations
Operational Flexibility Maintenance:
- Modular capacity design allowing rapid production adjustments
- Multi-product facility configurations diversifying revenue streams
- Strategic inventory positioning balancing carrying costs with supply security
Market Risk Diversification:
- End-use sector balance reducing dependence on single demand sources
- Geographic revenue distribution minimising regional economic exposure
- Customer relationship management maintaining market share during downturns
Long-term Industry Transformation Indicators
Current production patterns reveal accelerating structural changes within the global steel industry:
Decarbonisation Initiative Progress:
- Green steel production technologies becoming economically viable
- Carbon pricing mechanisms influencing production method selection
- Environmental compliance costs affecting competitive positioning
Trade Pattern Evolution:
- Regional supply chain localisation reducing transportation-intensive trade
- Bilateral trade agreements creating preferential market access
- Strategic material classification affecting export and import policies
Technological Disruption Acceleration:
- Digital twin technology revolutionising production planning and control
- Advanced materials development creating new steel grade requirements
- Circular economy integration transforming waste material utilisation
The production adjustments observed in January 2026 represent more than cyclical volatility; they signal fundamental shifts in global steel market structure, demand geography, and competitive dynamics that will shape industry development through the remainder of the decade.
Investment and strategic planning decisions made during this adjustment period will determine competitive positioning when market conditions stabilise and demand growth resumes across major consuming regions.
Looking to Capitalise on Steel Industry Volatility?
Discovery Alert's proprietary Discovery IQ model delivers real-time alerts on significant ASX mineral discoveries, instantly empowering subscribers to identify actionable opportunities ahead of the broader market during periods of global production shifts and commodity price volatility. Begin your 14-day free trial today and secure your market-leading advantage whilst steel sector adjustments create new investment landscapes.

