July 27, 2026
Understanding Global Supply Chain Vulnerabilities in Industrial Metals
The convergence of technological advancement and infrastructure modernization across developed economies has created an unprecedented demand surge for essential industrial materials. This transformation extends far beyond traditional manufacturing cycles, encompassing revolutionary changes in energy systems, digital infrastructure, and transportation networks that require massive material inputs to achieve operational scale.
Economic modelling frameworks indicate that copper and aluminum prices increase 2026 projections reflect fundamental shifts in global resource allocation patterns rather than speculative market movements. The integration of AI in mining operations, renewable energy installations, and electric vehicle production represents a structural transformation requiring material intensity levels significantly higher than previous economic cycles.
When big ASX news breaks, our subscribers know first
Structural Supply Constraints Reshaping Metal Market Dynamics
Mining Development Timeline Challenges
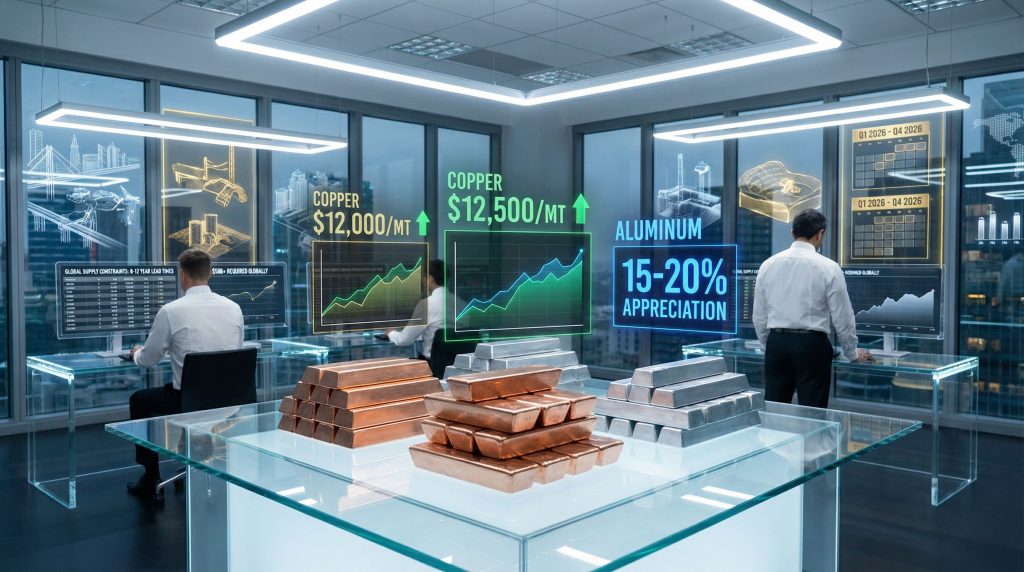
The exploration and development phases for new copper extraction projects typically require 8-12 years from initial geological surveys through production commencement. This extended timeline creates inherent supply inflexibility when demand acceleration occurs, as current production capacity cannot rapidly adjust to market conditions. Aluminum processing facilities face similar constraints, with 6-10 year development cycles for new smelting operations.
Environmental mining permitting processes have become increasingly complex across major producing regions. Chile's water allocation requirements for copper mining operations now include comprehensive environmental impact assessments that extend approval timelines by 18-24 months compared to previous regulatory frameworks. Australian mining projects face enhanced scrutiny regarding Indigenous land rights and biodiversity protection, creating additional regulatory hurdles.
Regional Production Vulnerabilities
Chilean copper production faces significant challenges from water scarcity in the Atacama Desert region, where major mining operations compete with lithium extraction and urban water supplies. The region's annual precipitation averages less than 1mm, making water recycling and desalination critical for continued operations. Mining companies have invested over $2 billion in desalination facilities since 2020, but these projects require 3-5 years for completion.
Chinese aluminum smelting capacity operates under strict energy consumption controls introduced through the country's carbon neutrality commitments. The government has implemented capacity caps limiting aluminum production growth to 2% annually through 2026, while simultaneously requiring smelters to achieve 15% energy efficiency improvements. These policies directly constrain global aluminum supply growth, as China produces approximately 57% of worldwide aluminum output.
Furthermore, Australian mining operations face recurring disruptions from extreme weather events. Cyclone impacts in Queensland and Western Australia have historically reduced iron ore and copper concentrate exports by 10-15% during major weather events. Climate pattern changes suggest increased frequency of such disruptions, creating supply uncertainty for global markets.
Processing Capacity Bottlenecks
Global copper smelting capacity utilisation currently operates at approximately 87% of theoretical maximum, leaving minimal flexibility for demand increases. Scheduled maintenance requirements for aging smelter infrastructure typically remove 5-8% of capacity annually for 2-4 week periods. The average age of global smelting facilities exceeds 25 years, requiring increasingly frequent maintenance cycles.
Quality control standards implemented by major consumers have created processing constraints. Electronics manufacturers now require copper purity levels exceeding 99.99%, compared to 99.9% standards from previous decades. This enhanced purity requirement reduces refining throughput by approximately 12% and increases energy consumption per ton processed.
Technology Infrastructure Driving Unprecedented Material Demand
Data Center Construction Requirements
Global data center capacity expansion requires massive copper installations for power distribution and cooling systems. Each megawatt of data center capacity typically contains 3-4 tons of copper wiring and electrical components. Hyperscale data centers operated by major technology companies average 50-100 megawatts capacity, requiring 150-400 tons of copper per facility.
Artificial intelligence computing infrastructure demands higher power densities than traditional data centers, increasing copper requirements by 40-50% per unit of computing capacity. AI training facilities require specialised cooling systems with enhanced copper heat exchangers and power delivery systems capable of handling variable load patterns.
5G Network Deployment Material Intensity
5G base station installations require approximately 3.5 times more copper content than 4G equipment due to massive MIMO antenna arrays and enhanced power systems. Global telecommunications infrastructure investment exceeded $200 billion annually since 2023, with copper representing 8-12% of total material costs for network equipment.
Small cell deployments necessary for 5G coverage density require fiber optic connections with copper power delivery systems. Urban 5G networks typically require small cells every 300-500 meters, compared to 2-5 kilometre spacing for 4G towers. This density increase multiplies copper requirements for power and connectivity infrastructure.
Electric Vehicle Production Scaling
Electric vehicle manufacturing requires 80-85 kg of copper per vehicle for wiring harnesses, motors, and charging systems, compared to 20-25 kg in conventional vehicles. Global electric vehicle production exceeded 10 million units in 2023 and continues accelerating toward 25-30 million annual production by 2026.
Battery manufacturing facilities require substantial aluminium content for cell casings, thermal management systems, and structural components. Each gigawatt-hour of battery production capacity requires approximately 2,500 tons of aluminium during facility construction and 800 tons annually for battery cell production.
Monetary Policy Transmission Effects on Commodity Markets
Currency Depreciation Impact Mechanisms
Central bank monetary policies create copper and aluminum prices increase 2026 appreciation through multiple transmission channels. Dollar depreciation resulting from expansionary Federal Reserve policies increases commodity attractiveness for international buyers, as metal prices become effectively cheaper in non-dollar currencies. This mechanism typically generates 15-20% additional demand from emerging market consumers during dollar weakness periods.
According to the World Bank's latest analysis, "metal prices are poised to strengthen further as global economic recovery continues and infrastructure investment accelerates across developing economies." This perspective aligns with current copper market trends indicating sustained demand growth.
Real Interest Rate Calculations
Real interest rates below 2% historically correlate with increased institutional allocation to commodity investments as inflation hedges. Current real rates in major economies remain near historical lows, supporting continued commodity investment flows. Professional asset managers typically increase commodity portfolio allocations by 2-4 percentage points when real rates fall below inflation expectations.
Quantitative Easing Liquidity Effects
Quantitative easing programmes inject liquidity into financial systems, with approximately 5-8% of excess liquidity historically flowing into commodity futures markets. This liquidity transmission creates price appreciation independent of fundamental supply-demand balance changes, amplifying underlying trend movements.
Clean Energy Transition Material Requirements
Grid Modernisation Copper Intensity
Electrical grid modernisation projects require extensive copper installations for smart grid infrastructure, energy storage connections, and renewable energy integration systems. Modern transmission lines require 40-60% more copper per kilometre than conventional designs due to enhanced capacity and monitoring systems.
The critical minerals energy transition has created unprecedented demand for essential materials. Utility companies have announced over $150 billion in grid modernisation investments through 2026, with copper representing 12-15% of total project costs. These projects typically require 3-5 years for completion, creating sustained demand patterns rather than cyclical consumption spikes.
Renewable Energy Installation Specifications
Wind turbines contain approximately 3.5 tons of copper per megawatt of generating capacity in wiring, transformers, and grounding systems. Offshore wind installations require 40% additional copper content due to enhanced environmental protection and transmission requirements. Global wind capacity additions exceeded 100 gigawatts annually since 2022.
Solar photovoltaic installations require 4-5 tons of copper per megawatt for wiring, inverters, and grid connections. Utility-scale solar projects also require aluminium mounting systems averaging 15-20 tons per megawatt installed capacity. International solar capacity additions approach 150 gigawatts annually.
Investment Framework Analysis for Metal Price Appreciation
Direct Commodity Exposure Strategies
| Investment Vehicle | Copper Exposure | Aluminum Exposure | Liquidity Rating | Volatility Level |
|---|---|---|---|---|
| Futures Contracts | 100% | 100% | High | High |
| ETF Products | 85-95% | 85-95% | High | Medium-High |
| Physical Storage | 100% | 100% | Low | Low |
| Mining Equities | 60-80% | 60-80% | Medium | High |
Professional investors typically allocate 3-7% of diversified portfolios to commodity exposure during inflationary periods. This allocation provides protection against currency depreciation while maintaining liquidity for rebalancing activities. Commodity investments historically demonstrate negative correlation with traditional equity and bond positions during economic uncertainty periods.
Equity Investment Considerations
Mining company valuations typically trade at 0.8-1.2 times net asset value during normal market conditions. Current valuations for major copper producers average 0.9 times NAV, suggesting moderate undervaluation relative to long-term averages. Aluminum producers trade at similar discounts, reflecting market scepticism regarding sustained price appreciation.
Mid-tier mining companies demonstrate higher operational leverage to commodity price movements, with earnings sensitivity ratios of 3-5x compared to 1.5-2.5x for major producers. This leverage creates enhanced return potential during price appreciation cycles but increases downside risk during market corrections.
The next major ASX story will hit our subscribers first
Risk Assessment Framework for Metal Price Projections
Economic Recession Scenarios
Global economic recession scenarios typically reduce industrial metal consumption by 8-15% during the initial recession phase, followed by 20-30% price declines as inventory liquidation accelerates. However, supply capacity also contracts during recession periods as marginal producers suspend operations, creating potential for rapid price recovery when demand stabilises.
Technology Substitution Risks
Alternative materials development represents a long-term risk to copper demand growth. Aluminium conductor technology improvements have enabled copper substitution in specific electrical applications, though performance limitations prevent widespread replacement. Fiber optic communications reduce copper requirements in telecommunications, but power delivery systems continue requiring copper infrastructure.
Nanotechnology advances in conductor materials remain in research phases, with commercial applications unlikely before 2030. Carbon nanotube conductors demonstrate superior electrical properties but face manufacturing scalability challenges and cost premiums exceeding 1000% compared to copper.
Supply Response Mechanisms
High-grade copper ore reserves represent approximately 15-20% of total known deposits, with remaining reserves requiring increasingly complex extraction and processing techniques. Lower-grade ore processing requires 40-60% additional energy consumption per ton of refined copper produced, increasing production costs and environmental impacts.
Recycling capacity for copper approaches 35% of annual consumption, providing partial supply flexibility during shortages. Aluminium recycling rates exceed 50% in developed economies but require significant energy inputs for reprocessing. Recycling expansion faces limitations from collection infrastructure and energy availability.
Market Timing and Positioning Strategies
Seasonal Demand Patterns
Industrial metal consumption typically peaks during second and third quarters as construction and manufacturing activity increases in northern hemisphere markets. This seasonality creates predictable price patterns, with copper prices averaging 8-12% higher during peak consumption months compared to first quarter levels.
Chinese manufacturing cycles significantly influence global metal demand timing. Lunar New Year production shutdowns in February typically reduce consumption by 20-25% for 2-3 weeks, creating temporary price softness. Post-holiday production resumption generates demand surges that support price appreciation through March and April.
Technical Analysis Indicators
London Metal Exchange inventory levels below 200,000 tons for copper typically correlate with price appreciation phases. Current inventory levels approach 180,000 tons, suggesting market tightness supporting higher prices. Aluminium inventories exceeding 1.5 million tons generally indicate oversupply conditions, while levels below 1 million tons support price stability.
Contango versus backwardation patterns in futures curves provide market sentiment indicators. Backwardation (near-month prices exceeding distant contracts) indicates supply tightness and supports current price levels. Contango patterns suggest adequate supply availability and may pressure near-term prices.
What Are the Key Performance Monitoring Systems?
Effective commodity investment monitoring requires tracking supply-demand balance sheets, inventory changes, and forward curve dynamics simultaneously. Monthly inventory reports from exchanges and industry associations provide early indicators of market direction changes. Production data from major producers typically lag by 30-45 days but offer confirmation of supply trend developments.
Currency correlation analysis helps predict commodity price movements independent of fundamental factors. Dollar strength periods typically create 10-15% headwinds for commodity prices, while dollar weakness provides similar tailwinds. Professional managers adjust position sizing based on currency trend analysis combined with fundamental outlook assessments.
Market analysts at Goldman Sachs forecast that "copper prices may experience volatility in 2026 as supply-side developments compete with sustained infrastructure demand." This analysis complements the global copper supply forecast indicating continued market tightness through 2026.
Consequently, copper and aluminum prices increase 2026 expectations reflect fundamental structural changes rather than speculative market movements. The convergence of technological advancement, infrastructure modernisation, and supply constraints creates a compelling investment thesis for sustained metal price appreciation. However, investors must carefully consider risk factors including economic recession scenarios, technology substitution possibilities, and supply response mechanisms when developing portfolio allocation strategies.
Looking to Capitalise on Industrial Metal Investment Opportunities?
Discovery Alert's proprietary Discovery IQ model delivers real-time alerts on significant ASX mineral discoveries, including copper, aluminium, and other critical metals, empowering subscribers to identify actionable opportunities ahead of the broader market. Begin your 30-day free trial today at Discovery Alert and position yourself to benefit from the next major mineral discovery driving the industrial metals surge.