May 16, 2026
Understanding Global Trade Architecture Vulnerabilities
Maritime commerce operates on a delicate balance of geographic necessities and economic efficiencies. When critical shipping passages experience disruption, the ripple effects extend far beyond immediate transportation concerns, fundamentally altering how goods, energy, and capital flow across continents. The dual chokepoint crisis in global shipping represents one of the most significant systemic risks facing modern supply chains, creating dependencies that become apparent only during crisis periods.
The global shipping network evolved around specific chokepoints due to geographic constraints and historical trade patterns. These narrow passages handle disproportionate volumes of international commerce, creating vulnerabilities that modern supply chains struggle to absorb. Furthermore, the trade war market impact demonstrates how geopolitical tensions amplify these structural weaknesses.
Key Maritime Vulnerability Statistics:
- Strait of Hormuz: 21% of global petroleum liquids transit
- Suez Canal: 12% of global trade by value
- Strait of Malacca: 25% of all traded goods
- Panama Canal: 6% of global trade volume
Source: U.S. Energy Information Administration; International Maritime Organization
Economic Transmission Mechanisms During Disruptions
Supply chain economists have identified multiple pathways through which maritime disruptions propagate across the global economy. These transmission channels operate simultaneously, amplifying initial shocks through interconnected systems. For instance, the tariffs' investment impact illustrates how policy-driven disruptions create similar cascading effects.
Transportation cost increases represent the most immediate impact, but secondary effects often prove more destabilising. Insurance markets respond within hours, freight rates adjust within days, and inventory systems recalibrate over weeks. Each adjustment creates downstream consequences that compound the original disruption.
Route Economics Comparison:
| Shipping Lane | Distance (nm) | Transit Time | Fuel Cost Impact | Capacity Constraints |
|---|---|---|---|---|
| Traditional Suez Route | 11,200 | 14-16 days | Baseline | Normal operations |
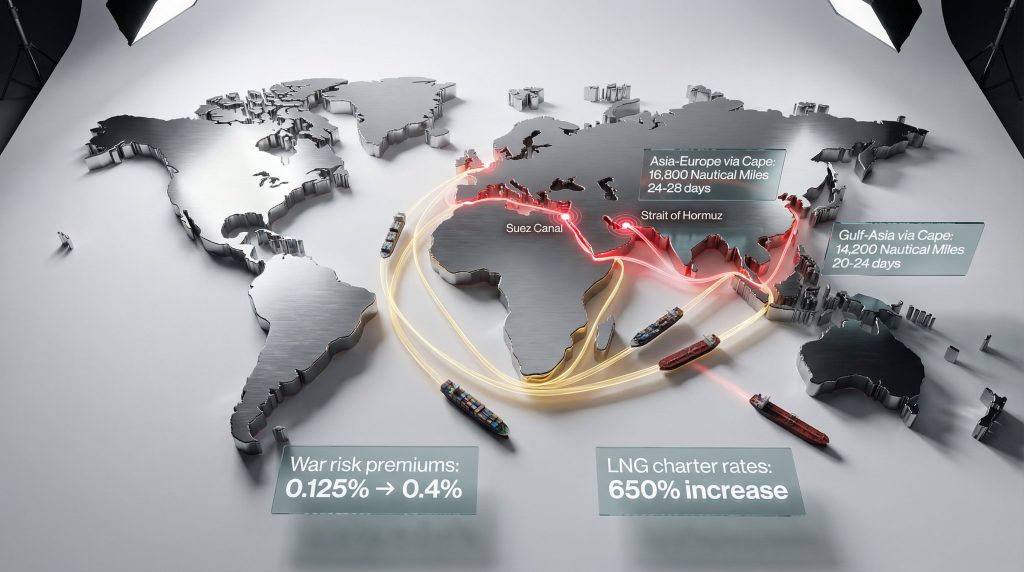
| Cape Diversion | 16,800 | 24-28 days | +40% increase | -25% effective capacity |
| Red Sea Alternative | 13,500 | 18-22 days | +30% increase | -20% effective capacity |
Source: International Maritime Organization; Clarksons Research
When big ASX news breaks, our subscribers know first
Energy Market Response Patterns
Energy markets exhibit the fastest response to maritime chokepoint threats, with price discovery mechanisms that operate continuously across global exchanges. The petroleum complex shows particular sensitivity due to the geographic concentration of production and refining capacity in vulnerable regions. Additionally, oil price volatility during geopolitical tensions demonstrates the interconnected nature of energy and shipping disruptions.
Crude oil pricing incorporates multiple risk factors beyond current supply disruption. Futures markets price in expected disruption duration, potential escalation scenarios, and alternative supply source viability. This forward-looking mechanism often creates price volatility that exceeds the actual physical supply impact.
Petroleum Product Transmission Channels
- Immediate spot markets: Close within 24-48 hours of disruption
- Futures contracts: 30-90 day instruments reprice based on expected duration
- Refined products: Petrol and diesel follow crude with 3-7 day lag
- Regional price divergence: Transportation bottlenecks create location-specific premiums
Historical precedent demonstrates the amplification effect of energy price shocks. During the 1990 Gulf War, oil prices rose from $17 to $42 per barrel within three months. The global maritime chokepoint vulnerabilities analysis shows how these patterns repeat during modern conflicts.
Natural Gas Market Dynamics:
Liquefied natural gas markets operate with less flexibility than crude oil due to specialised transportation infrastructure. LNG carriers cannot easily substitute for oil tankers, and regasification terminals limit destination options.
- Qatar supplies 22% of global LNG exports
- 85% of Qatari LNG exports serve Asian markets
- LNG charter rates can increase 300-600% during disruption periods
- Regional price differentials exceed $20/MMBtu during crisis periods
Source: International Gas Union; GIIGNL Annual Report
Insurance Market Mechanisms
Protection and indemnity insurance functions as the invisible regulatory mechanism that actually controls shipping operations. When insurers withdraw coverage from specific regions, commercial vessels cannot legally operate regardless of physical safety considerations. Moreover, the dual chokepoint crisis in global shipping scenarios create unprecedented insurance market stress.
War risk insurance operates on tiered premium structures that escalate rapidly during geopolitical tensions. Normal peacetime rates of 0.025-0.05% of vessel value can increase to 0.5-2.0% during crisis periods, adding millions in costs per voyage for large vessels.
Insurance Market Structure
Primary Coverage Layers:
- Hull and machinery insurance: Physical vessel protection
- Protection and indemnity: Third-party liability coverage
- Cargo insurance: Freight and commodity protection
- War risk coverage: Geopolitical event protection
Market Response Timeline:
- Initial tension: Premium increases 50-100%
- Active hostilities: Premium increases 300-500%
- Sustained conflict: Complete coverage withdrawal
- Recovery period: 6-12 months for premium normalisation
The 2019 Red Sea crisis demonstrated how insurance markets can effectively close shipping lanes without physical blockades. When Lloyd's of London syndicates stopped writing war risk coverage for the region, commercial traffic dropped 75% within one week.
Insurance underwriters serve as de facto gatekeepers for global commerce, with their risk assessments determining which trade routes remain commercially viable during geopolitical crises.
Financial Market Contagion Effects
Equity markets respond to maritime disruptions through sector-specific channels that reflect relative exposure to transportation costs and supply chain dependencies. Energy companies often benefit from higher commodity prices, while transportation and manufacturing stocks face margin compression from increased operating costs. However, global financial contagion risks amplify these sector-specific impacts across broader markets.
Currency markets reflect differential exposure to trade disruption across economies. Export-dependent nations with significant chokepoint exposure experience immediate pressure, while energy-importing economies face inflation expectations that weaken purchasing power.
Historical Market Response Examples:
- 2019 Hormuz Tension: Oil stocks gained 15%, shipping companies fell 8%
- 2021 Suez Blockage: Container shipping rates increased 400% within one week
- 2022 Black Sea Closure: European energy stocks gained 25% in one month
Bond Market Implications
Fixed-income markets respond to supply shock inflation expectations through Treasury yield curve steepening. Short-term rates remain anchored by central bank policy, while longer-term rates rise to reflect expected inflation persistence.
Credit spreads widen selectively based on sector exposure:
- Transportation companies face immediate margin pressure
- Energy producers benefit from higher commodity prices
- Consumer goods companies experience delayed impact through input costs
- Emerging market sovereigns face currency pressure and capital outflows
Agricultural Input Crisis Development
The fertiliser supply chain represents one of the most overlooked vulnerabilities in dual chokepoint crises. Modern agriculture depends heavily on nitrogen fertilisers derived from natural gas through the Haber-Bosch process, with production concentrated in energy-rich regions.
Gulf states produce approximately 33% of global seaborne urea exports, while natural gas feedstock for ammonia production requires stable energy supply chains. Disruption during Northern Hemisphere planting season creates irreversible agricultural impacts that manifest months later.
Fertiliser Supply Dependencies
Regional Production Concentration:
- Middle East: 40% of global ammonia exports
- Russia: 23% of global urea exports
- China: 28% of global phosphate exports
- North Africa: 15% of global fertiliser trade
Seasonal Vulnerability Windows:
- March-May: Northern Hemisphere spring planting
- September-November: Southern Hemisphere spring planting
- January-February: Fertiliser procurement peak
- June-August: Application for winter crop preparation
Agricultural economists estimate that 10% reduction in nitrogen application results in 6-8% crop yield decline for major grains. These effects become apparent only during harvest season, creating delayed inflationary pressures through food systems.
Air Cargo Capacity Constraints
Airspace restrictions eliminate high-value cargo alternatives precisely when ocean freight becomes unreliable or unavailable. Middle Eastern carriers handle 13.6% of global air cargo capacity, with hub operations that serve intercontinental routes connecting Asia, Europe, and Africa. The dual shipping chokepoint impact analysis reveals how these constraints compound during simultaneous disruptions.
The concentration of air cargo capacity in affected regions creates bottlenecks for time-sensitive goods including pharmaceuticals, electronics components, and perishable products that cannot substitute surface transportation.
Critical Air Cargo Dependencies
Product Categories:
- Pharmaceuticals: Temperature-controlled distribution
- Semiconductor components: Just-in-time manufacturing inputs
- Automotive parts: Global supply chain integration
- Fashion and textiles: Seasonal inventory requirements
Capacity Impact Metrics:
- Middle East hub closure reduces Asia-Europe capacity 40%
- Alternative routing increases transit time 30-50%
- Fuel cost increases of 25-35% for extended routing
- Warehouse capacity constraints at alternative hubs
Source: International Air Transport Association; Airports Council International
The next major ASX story will hit our subscribers first
Supply Chain Resilience Investments
Corporate supply chain strategies evolved following previous disruption events, but dual chokepoint crisis in global shipping scenarios expose the limitations of existing resilience measures. Companies discover that geographic diversification alone cannot compensate for infrastructure bottlenecks.
Just-in-time inventory systems require fundamental recalibration when multiple transportation modes experience simultaneous constraint. Buffer stock policies that seemed excessive during normal operations become inadequate during compound crises.
Strategic Adaptation Mechanisms
Short-term Responses:
- Emergency inventory building at alternative locations
- Premium freight rate acceptance for critical components
- Production schedule adjustments to accommodate delays
- Customer communication regarding delivery timeline changes
Long-term Structural Changes:
- Regional supplier networks: Reducing chokepoint exposure
- Inventory strategy revision: Moving away from just-in-time models
- Transportation diversification: Multi-modal capability development
- Manufacturing relocations: Proximity to end markets
Investment themes emerging from supply chain vulnerability include transportation infrastructure, alternative energy sources, and supply chain technology platforms that provide real-time visibility and adaptive routing capabilities. The US tariff policy effects further complicate these strategic adaptations.
Recovery Timeline and Normalisation Patterns
Physical reopening of shipping lanes does not immediately restore normal commercial operations due to vessel positioning, cargo backlogs, and insurance market adaptation requirements. Recovery follows predictable sequences but varies significantly based on disruption duration and severity.
Recovery Phase Characteristics:
Phase 1 (0-2 weeks post-reopening):
- Vessel repositioning from alternative routes
- Port congestion from backlogged cargo
- Continued elevated insurance premiums
- Spot freight rates remain elevated
Phase 2 (2-8 weeks):
- Gradual freight rate normalisation
- Container equipment rebalancing
- Insurance premium reduction begins
- Supply chain inventory rebuilding
Phase 3 (2-6 months):
- Contract renegotiation incorporating new risk assessments
- Baseline cost structure establishment
- Strategic supply chain modifications
- Policy framework adaptations
Permanent Economic Shifts
Some changes become permanently embedded in global economic structure following dual chokepoint crisis in global shipping events:
- Transportation cost baselines: Higher insurance and fuel costs
- Supply chain redundancy: Increased inventory carrying costs
- Regional trade patterns: Bilateral agreements reflecting vulnerability awareness
- Infrastructure investment: Alternative route development priorities
The 2008 global financial crisis demonstrated how temporary shocks can create permanent behavioural changes in risk management. Similarly, dual chokepoint crises establish new baseline risk assessments that influence corporate and governmental decision-making for years following resolution.
Policy Response Mechanisms
Governmental responses to dual chokepoint crises typically follow escalating intervention patterns, beginning with strategic reserve releases and progressing through trade policy modifications to emergency economic measures.
Strategic petroleum reserve coordination among International Energy Agency members provides limited buffer capacity, but effectiveness depends on reserve levels, release coordination, and market perception of crisis duration.
Monetary Policy Considerations
Central banks face complex trade-offs when supply-driven inflation combines with economic growth threats. Traditional monetary policy tools become less effective when inflation stems from physical supply constraints rather than demand pressures.
Policy Tool Effectiveness:
- Interest rate adjustments: Limited impact on supply-side inflation
- Reserve releases: Temporary price moderation only
- Trade policy waivers: Marginal capacity improvements
- Emergency authorities: Shipping and transportation coordination
The Federal Reserve's dual mandate creates particular challenges during supply shock scenarios, as employment and price stability objectives may conflict when external factors drive both inflation and economic weakness simultaneously.
International coordination becomes essential during dual chokepoint crises, as unilateral responses often prove insufficient to address systemic disruptions affecting multiple economies and transportation networks.
This analysis examines systemic vulnerabilities in global shipping networks and their economic implications. Investment decisions should consider multiple risk factors and consult qualified professionals for specific guidance.
Could Your Investment Portfolio Withstand the Next Major Supply Chain Disruption?
Whilst global shipping vulnerabilities create market uncertainty, Discovery Alert's proprietary Discovery IQ model helps investors identify Australian mineral discoveries that could benefit from supply chain diversification trends. Navigate complex market conditions with real-time insights into ASX mineral discoveries, positioning your portfolio ahead of potential commodity shortages and infrastructure investment themes that emerge during global disruptions.