July 9, 2026
Bull Markets Don't Die on Pullbacks: Reading Gold's 2026 Correction Correctly
Investor psychology has a well-documented tendency to conflate short-term price pain with long-term trend failure. When an asset corrects sharply after a historic run, the narrative machinery shifts quickly, and headlines that once celebrated the rally begin declaring its obituary. Gold remains one of the top-performing assets despite correction pressures in 2026, yet when actual return data is placed alongside historical bull market behaviour, a fundamentally different picture emerges — one that rewards careful analysis over reactive sentiment.
When big ASX news breaks, our subscribers know first
What the Trailing 12-Month Numbers Actually Reveal
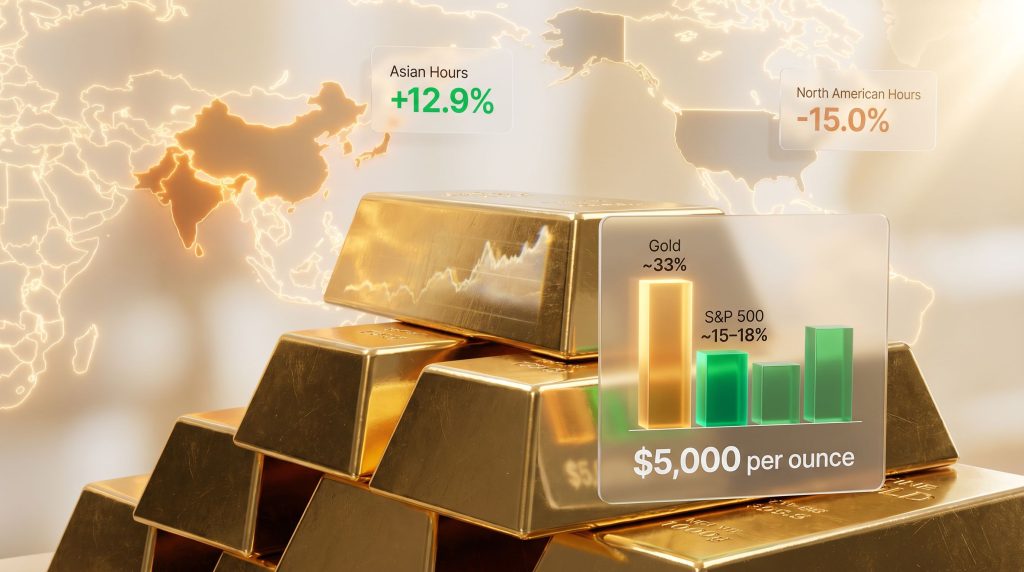
Strip away the noise surrounding gold's 2026 correction, and the performance data over the preceding 12 months tells a story that most mainstream commentary has largely ignored. Gold has delivered approximately 33% in trailing returns to mid-2026, a figure that positions it among the highest-performing major asset classes anywhere in the world during that period. The only category to surpass it has been emerging market equities, which posted returns in the range of 35% to 40%.
To place this in context, consider how gold's performance stacks up against the broader investment landscape:
| Asset Class | Approximate 12-Month Return (to mid-2026) |
|---|---|
| Emerging Market Equities | ~35-40% |
| Gold | ~33% |
| S&P 500 | ~15-18% |
| Cash / Money Market | ~4-5% |
| Investment-Grade Bonds | ~3-5% |
Note: Returns are approximate and reflect broad market performance benchmarks. Past performance is not indicative of future results.
A 33% annualised return achieved during a period of elevated geopolitical tension, aggressive monetary policy positioning, and historic asset volatility is not the signature of a broken market. It is the profile of a structural bull cycle undergoing a normal consolidation phase. Furthermore, framing it otherwise requires selectively ignoring the preceding 11 months of performance in favour of the most recent weeks of price weakness. Independent analysis from Advisor Perspectives reinforces this view, confirming that gold remains among the top-performing assets over the trailing 12-month period.
Unpacking the Anatomy of the 2026 Gold Correction
Why the January Surge Created an Optical Distortion
Understanding the severity of the current drawdown requires understanding what preceded it. Gold entered 2026 with extraordinary momentum, registering 12 consecutive all-time highs across January and breaching the psychologically significant $5,000 per ounce level for the first time in history. This kind of parabolic acceleration compresses the measurement baseline for any subsequent decline, making what might otherwise be a routine retracement appear far more dramatic in percentage terms.
By mid-2026, gold had retreated approximately 28% from those January peaks, with the metal consolidating broadly within the $4,000 to $4,500 per ounce range. When measured from the start of the year rather than from the January peak, the picture shifts considerably: gold was down only around 7% across the first six months of 2026, a far more modest figure than the crisis-level drawdown framing that dominated financial media coverage.
The Three Forces Driving the Pullback
Multiple converging pressures have weighed on gold through the first half of 2026. Each warrants individual examination:
-
Federal Reserve Policy Expectations — Sustained market expectations for tighter monetary conditions have strengthened the U.S. dollar and elevated the opportunity cost of holding non-yielding assets. Gold, which generates no income, becomes relatively less attractive when real yields rise or are expected to rise further.
-
Volatility Compression After an Extreme Spike — Gold's implied volatility surged above 50% in early 2026 before moderating to approximately 30% by mid-year. While this represents meaningful normalisation, current volatility levels remain well above the 20-year historical average of 17%, a dynamic that has deterred certain categories of institutional participation.
-
North American Profit-Taking — Intraday trading analysis reveals that the bulk of gold's price declines during H1 2026 occurred specifically during U.S. trading hours. This geographic concentration of selling pressure is analytically significant, pointing to North American institutional and retail investors as the primary drivers of the correction.
| Volatility Metric | Level |
|---|---|
| Early 2026 Peak Volatility | ~50%+ |
| Mid-2026 Current Volatility | ~30% |
| 20-Year Historical Average | ~17% |
Corrections as a Structural Feature of Bull Markets
One of the most consistently misunderstood dynamics in precious metals investing is the role that deep corrections play within sustained bull markets. Historical analysis of prior gold bull cycles shows that retracements of 20% to 30% from interim highs have occurred multiple times without reversing the underlying upward trajectory. These periods of price discovery and sentiment reset are not anomalies within bull markets; they are recurring features of them.
The absence of corrections within a bull market would be the genuine anomaly. Sustained, uninterrupted price appreciation in any asset class is the exception, not the rule, and gold's history across multi-year bull cycles reflects this reality consistently.
The Structural Bull Case: What Has and Hasn't Changed
Macro Conditions That Drove Gold to Record Highs Remain Firmly in Place
The forces that propelled gold through its historic 2025-2026 advance have not been neutralised by the correction. The gold price outlook continues to be supported by several fundamental dynamics that underpin the structural investment case:
-
Sovereign debt expansion across major economies continues to generate long-term currency debasement pressure, making hard assets increasingly attractive as portfolio insurance
-
Inflation persistence in most developed markets, while cooling from peak levels, remains above central bank targets, sustaining real return anxiety among fixed-income investors
-
Geopolitical fragmentation is deepening rather than reversing, illustrated by the brief but sharp gold price spike triggered by the U.S.-Iran conflict earlier in 2026, which demonstrated gold's continued role as the primary reflexive safe-haven investment during geopolitical shocks
-
De-dollarization momentum is accelerating structurally, with central banks in emerging and developing economies systematically rotating reserve allocations away from U.S. Treasury holdings toward physical gold
One critically underappreciated element within this picture is the interaction between debt levels and interest rate sustainability. A heavily indebted economic system is fundamentally incompatible with prolonged elevated interest rates. As fiscal stress accumulates, the structural probability of an eventual policy pivot toward accommodation increases, and historically, such pivots have served as some of the most powerful catalysts for gold price acceleration.
Central Bank Demand as the Structural Demand Floor
Perhaps the most important but least visible driver of gold's resilience is the ongoing accumulation activity by sovereign reserve managers. Unlike retail or institutional investors who respond to price signals and return optimisation, central banks accumulate gold as a reserve diversification tool. Their demand is largely price-insensitive, driven by long-term strategic objectives rather than short-term market timing.
Central bank gold demand creates a structural demand floor that absorbs selling pressure and limits the depth of any correction. Regulatory shifts in markets like India, which have opened new domestic investment channels for gold, represent additional demand variables that could meaningfully influence pricing trajectories through H2 2026 and beyond.
The East-West Divide Redefining Gold's Market Architecture
Asian Buyers vs. North American Sellers: A Market Split with Major Implications
One of the most analytically significant and least widely discussed dynamics of 2026's gold market is the sharp geographic divergence in investor behaviour. World Gold Council analysis of intraday trading patterns across H1 2026 identified a stark split between the behaviour of North American and Asian market participants.
| Trading Session | H1 2026 Gold Performance |
|---|---|
| Asian Trading Hours | +12.9% |
| North American Trading Hours | -15.0% |
The numbers are striking. During Asian trading hours, gold gained 12.9% through the first six months of the year. During North American hours, it declined 15.0%. Consequently, the conclusion is that gold's correction has been almost entirely a Western-driven phenomenon, with Asian investors systematically absorbing that selling pressure rather than amplifying it.
World Gold Council analysts described Asia as the engine of price support during this period, noting that gold's rebounds through H1 2026 consistently occurred during Asian trading sessions while pullbacks were concentrated in the U.S. session. This dynamic has direct implications for how price floors should be assessed.
Why Asian Investors Are Buying Into the Correction
The divergence in behaviour reflects fundamentally different investment philosophies across geographic markets. In China, India, and across Southeast Asia, gold functions as a long-term store of value embedded within cultural, intergenerational, and monetary frameworks that extend well beyond short-term return maximisation. Asian retail buyers systematically treat price weakness as an accumulation opportunity rather than a signal for exit.
This structural demand orientation means the seller base (North American profit-takers) and the buyer base (Asian accumulators) operate on entirely different time horizons. When these two forces interact at current price levels, the result is a support mechanism that is considerably more durable than traditional technical analysis frameworks might suggest. Indeed, understanding gold in the monetary system helps explain why this eastern accumulation bias is unlikely to reverse in the near term.
The geographic demand asymmetry in 2026 is not merely a short-term trading quirk. It reflects a longer-term structural shift in where gold's centre of gravity sits within the global financial system, increasingly eastward and increasingly anchored in physical rather than paper demand.
Scenario Analysis: Where Gold Goes From Here
The World Gold Council Base Case
Under current macro conditions characterised by moderate economic growth, cooling but still-elevated inflation, and limited additional central bank tightening, analysts at the World Gold Council anticipate that gold will remain broadly rangebound within approximately ±5% of current levels in the near term. The $4,000 to $4,500 per ounce corridor represents the central consolidation zone.
Three Scenarios That Could Break the Range
Scenario 1: Bullish Breakout (Moderate-High Probability)
A deterioration in U.S. economic growth data, a geopolitical escalation triggering safe-haven flows, or a decisive shift in Federal Reserve rate expectations toward easing could reignite upward momentum. Analysts assign approximately a 30% probability to gold retesting the $5,000 per ounce level in H2 2026, with more aggressive forecasts extending toward $6,000 per ounce under extreme macro stress scenarios.
Scenario 2: Extended Consolidation (High Probability)
Resilient U.S. economic data, stable yields, and reduced geopolitical risk premium sustain the current rangebound environment. Gold continues trading between $4,000 and $4,400 per ounce while still outperforming most fixed-income alternatives on a risk-adjusted basis.
Scenario 3: Further Correction (Low-Moderate Probability)
Sustained dollar strength, more aggressive Fed tightening than currently priced, or a significant risk-on equity rally diverting capital flows could extend the drawdown. However, a decline exceeding 10% from current levels is widely expected to trigger meaningful bargain-hunting demand from both Asian retail buyers and central bank accumulators, providing a natural technical support buffer.
Disclaimer: Scenario probabilities and price targets represent analytical frameworks and market commentary, not financial advice. All investment decisions should be made in consultation with a qualified financial professional.
The next major ASX story will hit our subscribers first
Frequently Asked Questions About Gold's 2026 Performance
Is the gold bull market over after the 2026 correction?
No. A 28% correction from peak levels does not constitute a bull market reversal when the structural drivers of the advance, including sovereign debt expansion, central bank accumulation, de-dollarization, and persistent inflation, remain firmly embedded in the global financial architecture. Historical precedent across prior gold bull cycles consistently shows that corrections of this magnitude are normal and are typically followed by renewed upward momentum rather than trend reversals.
How much has gold returned over the past 12 months?
Gold has delivered approximately 33% in trailing 12-month returns to mid-2026, positioning it as the second-best performing major asset class globally, behind only emerging market equities. In other words, gold remains one of the top-performing assets despite correction fears dominating short-term headlines.
What is the current gold price range in mid-2026?
Following its correction from the January 2026 record above $5,000 per ounce, gold has broadly consolidated within the $4,000 to $4,500 per ounce range, with near-term technical support levels between $4,114 and $4,202.
Why are Asian investors buying while Western investors are selling?
Asian investors approach gold primarily as a long-term store of value with deep cultural and monetary roots, rather than as a short-term trading instrument. This orientation drives systematic accumulation during price weakness, while North American investors tend to take profits following periods of strong appreciation. The gold-silver ratio and other relative value metrics further inform Asian strategic positioning decisions.
What could push gold back above $5,000 per ounce?
Key catalysts include deteriorating U.S. growth data, a geopolitical escalation triggering safe-haven demand, a Federal Reserve pivot toward rate cuts, or a significant acceleration in central bank purchase volumes. Analysts assign approximately a 30% probability to gold retesting $5,000 per ounce in H2 2026. For broader context, reporting from the Khaleej Times highlights that market analysts widely believe prices may rally again in the coming months.
Key Takeaways
-
Gold's ~33% trailing 12-month return places it among the top-performing major asset classes globally, despite a steep correction from January 2026 highs
-
The 28% pullback from all-time highs fits squarely within historical bull market correction patterns and does not represent evidence of a structural trend reversal
-
Asian investors are actively defending gold's price floor, absorbing North American profit-taking and generating consistent price rebounds during Asian trading sessions
-
The macro conditions that drove gold to record highs, including debt expansion, inflation persistence, geopolitical fragmentation, and de-dollarization, remain structurally intact
-
Gold is expected to consolidate within the $4,000 to $4,500 range near-term, with credible upside scenarios targeting $5,000 per ounce or higher under the right macro catalysts
-
Central bank demand continues to provide a durable structural floor that limits downside depth regardless of short-term Western investor behaviour
This article is intended for informational purposes only and does not constitute financial advice. Gold and precious metals investments carry risk. Readers should conduct independent research and seek professional financial guidance before making any investment decisions.
Want to Capitalise on the Next Major Gold Discovery Before the Market Catches On?
Discovery Alert's proprietary Discovery IQ model delivers real-time alerts on significant ASX mineral discoveries, instantly transforming complex geological data into actionable investment insights — explore historic discovery returns to understand the potential, then begin your 14-day free trial at Discovery Alert to position yourself ahead of the broader market.