July 9, 2026
The Counterintuitive Economics of Precious Metals During Active Conflict
Most investors enter geopolitical crises with a simple mental model: when wars start, gold prices rise. It is one of the most deeply embedded assumptions in financial markets, repeated across decades of commentary and reinforced by enough historical examples to feel like a natural law. But markets are not governed by natural laws. They are governed by the simultaneous interaction of dozens of competing forces, and when those forces shift in unusual configurations, even the most time-tested relationships can temporarily invert.
That is precisely what has happened in the precious metals market throughout 2026. The gold price and Iran war dynamic that has played out over the past several months represents one of the most instructive case studies in modern commodity market behaviour. Understanding why gold has not behaved the way conventional wisdom predicted reveals far more about how precious metals actually function than any period of straightforward price appreciation ever could.
When big ASX news breaks, our subscribers know first
Gold's All-Time High and the Reversal Nobody Expected
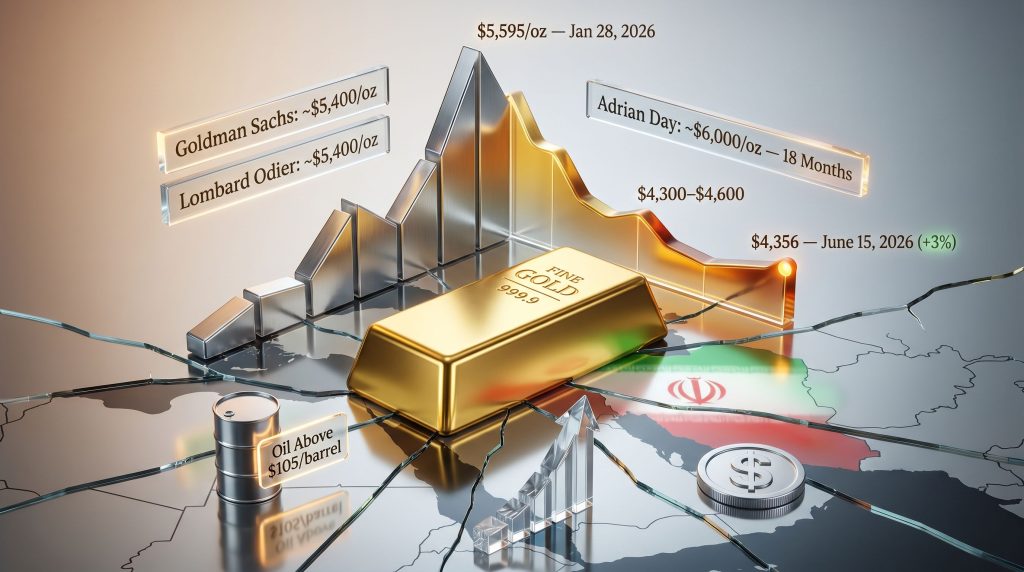
Before examining the current dislocation, it is worth establishing where gold stood before the conflict began. On January 28, 2026, gold recorded an all-time high of approximately $5,595 per ounce, a level that reflected months of accumulated momentum driven by central bank gold demand, dollar uncertainty, and investor appetite for inflation-resistant assets.
When the Iran conflict escalated in late February 2026, the initial market response followed the expected script. A brief surge carried prices toward $5,327/oz, consistent with the classic fear-driven buying that characterises the early phase of geopolitical shock. What happened next, however, defied the standard playbook entirely.
Rather than consolidating those gains and pushing higher as the conflict intensified, gold began a sustained and remarkably orderly decline. By the March-to-May window, prices had drifted into a $4,300 to $4,600 per ounce trading range. More recently, the metal has hovered just above $4,000/oz, representing a drawdown of 10 to 13 percent from the January peak.
Price Timeline: Gold's Journey Through the Iran Conflict
| Date | Event | Gold Price Level |
|---|---|---|
| January 28, 2026 | All-time high recorded | ~$5,595/oz |
| February 28, 2026 | Iran conflict begins; brief initial spike | ~$5,327/oz |
| March to May 2026 | Sustained downward drift | $4,300 to $4,600/oz range |
| June 15, 2026 | US-Iran peace agreement announced | ~$4,356/oz (+3% surge) |
| July 2026 | Ongoing consolidation phase | ~$4,000 to $4,300/oz |
A notably instructive data point emerged on June 15, 2026, when news of a potential US-Iran peace agreement triggered a 3 percent single-day rally to approximately $4,356/oz. That response confirmed something important: gold has not lost its sensitivity to geopolitical developments. It remains acutely reactive to conflict resolution signals, which implies the underlying safe-haven function is intact.
The metal's overall decline during the conflict is therefore not a story of gold losing relevance. It is a story of competing macro forces temporarily overwhelming the geopolitical premium. For a broader perspective on gold safe-haven dynamics during periods of uncertainty, the historical evidence consistently supports this interpretation.
What Is Actually Driving Gold Down During the Iran Conflict
The US Dollar as the Crisis Currency of Choice
When global uncertainty spikes, capital does not automatically flow into gold. It flows into whatever asset the market collectively treats as the most reliable store of value during stress, and in 2026, that designation has largely fallen to the US dollar. Dollar strength directly suppresses gold prices in a mechanical sense because gold is priced in dollars globally. When the dollar appreciates, gold becomes more expensive in other currencies, reducing international demand and applying persistent downward price pressure.
Rising Treasury Yields Competing With Non-Yielding Gold
Gold generates no income. It pays no dividend, no coupon, and no interest. This characteristic, which is irrelevant when yield-bearing alternatives are scarce or unattractive, becomes a significant competitive disadvantage when bond yields rise meaningfully. The relationship between gold and bond yields has historically been one of the most reliable inverse correlations in financial markets.
In 2026, rising Treasury yields have offered investors an increasingly compelling income-generating alternative at a time when capital preservation is paramount. The opportunity cost of holding gold has increased substantially, and institutional allocation models have responded accordingly.
The Energy Shock and the Rate Expectations Feedback Loop
Perhaps the most underappreciated mechanism driving gold lower has been the indirect effect of the energy shock triggered by Strait of Hormuz disruptions. With oil prices trading above $105 per barrel at various points during the conflict, inflation expectations have remained stubbornly elevated.
Elevated inflation expectations, counterintuitively, can be negative for gold in the short term because they force markets to price in prolonged restrictive monetary policy from central banks. Higher-for-longer interest rate expectations amplify the opportunity cost of holding gold, reinforcing the downward pressure already applied by dollar strength and yield competition. As one analysis from DW notes, the interaction between energy prices, inflation, and precious metals in this conflict cycle has confounded many traditional forecasting models.
The Macro Forces Acting on Gold in 2026
| Driver | Direction of Pressure | Mechanism |
|---|---|---|
| Strengthening US Dollar | Negative | Dollar-denominated gold becomes costlier globally |
| Rising Treasury Yields | Negative | Income-bearing assets attract capital away from gold |
| Oil above $105/barrel | Negative | Drives inflation expectations, reinforcing rate hike fears |
| Geopolitical Fear Premium | Positive | Partially offsets the above but insufficient to reverse trend |
| Peace Signal (June 15) | Positive | Demonstrated gold's retained safe-haven sensitivity |
This dynamic illustrates a structural preference for yield-generating assets during periods of economic stress combined with monetary tightening expectations, creating a regime where gold's traditional appeal is temporarily outcompeted rather than fundamentally undermined.
Why the Hormuz Disruption Created an Unusual Gold-Negative Scenario
It is worth dwelling on the Strait of Hormuz factor because it represents a nuanced mechanism that many retail investors overlook. Approximately 20 percent of global oil supply transits the strait, meaning any sustained disruption has immediate and severe consequences for energy markets. The resulting oil price spike creates an inflationary impulse that, in a normal low-rate environment, would be strongly bullish for gold as a hedge against purchasing power erosion.
However, in an environment where central banks are already navigating elevated inflation and are unwilling to ease monetary policy prematurely, the same oil shock instead reinforces the case for keeping rates higher for longer. This creates the paradoxical outcome where an event that historically supported gold actually works against it through the inflation-rate expectations transmission channel.
Scenario Modelling: If the Strait of Hormuz remains partially disrupted and oil sustains above $100 per barrel, central banks face a stagflationary dilemma. Over a 6 to 12 month horizon, this scenario could eventually transition from gold-negative (driven by rate hike fears) to gold-positive (driven by currency debasement concerns), as the limits of monetary tightening become apparent.
Has Gold Lost Its Safe-Haven Function, or Is This a Temporary Dislocation?
This question sits at the centre of the current market debate, and the evidence points clearly toward temporary dislocation rather than structural breakdown. Several historical precedents support this view.
During the early phases of the 2022 Russia-Ukraine conflict, gold initially surged but then gave back significant gains as dollar strength and rising yields reasserted themselves. During the 1990 Gulf War, gold rallied sharply into the conflict onset but declined once the military operation began and markets reassessed the macro environment. The pattern of conflict-onset spike followed by macro-driven reversal is not unprecedented.
What makes 2026 distinctive is the scale of the preceding rally. Gold had already priced in enormous amounts of macro uncertainty before the Iran conflict began. The $5,595/oz all-time high represented a market that had already front-loaded a significant amount of fear and geopolitical premium. Furthermore, when the conflict materialised and the specific macro consequences proved gold-negative rather than gold-positive, the correction from already elevated levels was amplified.
The Structural Demand Story Has Not Changed
Beneath the short-term price action, the fundamental pillars underpinning gold's long-term bull case remain fully intact. Central bank gold accumulation, driven by de-dollarisation strategies among emerging market economies, has continued at historically elevated rates. Countries seeking to reduce their exposure to dollar-denominated reserves have been systematic buyers regardless of price level. This structural demand floor means that the current correction is occurring against a backdrop of genuine, sustained institutional buying.
What Analysts Forecast for Gold Over the Next 12 to 18 Months
Despite the near-term price weakness, analyst consensus for the medium-term outlook remains constructive. The convergence of forecasts from multiple institutions around similar recovery targets is notable. Indeed, the gold price forecast consensus points toward meaningful recovery once macro headwinds begin to ease.
Analyst Price Forecast Comparison
| Institution / Analyst | Price Target | Key Condition |
|---|---|---|
| Lombard Odier | ~$5,400/oz | Conflict de-escalation plus energy price normalisation |
| Goldman Sachs | ~$5,400/oz by year-end | Broader macro stabilisation |
| Adrian Day | ~$6,000/oz within 18 months | Sustained dollar weakness and Federal Reserve rate pivot |
The bull case rests on a specific sequence of macro normalisation. For gold to recover toward prior highs and potentially establish new records, several conditions would need to align:
- US Dollar Index begins a sustained multi-month decline as crisis sentiment fades
- 10-year Treasury yields peak and begin rolling over
- Oil prices normalise below $90 per barrel following conflict resolution
- The Iran conflict moves toward a formal and durable ceasefire
- The Federal Reserve signals a pivot toward monetary easing
- Emerging market central banks resume or accelerate gold accumulation programmes
None of these conditions are implausible. Several are arguably probable over an 18-month horizon, particularly given that the June 15 peace agreement signals created an immediate 3 percent price response, demonstrating how rapidly gold can reprice when macro headwinds begin to ease.
Is the Current Price Level a Strategic Entry Point?
For investors evaluating gold at $4,000 to $4,300 per ounce following a 10 to 13 percent correction from all-time highs, the risk-reward profile presents a fundamentally different calculus than existed at the January peak.
The key analytical question is whether the current drawdown reflects a change in gold's long-term trajectory or simply a cyclical headwind within an ongoing structural bull market. The weight of evidence supports the latter interpretation. In addition, understanding gold's macro response to prior geopolitical and trade-related shocks provides a useful framework for contextualising the current dislocation.
Checklist: Conditions Required for a Gold Re-Rating
- US Dollar Index enters a sustained downtrend
- 10-year Treasury yields peak and reverse
- Oil prices normalise below $90 per barrel
- Iran conflict progresses toward formal ceasefire
- Federal Reserve pivots toward monetary easing
- Emerging market central banks resume gold accumulation
Investors should note that all price forecasts and scenario projections carry inherent uncertainty. Past performance during geopolitical events does not guarantee future outcomes. The analysis presented here reflects market commentary and should not be construed as financial advice.
The current environment rewards investors who can separate short-term macro noise from long-term structural positioning. Gold at these levels has experienced a meaningful compression in its geopolitical premium without any deterioration in the underlying fundamentals that drove it to all-time highs in the first place.
The next major ASX story will hit our subscribers first
Frequently Asked Questions: Gold Price and the Iran War
Why Has Gold Fallen During the Iran War When It Usually Rises in Conflicts?
The primary reason is that the specific macro consequences of this conflict, particularly dollar strength, rising Treasury yields, and oil-driven inflation expectations that reinforce restrictive monetary policy, have proven more powerful than the traditional safe-haven demand response. Gold had also already priced in significant geopolitical risk before the conflict began, with the January 2026 all-time high reflecting extensive pre-existing fear premium.
What Was Gold's Price Before the Iran War Started in 2026?
Gold reached its all-time high of approximately $5,595 per ounce on January 28, 2026, roughly one month before the conflict escalated in late February.
How Much Has Gold Dropped Since the Conflict Began?
From the conflict-onset level of approximately $5,327/oz, gold has declined to approximately $4,000 to $4,300/oz, representing a drawdown of roughly 10 to 13 percent and in some sessions testing just above the $4,000 level.
What Is the Gold Price Forecast for the End of 2026?
Leading institutional forecasts, including those from Goldman Sachs and Lombard Odier, cluster around $5,400/oz by year-end, contingent on macro stabilisation and conflict de-escalation. More aggressive targets reaching $6,000/oz within 18 months have been published under scenarios involving a meaningful Federal Reserve pivot and sustained dollar weakness. However, as Morningstar observes, the gap between near-term price weakness and medium-term recovery targets reflects the unusually complex macro environment surrounding this particular conflict.
Does the Strait of Hormuz Closure Affect Gold Prices?
Yes, but through an indirect and initially gold-negative channel. Hormuz disruptions push oil above $100 per barrel, elevating inflation expectations, which in turn reinforces market pricing for prolonged high interest rates. High rates increase the opportunity cost of holding non-yielding gold. Over a longer horizon, however, the same energy shock could become gold-positive if it contributes to currency debasement concerns or forces central banks into a policy reversal.
Key Takeaways: Understanding Gold's Behaviour During the Iran Conflict
- Gold hit a record high of $5,595/oz on January 28, 2026, before the Iran conflict began in late February
- Since the war's onset, the gold price and Iran war relationship has seen gold decline 10 to 13 percent, trading primarily in the $4,300 to $4,600 range and recently testing near $4,000/oz
- Three macro forces, specifically dollar strength, rising Treasury yields, and oil-driven rate expectations, have overridden traditional safe-haven demand
- A 3 percent single-day rally on June 15, 2026 following peace agreement signals confirmed that gold retains its sensitivity to de-escalation catalysts
- Medium-term analyst consensus targets $5,400 to $6,000/oz, contingent on conflict resolution and macroeconomic normalisation
- The current price weakness reflects a liquidity and yield preference cycle, not a permanent structural rejection of gold's store-of-value function
- The de-dollarisation trend among emerging market central banks continues to provide a structural demand floor beneath short-term price volatility
Readers seeking ongoing analysis and expert perspectives on the gold price and Iran war relationship, precious metals forecasting, and broader macro commentary can explore the extensive editorial coverage published at Gold-Eagle.com, one of the longest-running dedicated gold market research platforms available online.
Want to Be First When the Next Major Precious Metals Discovery Hits the ASX?
Discovery Alert's proprietary Discovery IQ model scans ASX announcements in real time, instantly converting complex mineral data across 30-plus commodities into clear, actionable insights — so subscribers can identify high-potential opportunities well ahead of the broader market. Explore historic examples of exceptional discovery returns and begin your 14-day free trial today to position yourself at the forefront of the next major find.