June 17, 2026
When the Crowd Turns Bearish, the Smart Money Gets Busy
Precious metals markets have a well-documented habit of punishing consensus thinking. History repeatedly shows that peak pessimism in gold and gold mining stocks tends to precede some of the most explosive rallies in the sector. When sentiment reaches extreme lows and technical signals converge simultaneously, experienced analysts treat the alignment not as coincidence but as a high-probability setup. That is precisely the environment that formed around the $4,000 to $4,100 price zone in mid-2026, and the subsequent surge toward $4,700 is now raising a question with major implications for portfolio construction: is this the end of the rally, or the beginning of something far larger?
For investors asking whether the phrase gold 4700 mining stocks party time reflects genuine structural momentum or just short-term euphoria, the answer requires examining the technical architecture, the macroeconomic backdrop, and the often-overlooked leverage mechanics that separate mining stock performance from physical gold ownership.
When big ASX news breaks, our subscribers know first
The Technical Architecture Behind the $4,700 Target
How Professional Analysts Identified the Buy Zone
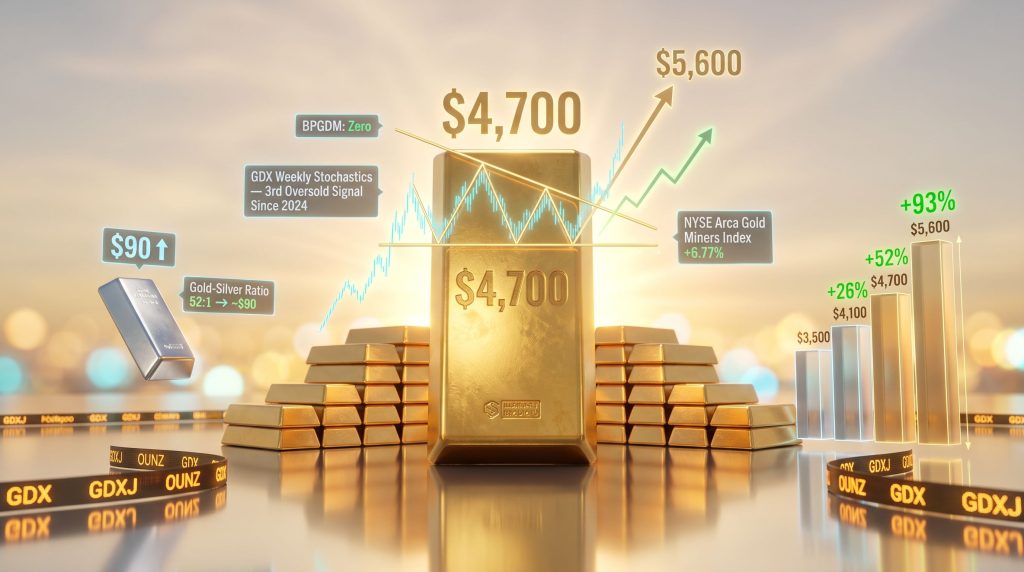
The Bullish Percent Gold Miners Index (BPGDM) is one of the least discussed but most powerful sentiment tools available to precious metals investors. It measures the percentage of gold mining stocks currently generating point-and-figure buy signals. When that reading hits zero, it means virtually every stock in the gold mining universe is on a technical sell signal simultaneously, a state of collective capitulation that has historically marked major cyclical lows.
That is exactly what occurred as gold drifted into the $4,000 to $4,100 zone. The BPGDM reached zero at the same moment that two additional momentum indicators confirmed exhaustion of selling pressure:
- The RSI (14-period) entered oversold territory on the daily chart
- The Stochastics oscillator (14,7,7 series) simultaneously confirmed oversold conditions
- The MACD (20,40,10 series) began showing positive divergence, signalling that bullish momentum was building beneath the surface
The combination of all three oscillators reaching extreme readings at the same price level is a rare technical event. When overlaid with the inverse Head and Shoulders (H&S) pattern visible on the hourly gold chart, the picture became unusually clear: the pattern's measured move projected a target of approximately $4,700. The gold price forecast emerging from this confluence of signals is therefore grounded in measurable technical evidence rather than speculation.
Table: Technical Indicator Alignment at the $4,000 to $4,100 Buy Zone
| Indicator | Signal Type | Reading at Buy Zone | Implication |
|---|---|---|---|
| BPGDM | Sentiment Index | Zero | Extreme bearish sentiment, contrarian buy signal |
| RSI (14-period) | Momentum Oscillator | Oversold | Potential reversal zone |
| Stochastics (14,7,7) | Momentum Oscillator | Oversold | Selling pressure exhaustion confirmed |
| MACD (20,40,10) | Trend Confirmation | Positive divergence | Bullish momentum building beneath the surface |
| Inverse H&S Pattern | Chart Formation | Completed | Projects $4,700 price target |
Beyond the oscillators, the $4,700 level carries additional significance: it sits along a multi-month downtrend line that many technical analysts have been tracking closely. A confirmed break above that line would trigger what traders call breakout-buying cascades, pulling in systematic and momentum-driven funds that had previously avoided the sector.
The OUNZ ETF (a physically-backed gold ETF) was simultaneously forming a textbook bull wedge pattern on its daily chart, providing a corroborating signal across different instruments tracking the same underlying asset.
The Geopolitical Catalyst and Why It Strengthened, Not Weakened, the Bull Case
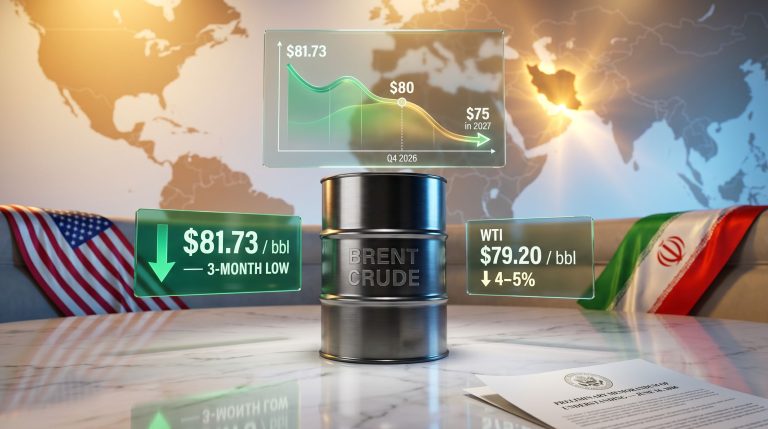
The resolution of the Iran conflict removed a significant risk premium from global energy markets, triggering a meaningful decline in oil prices. For most commodities, reduced geopolitical tension is interpreted as bearish. Gold, however, is different.
When Strait of Hormuz access was under threat, Asian economies faced serious disruption to energy supply chains. The reopening of these trade corridors is genuinely transformative for Asian economic growth, particularly across China, India, and Southeast Asia, where hundreds of millions of consumers represent the structural backbone of global physical gold demand. The logic chain is straightforward: restored trade flows support Asian economic expansion, and rising middle-class wealth in Asia historically translates into accelerating demand for gold jewellery, savings instruments, and investment products.
When geopolitical uncertainty resolves in a way that restores economic activity for the world's largest gold-consuming populations, the effect is not bearish for gold. It removes a temporary risk premium while reinstating a far larger structural demand engine.
Simultaneously, declining oil prices created a dynamic that most market commentators overlooked. Falling energy costs feed directly into core inflation metrics, which in turn shifts the Federal Reserve's policy calculus. Under the leadership priorities of incoming Fed Chair Kevin Warsh, a rate cut scenario that was previously dismissed by consensus began re-emerging as a plausible near-term outcome. Lower real interest rates are structurally positive for gold, since gold carries no yield and therefore becomes relatively more attractive as the opportunity cost of holding it declines.
Is $4,700 the Midpoint, Not the Ceiling?
The Structural Bull Case for Gold Beyond Current Levels
Technical analysis provides the timing framework, but the durational argument for gold rests on four macro forces that operate on multi-year time horizons:
- Persistent inflation pressures across services, housing, and wages continue even as headline CPI figures moderate, maintaining the real-return argument for holding gold
- Sovereign debt accumulation at the US federal level, combined with debt ceiling dynamics and a global debt-to-GDP trajectory that has no historical precedent, creates a long-term currency debasement environment
- Equity market overvaluation, particularly in AI-driven technology sectors, creates a systemic rotation risk where capital eventually seeks the comparative stability of hard assets
- Empire transition dynamics, the gradual erosion of US dollar reserve currency dominance, a process that unfolds across decades and generates sustained, non-cyclical demand for non-sovereign stores of value
Analyst projections emerging from technical measurements and structural analysis suggest the current cycle could extend well beyond $4,700, with price targets in the $5,600 and higher range if these macro forces compound. Critically, these four drivers do not need to peak simultaneously to sustain a bull market in gold. Each operates independently, creating a layered demand structure that supports prices across different market regimes.
Bear Scenario Stress Testing: Where Could the Rally Stall?
Responsible portfolio construction requires equal attention to adverse outcomes. Furthermore, several scenarios could cap or reverse the rally:
- A hawkish Federal Reserve surprise, such as a rate hike under new leadership, would strengthen real interest rates and create headwinds for gold
- A sustained stabilisation of the US equity market, removing the rotation pressure from overvalued stocks into hard assets
- A technical pullback to the next key support zone at $3,900 if the inverse H&S projection fails to hold
- A deflationary shock driven by demand destruction that simultaneously strengthens the US dollar and reduces the inflation premium embedded in gold prices
Risk Warning: Price trajectories in precious metals are never linear. Investors who do not stress-test their portfolios against a pullback to $3,900 or below expose themselves to disproportionate drawdown risk, particularly in leveraged or concentrated positions in junior mining stocks.
Table: Scenario Analysis for Gold Mining Stocks
| Scenario | Gold Price Trajectory | Mining Stock Implication | Primary Driver |
|---|---|---|---|
| Bull Case | $4,700 to $5,600+ | Significant outperformance, junior miners lead | Fed rate cuts, Asian demand, equity rotation |
| Base Case | $4,700 consolidation | Moderate gains, sector digests rally | Policy uncertainty, range-bound oil |
| Bear Case | Pullback to $3,900 | Sector correction, juniors hit hardest | Hawkish Fed surprise, equity stabilisation |
| Tail Risk | Below $3,500 | Significant drawdown, cost-squeeze for high-AISC miners | Deflationary shock, USD surge |
The Operating Leverage Equation: Why Mining Stocks Amplify Every Move
Understanding Margin Expansion at Higher Gold Prices
The relationship between gold and mining equities is not linear — it is exponential at the margin level. This is because gold mining operations carry a substantial base of fixed costs in labour, energy, equipment, and capital servicing. Once the gold price exceeds these fixed costs and the variable all-in sustaining cost (AISC), every additional dollar of price appreciation flows almost entirely to the bottom line.
A simplified but instructive way to see this is through margin analysis across gold price scenarios:
Table: Gold Price Scenarios and Estimated Miner Margin Expansion
| Gold Price Level | Estimated AISC (Industry Average) | Margin Per Ounce | Margin Expansion vs. Baseline |
|---|---|---|---|
| $3,500 | ~$1,400 | ~$2,100 | Baseline |
| $4,100 | ~$1,450 | ~$2,650 | +26% margin expansion |
| $4,700 | ~$1,500 | ~$3,200 | +52% margin expansion |
| $5,600 | ~$1,550 | ~$4,050 | +93% margin expansion |
Note: AISC estimates are illustrative industry averages. Individual miner costs vary significantly based on deposit grade, jurisdiction, depth, and processing complexity.
This operating leverage is the fundamental reason a 10% rise in the gold price can theoretically translate into a 30 to 50% rise in free cash flow for producers operating near industry-average cost structures. The mechanism also explains why mining stocks, as represented by the GDX ETF, attracted sharp attention when the NYSE Arca Gold Miners Index gained 6.77% in a single week while gold futures reached $4,086.50, a relative strength ratio that signalled sector momentum was accelerating faster than the underlying metal.
The Historical Warning: GDX vs. GLD Over the Long Term
Despite the compelling leverage argument, investors must confront a sobering long-term data point. From 2006 to 2025, GDX underperformed GLD by approximately 350% on a cumulative basis. This gap was driven by cost inflation that eroded margins during periods of flat or declining gold prices, capital allocation decisions that prioritised production growth over shareholder returns, dilutive equity raises, and management quality differentials.
The current cycle may offer a different outcome. Post-2016 industry rationalisation significantly reduced the cost base of major producers, balance sheets are stronger than at any point in the previous bull cycle, and capital discipline has replaced production growth as the primary metric for management performance evaluation. Whether this structural improvement is sufficient to close the historical performance gap remains the central question for mining equity investors.
The GDX and GDXJ Charts Are Sending Rare Signals
Weekly Stochastics: A Signal That Has Only Appeared Twice Since 2024
On the GDX weekly chart, the Stochastics (14,5,5 series) recently reached oversold territory. Notably, this has occurred only twice previously since 2024, and both prior instances preceded substantial rallies in GDX and its component stocks. The statistical rarity of this signal, combined with the daily chart showing a bull wedge formation with RSI, Stochastics, and MACD all simultaneously pointing higher, creates what technical analysts describe as a multi-timeframe confluence setup.
An important nuance worth understanding: the weekly oscillators do not need to be at extreme oversold levels for significant rallies to begin in gold mining stocks. The daily and hourly chart signals, when sufficiently strong, can initiate moves that the weekly chart then confirms in retrospect. This subtlety distinguishes experienced technical analysts from those who apply oversold-only entry rules mechanically.
Junior Miners: Highest Beta, Highest Risk
The GDXJ ETF, which tracks smaller and mid-tier gold producers alongside explorers, typically exhibits the highest sensitivity to gold price movements within the mining equity universe. In a confirmed bull cycle, junior miners can deliver multiples of the returns generated by major producers. The asymmetric upside, however, comes with asymmetric downside risk that many retail investors underestimate.
Key risks specific to junior and exploration-stage companies include:
- Cash burn during exploration phases when no revenue is being generated against ongoing operating costs
- The permitting risks and regulatory delays that extend project timelines by years, consuming capital and diluting shareholders
- Dilutive equity raises at depressed valuations that mechanically destroy per-share value even when the underlying asset is appreciating
- Management execution risk at smaller companies where a single poor decision on mine design, metallurgy, or capital allocation can permanently impair a project
- Liquidity constraints that prevent investors from exiting positions at desired prices during sudden market downturns
Silver: The Leveraged Companion to the Gold Move
Structural Positioning for the $90 Target and Beyond
Silver occupies a unique position in the precious metals hierarchy. Unlike gold, which derives its value primarily from monetary and reserve functions, silver carries a dual identity as both a monetary metal and an industrial input with significant demand from solar energy manufacturing, electronics, and electrification infrastructure. This dual demand profile gives silver its own fundamental support structure beneath any gold-driven price movements.
The $70 to $60 zone was identified by analysts as a structurally significant accumulation range for silver investors. With gold approaching the $4,700 target, the $90 level for silver becomes a natural technical convergence point. Furthermore, the gold-silver ratio provides a useful valuation framework for understanding whether silver is cheap or expensive relative to gold at any given price level.
Table: Gold-Silver Ratio Analysis at Key Price Levels
| Gold Price | Silver at 52:1 Ratio | Silver at 45:1 Ratio | Strategic Implication |
|---|---|---|---|
| $4,100 | ~$79 | ~$91 | Silver approaching fair value |
| $4,700 | ~$90 | ~$104 | Silver at or above $90 convergence target |
| $5,600 | ~$108 | ~$124 | Silver testing $120 area or higher |
The bull case for silver above $90 does not simply rest on gold's upside. If the $4,700 gold target holds and consolidates, a strong case can be made that silver's next major resistance level — the prior highs in the $120 area — becomes a plausible medium-term target rather than a speculative outlier.
The next major ASX story will hit our subscribers first
Asian Demand: The Underappreciated Engine of the Gold Bull Market
Why Eastern Flows Are Diverging from Western Sentiment
One of the most significant and underreported developments in gold markets is the divergence between Asian and Western gold ETF flows. Asian gold ETFs have continued to add holdings even as US and European funds have experienced net outflows, a trend tracked and reported by Frank Holmes at US Global Investors and published on Gold-Eagle.com. This geographic divergence in capital flows signals a fundamental shift in where gold market leadership is originating.
Western paper gold sentiment, which tends to be highly reactive to US interest rate expectations and equity market performance, is increasingly less representative of the total demand picture. Central bank gold accumulation by Asian sovereign institutions, particularly as part of broader de-dollarisation strategies, represents a form of demand that is structurally insensitive to short-term price volatility or Fed policy shifts.
The feedback loop connecting geopolitical stability in the Middle East to Asian gold demand is more direct than most Western analysts acknowledge. Restored Strait of Hormuz access stabilises energy costs for Asian economies. Lower energy costs support manufacturing margins and consumer spending power. Rising household wealth in Asia's growing middle class translates directly into increased physical gold purchases for jewellery, gifting, and savings — the cultural and economic foundations of the world's largest physical gold market.
Building a Gold Mining Portfolio for the $4,700 Era
Allocation Framework Across the Mining Spectrum
A structured approach to gold mining equity exposure typically involves distributing capital across three distinct tiers based on risk tolerance and return objectives:
- Major producers offer the most stable earnings, meaningful dividend potential, and lower volatility relative to gold price moves. Their primary appeal is capital preservation alongside moderate participation in gold price upside
- Mid-tier producers represent the analytical sweet spot for many professional investors, combining operational credibility and proven mine plans with genuine leverage to gold price appreciation
- Junior explorers and developers offer the highest potential returns but demand strict position sizing, deep due diligence on geological quality and management capability, and the discipline to accept that many positions will underperform
Liquid ETF instruments including GDX (major producers), GDXJ (juniors and mid-tiers), and physically backed gold ETFs such as OUNZ provide accessible, diversified proxies for investors who prefer not to select individual stocks. Understanding the broader gold-stock market relationship is also essential context when constructing a portfolio during secular bull cycles. The bull wedge forming on the OUNZ daily chart provides a technically actionable reference point for setting entry levels and risk management parameters, including where to position stop-loss orders relative to the lower boundary of the wedge formation.
Frequently Asked Questions
Is $4,700 Gold a Realistic Target or Speculative Projection?
The $4,700 figure is derived from a specific technical measurement: the inverse Head and Shoulders pattern on the hourly gold chart produces a measured move that targets approximately that price level. This is a standard technical analysis methodology, not a speculative forecast. That said, technical targets are probabilistic, not deterministic.
Fundamental support for the level includes the convergence of monetary policy uncertainty, sovereign debt dynamics, and structurally elevated Asian demand. Previous gold bull cycles, including the 2001 to 2011 cycle that took gold from approximately $250 to $1,920, demonstrate that price targets which appear ambitious at the early-to-mid cycle stage are frequently validated and exceeded. Consequently, gold 4700 mining stocks party time may represent a milestone rather than a ceiling for this cycle.
What Is the BPGDM and Why Does a Zero Reading Matter?
The Bullish Percent Gold Miners Index tracks the proportion of gold mining stocks generating point-and-figure buy signals at any given time. Point-and-figure charting is a methodology that filters out minor price noise and captures only significant directional moves.
When the reading reaches zero, it means the collective weight of technical evidence across the entire sector is uniformly negative — a state of maximum pessimism that has historically corresponded to major price lows and the onset of significant recovery rallies. Used in conjunction with RSI and Stochastics oscillators, a BPGDM reading of zero represents one of the highest-conviction contrarian buy signals available in precious metals analysis. For more context on how miners behave following such signal extremes, broader market commentary provides useful perspective.
How Does Silver Fit Into a Gold-Focused Strategy?
Silver's dual role as a monetary and industrial metal gives it a different return profile to gold across the stages of a bull cycle. In early stages, gold tends to lead. In later stages, however, silver frequently outperforms significantly as industrial demand compounds monetary demand.
The gold-silver ratio, currently above its long-term historical average, suggests silver remains undervalued relative to gold on a ratio basis. Appropriate allocation sizing depends on individual risk tolerance, but silver exposure is generally treated as a higher-beta complement to core gold holdings rather than a substitute.
What Macro Conditions Would Push Gold Beyond $5,600?
An accelerated Federal Reserve rate-cutting cycle combined with continued fiscal expansion is the most direct catalyst. Additional accelerants include meaningful US dollar weakening driven by debt ceiling resolution failure or sovereign credit concerns, escalation of central bank de-dollarisation trends among BRICS-aligned institutions, and a significant correction in overvalued equity markets that triggers broad reallocation into hard assets.
Any combination of two or more of these factors occurring simultaneously would create the conditions for a move that exceeds current analyst projections. In that scenario, gold 4700 mining stocks party time would mark merely the opening act of a much larger structural repricing.
Disclaimer: This article is for informational and educational purposes only. It does not constitute financial advice, investment recommendations, or a solicitation to buy or sell any securities or financial instruments. All price targets, technical projections, and scenario analyses referenced herein involve forecasts and assumptions that may not be realised. Past performance of gold, silver, or mining equities is not indicative of future results. Investors should conduct their own research and consult with qualified financial advisors before making any investment decisions. Leveraged or concentrated positions in mining equities carry significant risk, including the possibility of total loss of capital.
Want To Capture the Next Major ASX Gold Discovery Before the Market Moves?
Discovery Alert's proprietary Discovery IQ model scans ASX announcements in real time, instantly identifying significant mineral discoveries and translating complex data into actionable insights — so subscribers are positioned ahead of the broader market the moment a major find is announced. Explore historic discoveries and their returns to understand the scale of opportunity, then begin your 14-day free trial at Discovery Alert to secure your market-leading edge during what could prove to be one of the most consequential gold cycles in a generation.