July 14, 2026
When Monetary Systems Crack, Gold Remembers
Every few decades, the architecture of the global monetary system shifts in ways that expose fundamental fragilities. These shifts do not announce themselves with clarity. They arrive gradually through distorted yield curves, swelling central bank balance sheets, and currencies that quietly lose their purchasing power against hard assets. Investors who recognise these transitions early tend to benefit most from what follows.
The gold bull market in 2020 was not born in that year. Its foundations were assembled over several years of accumulating monetary imbalance, and the pandemic simply provided the catalyst that compressed what might have been a multi-year repricing into a single, extraordinary calendar year. Understanding why gold reached $2,067 per ounce on an intraday basis in August 2020 requires examining the structural architecture beneath the price, not merely the headlines that surrounded it.
When big ASX news breaks, our subscribers know first
The Macro Engine That Powered Gold's Record Run
When Real Yields Turn Negative, Gold Becomes a Rational Choice
The single most important variable driving the gold bull market in 2020 was the collapse of real interest rates into deeply negative territory. When the U.S. Federal Reserve slashed its benchmark rate to effectively zero in March 2020 and simultaneously committed to purchasing $120 billion in assets per month through its quantitative easing programme, the opportunity cost of holding gold vanished almost overnight.
Gold produces no yield. In a normal interest rate environment, that is a structural disadvantage. However, when inflation expectations exceed nominal interest rates, real yields turn negative, and gold's lack of yield becomes irrelevant. In 2020, the real yield on 10-year U.S. Treasury Inflation-Protected Securities (TIPS) fell to approximately -1.08% by August 2020, a level that historically correlates strongly with gold price appreciation.
The defining driver of sustained gold bull markets is not fear of conflict. It is the erosion of confidence in fiat currency systems and the disappearance of a credible yield alternative. When real rates go negative, gold is not speculative, it is logical.
Compounding this dynamic was the sharp weakening of the U.S. dollar from July 2020 onward. The DXY Dollar Index fell roughly 10% between late March and year-end 2020, providing a secondary amplification effect for gold priced in USD terms. Since gold is denominated in dollars globally, a weaker dollar mechanically inflates the gold price and simultaneously makes it cheaper for non-U.S. buyers, further stimulating demand. Furthermore, gold's role in the global monetary system reinforces why these currency dynamics carry such lasting significance.
Five Phases of Gold's 2020 Price Journey
From $1,515 to $2,067: A Structured Breakdown of the Year's Price Action
Gold's 2020 trajectory was far from linear. It moved through five structurally distinct phases, each driven by different market forces.
| Market Phase | Period | Price Movement | Primary Driver |
|---|---|---|---|
| Pre-Pandemic Bullish Run | Jan – Mid-Feb 2020 | $1,515 to $1,604 (+5.9%) | Accommodative monetary policy, early virus signals |
| Initial Pandemic Surge | Feb 20 – Mar 6, 2020 | $1,604 to $1,684 (+5.0%) | Equity collapse, central bank emergency signalling |
| Liquidity Crisis Selloff | Mar 6 – Mar 19, 2020 | $1,684 to $1,474 (-12.5%) | Forced asset liquidation, cash hoarding |
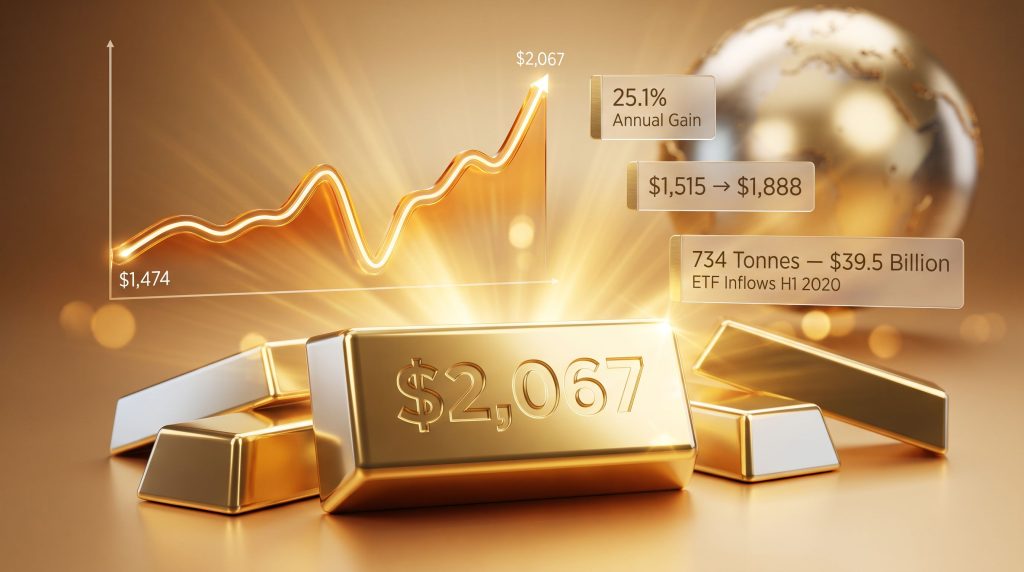
| Super-Rally Phase | Mar 19 – Aug 6, 2020 | $1,474 to $2,067 (+40.2%) | Stimulus wave, safe-haven ETF demand, dollar weakness |
| Consolidation Period | Aug – Dec 2020 | $2,067 to ~$1,888 | Currency debasement concerns, COVID resurgence |
Why the March Crash Was a Signal, Not a Warning
The mid-March selloff to $1,474 per ounce confused many investors who expected gold to behave as a pure safe-haven in times of acute stress. What actually occurred was a global liquidity crisis. As equities cratered and margin calls mounted across portfolios, fund managers sold whatever was liquid, including gold, to raise cash. This is a well-documented pattern in severe financial dislocations, where correlations between asset classes temporarily converge toward one as investors scramble for dollars.
For investors familiar with gold's cycle behaviour, that selloff represented one of the more structurally compelling entry points of the decade. The subsequent 40.2% rally over 4.5 months from the March trough to the August peak was among the most concentrated upward moves in gold's post-decontrol history. You can review gold's price history highs and lows in detail to place this move within its broader long-run context.
By year-end, gold had gained 25.1% for the 2020 calendar year, closing at approximately $1,888 per ounce. That represented its strongest annual performance in roughly a decade, outpacing most major asset classes during the most economically disruptive year since the Global Financial Crisis.
The Geopolitical Myth: Why Headlines Don't Drive Long-Term Gold Trends
Uncertainty Matters More Than Conflict
One of the most persistent misconceptions about gold pricing is the belief that geopolitical conflict is a reliable price driver. The historical record tells a more nuanced story. Consider the following data points:
- January 1980: Gold reached approximately $850 per ounce at precisely the moment the Soviet Union invaded Afghanistan. Rather than sustaining momentum, that geopolitical shock marked the cycle peak, and gold then fell from above $800 to below $300 per ounce by early 1985, despite persistent Cold War tensions throughout the period.
- September 2011 to December 2015: Gold declined from near $1,900 per ounce to approximately $1,000 per ounce across a period widely characterised by Middle Eastern instability, the European debt crisis, and ongoing geopolitical disruption globally.
- Post-9/11 spike (2001): Gold registered only a brief reaction before resuming its gradual upward repricing, which was driven not by the terror attacks but by deteriorating U.S. fiscal conditions.
The lesson is clear: geopolitical events create short-term price noise, but sustained directional moves in gold are dictated by monetary and fiscal fundamentals. Investors who buy gold purely on conflict headlines risk entering at cycle peaks rather than structural lows.
The more reliable framework distinguishes between trouble, which is episodic and geographically bounded, and economic uncertainty, which is systemic and affects the purchasing power of money itself. It is the latter that fuels sustained gold bull markets. In addition, understanding gold's secular market cycles provides a deeper lens through which to interpret these recurring dynamics.
Gold's Long Cycle: Where 2020 Sits in a 50-Year Framework
Mapping the Major Bull and Bear Cycles Since Decontrol
Gold's price history since the early 1970s, when the Bretton Woods system collapsed and gold began trading freely, reveals a clear pattern of extended cycles that operate largely independent of short-term news events. Exploring what history's bull markets teach investors further illuminates these long-run patterns.
| Cycle | Period | Price Range | Primary Driver |
|---|---|---|---|
| First Major Bull Market | 1971 to 1980 | $35 to ~$850/oz | Nixon shock, fiat currency anxiety, inflation |
| Extended Bear Market | 1980 to 2001 | $850 to ~$260/oz | Fiscal consolidation, strong dollar, low inflation |
| Second Major Bull Market | 2001 to 2011 | $260 to ~$1,900/oz | GFC stimulus, European sovereign debt crisis |
| Mid-Cycle Bear Market | 2011 to 2015 | $1,900 to ~$1,000/oz | Perceived economic normalisation, dollar strength |
| Third Bull Market Phase | 2015 to 2020+ | $1,050 to $2,067/oz | Renewed uncertainty, pandemic stimulus, ETF demand |
One of the most instructive details in this table is the 21-year bear market that followed the 1980 peak. Gold did not return to its January 1980 highs until early 2008, nearly three decades later. This precedent carries an important warning for investors who entered the 2020 rally expecting it to continue indefinitely.
Notably, the parallel between gold's 1970s bull market and Bitcoin's 2017 peak near $20,000 is structurally striking. Both assets attracted demand as protection against fiat currency debasement, and both experienced parabolic runs that terminated abruptly. This historical pattern suggests that the psychology driving demand for hard assets follows remarkably consistent cycles.
What Drove Institutional and Retail Demand in 2020
ETFs, Central Banks, and Asian Physical Markets
The mechanics of gold demand in 2020 were multi-layered. Gold-backed exchange-traded funds absorbed an extraordinary 734 tonnes of gold, worth approximately $39.5 billion, in just the first six months of 2020 alone, representing one of the largest inflows into physically-backed gold instruments in history. This ETF demand provided a persistent structural bid that reinforced the price momentum driven by macro conditions.
Central bank demand added a separate demand floor. Sovereign wealth managers in countries including Russia, China, Turkey, and Hungary had been systematically diversifying reserve assets away from U.S. Treasuries and into gold throughout the preceding decade. This pattern continued into 2020.
Asian physical demand, particularly from buyers of Chinese heritage, adds a seasonal dimension that is often underappreciated. Physical gold buying in Asia consistently strengthens in the weeks preceding the Lunar New Year, creating a predictable seasonal tailwind in January and early February each year. This cultural demand dimension is largely invisible in headline market data but material to short-term price dynamics.
A further indicator of the 2020 bull market's global breadth was that gold reached all-time highs denominated in nearly every major global currency, not just the U.S. dollar. This cross-currency confirmation suggested the rally was not simply a dollar weakness story but reflected genuine global revaluation of the metal.
The next major ASX story will hit our subscribers first
Supply-Side Constraints: The Underappreciated Structural Tailwind
Declining Discovery Rates and the Production Pipeline Problem
On the supply side, the gold industry faces structural challenges that have been building for years and are rarely given adequate weight in mainstream analysis. The rate of discovery of new world-class gold deposits has been declining steadily since the late 1990s. The exploration-to-production pipeline typically spans 10 to 20 years from initial discovery to first pour, meaning reduced discovery activity today translates directly into constrained production growth a decade or more into the future. The mineral discovery curve illustrates just how pronounced this decline has become in recent years.
The jurisdiction risk dimension compounds this supply concern. Global gold production is geographically concentrated in regions that carry materially different levels of operational and political risk.
| Risk Category | Example Regions | Key Challenges |
|---|---|---|
| Low Sovereign Risk | Australia, Canada, United States | Higher operating costs, mature regulatory environments |
| Moderate Sovereign Risk | West Africa including Mali | Security concerns, evolving regulatory frameworks |
| Elevated Sovereign Risk | Parts of Southeast Asia, South Africa | Electricity and labour cost pressures, policy restructuring |
Mali is an instructive case. It has emerged as a significant gold-producing nation and has historically been regarded as relatively mining-friendly by African standards. However, the presence of active security threats in certain mining zones illustrates that even nominally favourable jurisdictions carry operational complexity. South Africa's gold sector faces persistent challenges around electricity reliability and labour costs. Indonesia has undergone regulatory restructuring that has created uncertainty for existing projects.
How to Evaluate ASX Gold Stocks During a Bull Market
Two Different Companies Require Two Different Analytical Lenses
Investors approaching ASX-listed gold companies need to apply fundamentally different frameworks depending on whether a company is an established producer or an emerging developer. Conflating the two is one of the more common analytical errors in the sector. Consequently, understanding the various types of gold mining investment is an essential first step before committing capital.
For established gold producers, the critical metrics include:
- All-In Sustaining Cost (AISC): This is the comprehensive per-ounce cost benchmark that captures not just direct mining costs but also sustaining capital, administration, royalties, and exploration costs required to maintain production. AISC is the true margin indicator at any given spot gold price.
- Hedge Book Exposure: A producer that has sold forward a large portion of future output at prices well below current spot loses most of its leverage to gold price appreciation. Evaluating the hedge book structure is essential before assuming a producer will benefit proportionally from a gold price rally.
- Reserve Depletion vs. Production Growth: A producer whose reserve base is declining faster than new resources are added is effectively liquidating its asset base regardless of what the gold price does.
For development-stage gold companies, the Enterprise Value per Resource Ounce method offers a comparable benchmark:
Worked Example: A development-stage company carries a market capitalisation of A$50 million, holds A$10 million in cash, and has no debt. It holds a JORC-compliant resource of 2 million ounces. Its Enterprise Value equals A$40 million (market cap minus cash), producing an EV per Resource Ounce of A$20. Resource sector practitioners generally treat figures below A$20 per ounce as potentially undervalued relative to comparable peers, though project quality, metallurgy, jurisdiction, and development stage must all be independently assessed. This is not a standalone buy signal.
The JORC Code (Joint Ore Reserves Committee) is the Australian industry standard for classifying and publicly reporting mineral resources and ore reserves. Resources are classified as Inferred, Indicated, or Measured depending on the confidence level of geological data supporting the estimate. Reserves, which are a subset of resources, must have demonstrated economic viability. Understanding this classification hierarchy is essential for interpreting resource announcements from ASX-listed gold developers.
The Cryptocurrency Wildcard
Has Bitcoin Fragmented the Traditional Gold Investor Base?
One speculative but structurally important question for the current and future gold bull market cycle concerns the emergence of Bitcoin and other digital assets as competing stores of value. In both the 1970s gold bull market and the 2020 cycle, the underlying psychological driver was identical: fear that paper currencies would be debased by governments running persistent deficits.
Bitcoin's 2017 peak near $20,000 before a sharp subsequent correction echoes the structural pattern of gold's 1980 cycle top. Both assets attracted a broad base of investors motivated by the same anti-fiat thesis, and both experienced corrections that were severe enough to deter a generation of participants.
The critical question is whether the pool of investors motivated to hold hard assets against fiat currency risk has been split between gold and digital alternatives in the current cycle. This could potentially reduce the scale of demand available to drive a gold bull market compared to the 2001 to 2011 cycle. This remains an open and debated question, but it represents one of the more underappreciated structural variables for long-term gold market analysis.
Three Scenarios That Could End a Gold Bull Market
Understanding the Conditions That Have Historically Reversed Gold's Direction
Gold bull markets do not end with fanfare. Historically they tend to terminate when confidence in economic normalisation returns or when the monetary conditions that justified gold's premium begin to reverse. Three distinct scenarios have the potential to compress or reverse a gold bull run:
- Rapid Real Yield Normalisation: If central banks aggressively raise benchmark interest rates to a level that pushes real yields into clearly positive territory, the opportunity cost of holding gold rises sharply and historically drives systematic selling pressure.
- Perceived Fiscal Stabilisation: When market participants price in a credible return to fiscal discipline, demand for inflation protection weakens and gold rerates lower. This dynamic drove the 1980 to 2001 bear market as Thatcher and Reagan-era fiscal conservatism reduced deficit spending.
- Sustained Dollar Strengthening: A structural bull market in the U.S. dollar compresses gold prices in USD terms, even when underlying physical demand remains intact, because the same ounce of gold becomes more expensive in local currency terms for the majority of the world's buyers.
Historically, gold bull markets have often peaked precisely when the geopolitical or economic narrative seemed most alarming. The January 1980 high coincided with the Soviet invasion of Afghanistan. Investors who extrapolated that crisis into an indefinitely rising gold price missed the subsequent 21-year bear market.
Key Takeaways for Long-Term Gold Investors
The gold bull market in 2020 was among the most structurally significant in the post-Bretton Woods era. Its lessons extend well beyond that single year:
- The $2,067 per ounce intraday high and 25.1% full-year gain to $1,888 were driven by monetary policy transformation, not panic.
- The March 2020 selloff to $1,474 was a liquidity event, not a trend reversal. Distinguishing between the two in real time requires cycle literacy, not just headline reading.
- Long-cycle analysis positions 2020 as an early-to-mid phase of a potential secular bull market, though the 21-year precedent from the 1980 peak should temper any assumption of indefinite continuation.
- ASX gold investor due diligence requires AISC analysis for producers, EV per Resource Ounce methodology for developers, and JORC classification literacy for interpreting resource announcements.
- Sovereign risk, declining discovery rates, and the structural competition from digital assets represent the three most underappreciated variables shaping gold's long-term supply and demand balance.
- The fundamental framework for timing gold exposure centres on economic uncertainty and monetary conditions, not geopolitical headlines.
This article is general information only and does not constitute financial advice. Past performance of any asset class, including gold, is not indicative of future results. Investors should conduct independent research and consider their personal circumstances before making any investment decisions.
Ready to Capitalise on the Next Major ASX Gold Discovery?
Discovery Alert's proprietary Discovery IQ model delivers real-time alerts the moment significant mineral discoveries are announced on the ASX, transforming complex geological data into actionable investment insights for both short-term traders and long-term investors. Explore historic discoveries and the substantial returns they have generated, then begin your 14-day free trial to position yourself ahead of the broader market.