July 14, 2026
The Counterintuitive Gold Price Paradox: When War Makes Precious Metals Cheaper
Most investors assume geopolitical crises push gold higher. The historical narrative is deeply embedded: wars begin, investors panic, and capital flows into the oldest safe-haven asset on the planet. Yet throughout the first half of 2026, gold price falls on Iran strike CPI Warsh testimony has repeatedly inverted this relationship. Military escalation in the Middle East has been consistently bearish for gold, not bullish. Understanding why requires setting aside the gold safe-haven role narrative entirely and engaging with the monetary transmission mechanism that actually governs precious metals pricing in the current cycle.
The answer sits inside a concept called the real yield — and once investors understand how it works, the seemingly paradoxical behaviour of gold becomes entirely logical.
When big ASX news breaks, our subscribers know first
How Real Yields Actually Govern Gold Pricing
A real yield measures what an investor genuinely earns after accounting for inflation. The standard benchmark is the 10-year Treasury Inflation-Protected Security (TIPS), which tracks the nominal Treasury return minus expected inflation embedded in the bond market. When this figure rises, investors holding gold face an increasing opportunity cost: they are forgoing a growing, inflation-adjusted return by keeping capital in a non-yielding asset.
Gold produces no coupon, no dividend, and no interest payment. Its appeal is preservation, not income. When real yields are negative or low, the cost of holding gold is minimal relative to alternatives. When real yields rise, that calculus shifts dramatically, and institutional capital rotates toward interest-bearing assets. Furthermore, understanding gold and bond dynamics is essential to grasping why these rotations occur with such regularity.
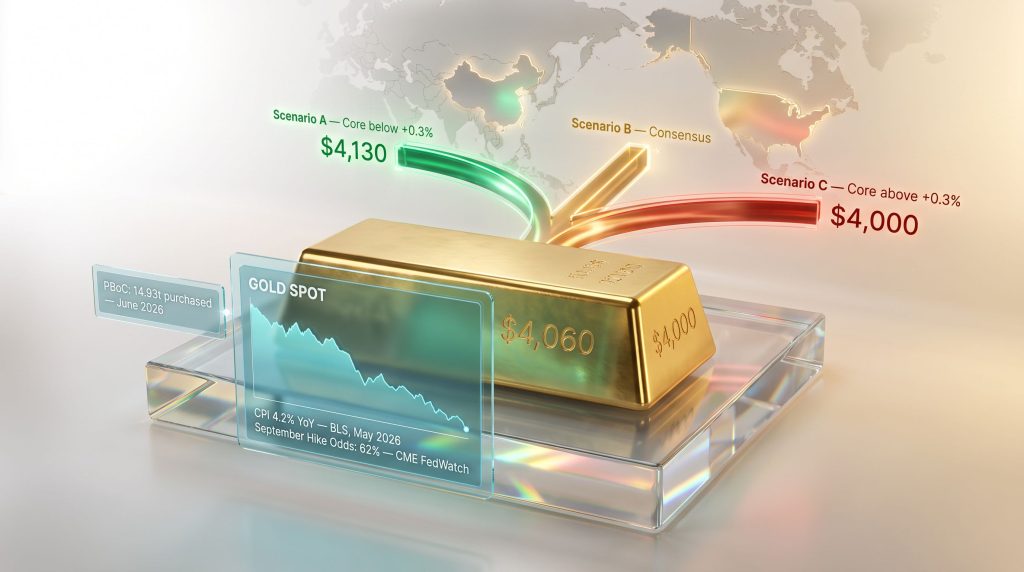
This dynamic has been the dominant pricing force for precious metals throughout 2026, and it explains why gold fell 1.4% to approximately $4,060-$4,065 per ounce on July 13, 2026, in direct response to fresh US military strikes against Iran (GoldSilver, July 13, 2026). Silver followed, dropping 2.3% to $58.49 per ounce on the same session.
The Four-Step Transmission Chain: From Military Strike to Lower Gold Price
The mechanism connecting geopolitical escalation to falling gold prices runs through a precise sequence:
-
Military escalation triggers fears of crude oil supply disruption across key shipping corridors, including the Strait of Hormuz.
-
Oil prices rise in response, accelerating headline energy inflation. By May 2026, energy costs had climbed 23.5% year-over-year, accounting for more than 60% of the entire monthly CPI increase (Bureau of Labor Statistics, June 2026).
-
Inflation expectations increase, raising the probability that the Federal Reserve will keep rates elevated or move them higher. By July 11, 2026, CME FedWatch data showed September rate-hike odds reaching 62%.
-
Real yields climb, raising the opportunity cost of holding gold and triggering institutional selling.
Iran's Strait of Hormuz closure declaration did not push gold lower because investors felt secure. It pushed gold lower because it made the Federal Reserve's inflation problem harder to solve, and a more hawkish Fed means higher real yields and a more expensive asset to hold in gold.
This four-step chain is not unique to 2026. It has operated across multiple rate cycles. What makes the current environment distinctive is the magnitude of the energy component within inflation data, and the speed at which geopolitical shocks transmit into monetary policy expectations. For a broader perspective on how these pressures interact, Pepperstone's gold outlook analysis offers further context on the ceasefire dynamics and the path toward $4,000.
What the June CPI Report Means for the Gold Price Outlook
The Bureau of Labor Statistics was scheduled to release June 2026 inflation data on July 14 at 8:30 AM ET, making it the most consequential single data point for gold heading into the July 28-29 Federal Open Market Committee meeting. The gold price outlook heading into this release was, consequently, unusually uncertain.
The setup is important to understand fully. May 2026 CPI came in at 4.2% year-over-year, the highest reading since April 2023, with energy driving the overwhelming majority of the monthly gain (BLS, June 10, 2026). That print forced the Fed to revise its 2026 PCE inflation forecast upward to 3.6% from 2.7%, a significant shift that directly reinforced rate-hike expectations.
However, the energy picture changed materially in June. Following a mid-June ceasefire and a temporary reopening of the Strait of Hormuz, crude oil fell approximately 20% from its 2026 highs (CNBC, May 2026). Gasoline prices followed. This reversal created the conditions for a negative month-over-month headline CPI reading, which would be the first such print since 2020.
What Wall Street Was Forecasting for June Inflation
| Institution | June CPI Forecast (YoY) | Monthly Headline Estimate | Primary Driver Cited |
|---|---|---|---|
| Barclays (Pooja Sriram) | 3.8% | Negative | Crude oil decline post-ceasefire |
| BMO / Broad Consensus | ~3.8-3.9% | -0.1% MoM | Energy price reversal |
| BofA (Mark Cabana, via Kiplinger) | Consensus -0.1% MoM | Negative | Energy base effects |
Sources: Barclays research note, July 2026; Kiplinger, July 11, 2026; BMO consensus estimate
The critical distinction analysts were watching was not the headline figure but the core CPI reading, which strips out food and energy and represents the Fed's preferred gauge of underlying price pressure. With core already running at +0.3% month-over-month, any upside surprise would provide the Federal Reserve with analytical justification for signalling a September rate increase.
Three Scenarios: How Gold Could Trade Following the CPI Release
The interaction between the headline and core readings creates three distinct outcomes for gold pricing in the days surrounding July 14, 2026.
Scenario A: Softer Than Expected (Headline below -0.1% MoM, Core below +0.3% MoM)
- September rate-hike probability retreats from the 62% level
- Real yield expectations are repriced lower as the tightening narrative softens
- Gold recovers ground lost on July 13 and tests resistance near $4,130
- The Iran escalation is reclassified by markets as short-term geopolitical noise rather than a structural inflation catalyst
Scenario B: In Line With Consensus (Headline ~-0.1% MoM, Core at +0.3% MoM)
- Markets confirm that energy-driven inflation has peaked but underlying price pressure persists
- September hike odds hold near 62%; gold stabilises without meaningful directional recovery
- Decision weight shifts almost entirely to Fed Chair Warsh's congressional testimony beginning 90 minutes later
Scenario C: Hotter Than Expected (Core above +0.3% MoM or positive headline surprise)
- Rate-hike expectations accelerate; the US dollar strengthens
- Real yields push higher; gold extends losses toward the $4,000 structural support level identified by the World Gold Council in its 2026 Mid-Year Valuation Framework
- Iran-driven energy inflation is reclassified as broad-based rather than temporary, providing cover for aggressive Fed action
What Fed Chair Warsh's Congressional Testimony Signals for Gold
The second major variable arriving on July 14 was Fed Chair Kevin Warsh's first congressional testimony since his confirmation in May 2026. His appearance before the House Financial Services Committee was scheduled for 10:00 AM ET, precisely 90 minutes after the CPI release, followed by Senate Banking Committee testimony on July 15 alongside the PPI data release.
Warsh's June FOMC meeting produced a notable set of signals: rates held steady, forward guidance removed, the dot plot shifted in a hawkish direction, and Warsh's individual rate projection withheld entirely (Federal Reserve, June 2026). That deliberate ambiguity left markets without a clear anchor on the chair's personal policy stance.
The Two Language Signals Markets Were Scanning For
Institutional traders will not be parsing Warsh's full prepared remarks for analytical nuance. They will be scanning two specific rhetorical signals that either confirm or deny the September rate hike probability.
-
Signal One: If Warsh characterises the energy inflation surge as temporary or primarily geopolitical in origin, it signals the Fed views the May 4.2% reading as a transient disruption. Rate expectations soften. Gold benefits.
-
Signal Two: If Warsh frames the 4.2% May CPI reading as evidence of broad structural inflation without explicitly acknowledging energy's 60%+ contribution to the monthly gain, hawkish rate expectations are reinforced. Gold remains under pressure.
The 90-Minute Sequencing Problem
The sequencing of these two events matters as much as their content. CPI at 8:30 AM ET sets the initial directional bias for gold. Warsh at 10:00 AM ET either confirms or contradicts that bias. The scenarios multiply quickly:
- CPI softens but Warsh remains hawkish: gold recovery is capped
- CPI surprises hot but Warsh signals patience: gold decline may be contained
- Both signals align in the same direction: gold moves with conviction
It is the interaction between these two data points, not either one in isolation, that determines gold's short-term trajectory across the July 14-28 window. Indeed, gold price falls on Iran strike CPI Warsh testimony have illustrated precisely how this dual-signal mechanism operates in practice.
Why the Structural Case for Gold Remains Intact Beyond the Rate Cycle
Short-term rate dynamics have dominated gold price movements in 2026, but the monetary policy debate obscures a set of structural forces operating on an entirely different time horizon. In addition, gold in the monetary system continues to evolve in ways that transcend any single rate cycle.
The People's Bank of China and the Reserve Diversification Imperative
In June 2026, the People's Bank of China purchased 14.93 tonnes of gold, the largest single-month acquisition since October 2023 (State Administration of Foreign Exchange, July 7, 2026). This extended China's consecutive monthly buying streak to 20 months, the longest documented run since at least 2015 (Bloomberg, July 7, 2026). This sustained central bank gold demand continues to underpin price floors that short-term rate moves struggle to breach.
The significance of this figure extends beyond the tonnage. China's gold holdings currently represent less than 10% of its total foreign exchange reserves, compared to approximately 70% for the United States. The structural gap between these two reserve compositions implies a multi-decade demand runway that operates entirely independently of whether the CME FedWatch tool shows 62% or 42% September hike probability.
Reserve managers at sovereign institutions are not making portfolio decisions based on two-day inflation prints. Their gold accumulation reflects a structural mandate to reduce US dollar concentration risk across reserve portfolios, and that mandate does not expire when energy prices fall.
The Sovereign Debt Ceiling on Real Yields
One of the less discussed constraints on the Federal Reserve's ability to push real yields higher is the fiscal mathematics of US government debt. With US national debt exceeding $39 trillion and annual federal interest costs surpassing $1 trillion as of mid-2026 (US Treasury Fiscal Data, July 2026; Congressional Budget Office, 2026), the government's capacity to sustain aggressively elevated real yields is structurally limited.
Every percentage point increase in real yields adds hundreds of billions to the federal debt servicing burden over time. This creates a natural ceiling on how far the Fed can realistically push real rates without triggering a fiscal crisis that would itself become inflationary, creating a self-limiting dynamic for the very mechanism currently suppressing gold.
A Divided Fed and What It Means for Tightening Capacity
The June 2026 Summary of Economic Projections revealed that 9 of 18 FOMC officials expected at least one rate hike before year-end (Federal Reserve, June 2026 SEP). A committee divided this closely does not represent a unified tightening mandate. Internal disagreement of this magnitude limits the Fed's ability to sustain aggressive real yield increases, which in turn limits the structural downside pressure on gold.
Gold's Structural Position: A Summary of Long-Term Drivers
| Structural Factor | Current Reading | Gold Price Implication |
|---|---|---|
| US National Debt | >$39 trillion | Limits sustainable real yield ceiling |
| Annual Federal Interest Cost | >$1 trillion | Constrains aggressive Fed tightening capacity |
| PBoC Gold as % of Reserves | <10% | Decades of potential accumulation demand ahead |
| US Gold as % of Reserves | ~70% | Benchmark illustrating reserve gap magnitude |
| PBoC Consecutive Buying Streak | 20 months | Structural demand floor beneath price volatility |
| FOMC Hike Projections (June SEP) | 9 of 18 officials | Divided mandate; limited coordinated tightening |
The next major ASX story will hit our subscribers first
A Practical Monitoring Framework for July 14-15, 2026
For investors watching the 24-hour window surrounding the CPI release and Warsh testimony, the following sequenced checklist structures the key variables in order of arrival:
-
8:30 AM ET, July 14: Headline CPI MoM – A negative print validates the energy reversal thesis and reduces September hike probability. A positive print signals Iran-related energy inflation is feeding into broader price pressures.
-
8:30 AM ET, July 14: Core CPI MoM – The Federal Reserve's primary signal. A reading above +0.3% provides hawkish justification. A reading below +0.3% is the most structurally constructive outcome for gold.
-
10:00 AM ET, July 14: Warsh's Opening Statement – Listen specifically for energy characterisation language. Temporary framing softens rate expectations; structural framing reinforces them.
-
Post-Testimony Q&A – Congressional questioning frequently extracts more precise signals than prepared remarks. Watch for any forward guidance on the July 28-29 FOMC decision.
-
July 15: PPI Release + Senate Banking Testimony – The second sequential data point either confirms or contradicts the CPI narrative. A PPI surprise in either direction recalibrates the picture established on July 14.
Key Data Points at a Glance: Gold Price Drivers, July 13-14, 2026
| Data Point | Value | Source |
|---|---|---|
| Gold spot price (July 13, 2026) | ~$4,060-$4,065/oz | GoldSilver, July 13, 2026 |
| Gold daily decline | -1.4% (~$55/oz) | GoldSilver, July 13, 2026 |
| Silver spot price | $58.49/oz | GoldSilver, July 13, 2026 |
| Silver daily decline | -2.3% | GoldSilver, July 13, 2026 |
| May 2026 CPI YoY | 4.2% | Bureau of Labor Statistics |
| Energy contribution to May CPI | >60% of monthly gain | BLS, June 2026 |
| Energy costs YoY (May 2026) | +23.5% | BLS, June 2026 |
| Crude oil decline from 2026 highs | ~20% | CNBC, May 2026 |
| September hike probability | ~62% | CME FedWatch, July 11, 2026 |
| Fed's revised 2026 PCE forecast | 3.6% (from 2.7%) | Federal Reserve |
| PBoC June 2026 gold purchase | 14.93 tonnes | SAFE, July 7, 2026 |
| PBoC consecutive buying streak | 20 months | Bloomberg, July 7, 2026 |
| FOMC officials projecting at least one hike | 9 of 18 | Federal Reserve SEP, June 2026 |
| US national debt | >$39 trillion | US Treasury Fiscal Data |
| Annual US interest cost | >$1 trillion | CBO, 2026 |
Frequently Asked Questions: Gold Price, CPI, and the Fed in 2026
Why does geopolitical escalation cause gold to fall rather than rise?
When military conflict raises the prospect of oil supply disruptions, energy prices rise. Rising energy costs feed directly into headline inflation, which reinforces the case for the Federal Reserve to keep interest rates elevated. Higher real yields increase the opportunity cost of holding a non-yielding asset like gold, prompting institutional selling. The geopolitical event acts as an inflation catalyst rather than a safe-haven trigger, which is the counterintuitive but mechanistically logical result of the current rate environment.
What is the relationship between real yields and the gold price?
Real yields represent the inflation-adjusted return available from Treasury securities. When this figure is positive and rising, investors forgo a growing real return by holding gold. When real yields compress or turn negative, gold's relative attractiveness increases significantly. This inverse relationship has been the primary pricing mechanism for gold throughout 2026, overriding traditional safe-haven demand signals on multiple occasions.
What would a negative June CPI print mean for the gold price?
A negative month-over-month headline reading would confirm that May's energy-driven inflation spike was a temporary disruption tied to the Strait of Hormuz escalation rather than a signal of entrenched broad-based inflation. This outcome would reduce September rate-hike expectations, compress real yield projections, and create conditions for gold to recover toward the $4,130 resistance level identified in Scenario A.
How does the People's Bank of China's gold buying affect long-term prices?
The PBoC's sustained accumulation, including 14.93 tonnes in June 2026 alone across a 20-month consecutive buying streak, represents demand that is structurally anchored to reserve diversification rather than short-term market timing. With China's gold representing less than 10% of total reserves versus roughly 70% for the United States, the gap between these two positions implies decades of potential catch-up buying pressure that persists regardless of near-term US monetary policy direction.
What is the $4,000 gold level and why does it matter?
The World Gold Council's 2026 Mid-Year Valuation Framework identified $4,000 per ounce as a key structural support zone. In a scenario where CPI surprises to the upside and Warsh signals hawkish intent, this level represents the near-term downside target at which long-term structural buyers, including central banks and sovereign wealth funds, are expected to provide meaningful demand support. Furthermore, FX Street's weekly gold forecast outlines how renewed Middle East tensions are complicating price recovery attempts near this critical zone.
Separating the Short-Term Rate Noise From Gold's Structural Signal
The gold price falls on Iran strike CPI Warsh testimony in mid-2026 are best understood as cyclical compression within a structurally intact long-term thesis. The real yield mechanism that triggered the July 13 selloff is real and consequential for near-term positioning. However, it operates within boundaries set by forces that monthly inflation data cannot alter.
Gold carries no counterparty risk, no yield dependency, and no exposure to government devaluation through currency creation. These characteristics remain unchanged regardless of whether the 10-year TIPS yield closes the week at 2.1% or 2.4%. The sovereign debt constraint on how aggressively the Fed can tighten, the reserve diversification mandate driving two decades of potential PBoC accumulation, and a committee divided 9-to-9 on rate hikes collectively define a structural floor beneath whatever short-term volatility CPI and Warsh deliver.
The data prints arriving on July 14 will move gold within a defined range. The structural forces accumulating beneath that range are the variables that determine where gold trades in 2027 and beyond, and those forces have not changed direction.
Disclaimer: This article is for informational and educational purposes only and does not constitute financial or investment advice. Forecasts, scenario projections, and analyst estimates referenced herein represent third-party views at a specific point in time and may not reflect actual future outcomes. All investments involve risk, including the potential loss of principal. Readers should consult a qualified financial adviser before making any investment decisions.
Want to Stay Ahead of the Next Major ASX Mineral Discovery?
While gold's real yield dynamics and macro forces shape precious metals pricing, Discovery Alert's proprietary Discovery IQ model scans every ASX announcement in real time, instantly identifying significant mineral discoveries and delivering actionable alerts before the broader market reacts — explore historic discoveries and their returns to see what early positioning can mean, then begin your 14-day free trial at Discovery Alert to secure your market-leading edge.