
August 4, 2026
When the Measuring Stick Is Wrong, the Answer Will Always Be Wrong
Every asset market has a reference point problem. Investors instinctively anchor to the most recent peak, treat it as the baseline, and measure all subsequent movement against it. This habit produces emotionally compelling numbers that are analytically misleading. The gold market in 2026 is a textbook example of how the choice of reference point can transform a mild consolidation into a narrative of collapse — and understanding whether is the gold bull market over requires looking far beyond simple headline figures.
Before asking whether the gold bull market is over, the more productive question is: over from where, exactly? Examining the gold market outlook reveals that the narrative, once widely accepted, shapes sentiment and decision-making in ways almost entirely disconnected from the underlying fundamentals.
When big ASX news breaks, our subscribers know first
The Reference Point Problem: Why Most Investors Are Measuring the Wrong Thing
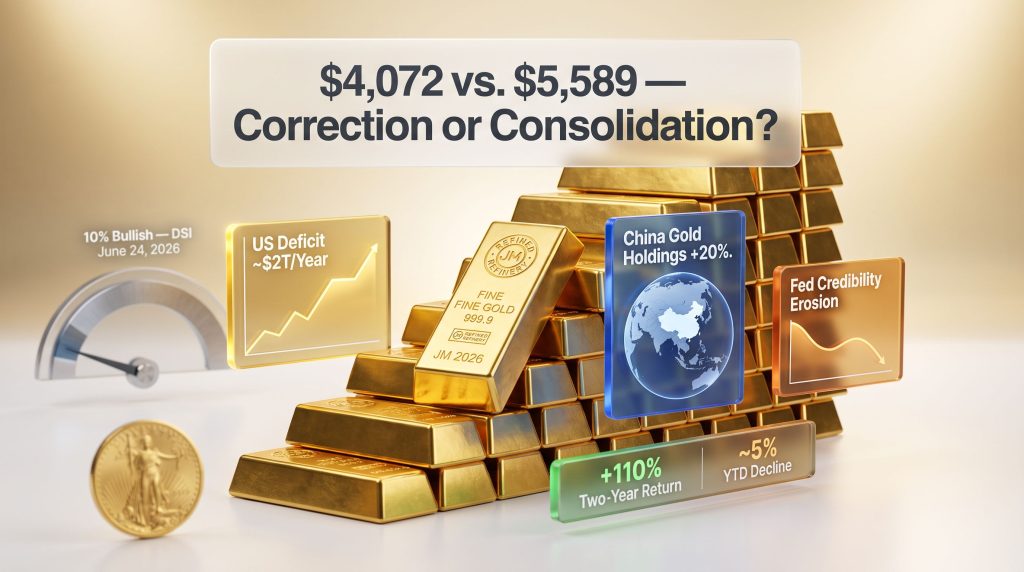
Gold reached an all-time high of $5,589 on January 28, 2026. As of early August 2026, it trades near $4,072. The arithmetic between those two figures produces a decline of approximately 27%, and that is the number generating headlines, driving pessimistic commentary, and shaping the dominant narrative that the bull market has ended.
However, there is a more analytically defensible comparison available. Gold closed calendar year 2025 up 65% for the year. Measured against that December 31, 2025 year-end close, gold is down roughly 5% year-to-date. The difference between a 27% decline and a 5% decline is not cosmetic — it determines whether the current price environment represents a structural breakdown or a routine post-blowoff consolidation inside a continuing bull market.
The January high was not a fundamental re-rating. It was a speculative blowoff. Measuring from a speculative extreme systematically overstates the severity of any correction, in every asset class, across every market cycle. Gold investors in 2026 are experiencing its consequences in particularly stark form.
Two-Year Return Context
| Asset | 2024 Return | 2025 Return | Combined 2-Year Return | Decline from Jan 2026 Peak | YTD Decline from Dec 2025 Close |
|---|---|---|---|---|---|
| Gold | +27% | +65% | ~+110% | ~27% | ~5% |
| Silver | +21% | ~+147% | ~+200% | ~51% (from $121.62 peak) | Deeper, reflecting higher volatility |
A 5% year-to-date decline following a 110% compounded two-year return is historically unremarkable. Investors who established positions before the 2024 bull cycle commenced remain up approximately 100% from end-2023 entry levels. The bull run has not been erased — a speculative overshoot has been corrected.
Anatomy of a Speculative Blowoff: What January 2026 Actually Was
Understanding the correction requires understanding what preceded it. In the single month through January 29, 2026, gold surged 29.5% and silver jumped 70%. Neither move was anchored in any material change to underlying macro fundamentals. Both moves were driven by cascading speculative momentum feeding on itself.
The clearest statistical fingerprint of that dynamic came on January 26, 2026, when the iShares Silver Trust recorded $171 million in single-day net inflows — more than double the previous record of $93 million set during the 2021 silver squeeze. When ETF inflows double their all-time record in a single session, the market is not undergoing a fundamental re-rating. It is experiencing a speculative crowding event.
Speculative blowoff tops are self-correcting by definition. The correction in late January and early February 2026 was precisely that mechanism unwinding. By March 2, 2026, gold had recovered to approximately $5,400 and silver had returned to near $103. That rapid mean reversion indicates that structural demand remained intact beneath the speculative noise — the correction was a liquidation of excess positioning, not an exit from the macro thesis.
Genuine bull market corrections tend to stabilise and recover toward prior structural levels once the speculative excess has been cleared. The March 2 recovery trajectory is consistent with that historical pattern, not with a structural reversal.
Three Structural Pillars That Have Not Changed
The more important question is not what happened to price, but whether the fundamental reasons to hold gold have deteriorated. Examining each pillar in turn makes the answer clear.
Pillar 1: The US Fiscal Trajectory and the Debt Spiral
Federal deficit spending in the United States has transitioned from emergency-level to normalised. Annual deficits have stabilised at approximately $2 trillion per year, no longer exceptional but embedded as a structural feature of fiscal policy. The interest burden on the federal debt currently stands at $1.2 trillion annually and is projected by Congressional Budget Office estimates to reach $2.1 trillion by 2035.
This creates a self-reinforcing dynamic:
- Elevated borrowing requirements push Treasury yields higher.
- Higher yields increase the annual interest burden on outstanding debt.
- A larger interest burden requires additional borrowing to service existing obligations.
- Additional borrowing further elevates yields, restarting the cycle.
Gold has historically functioned as a confidence barometer for sovereign fiscal credibility, and furthermore, gold as a safe haven becomes increasingly attractive when that credibility faces sustained, measurable, structural pressure. This pillar has not weakened in 2026 — it has continued to build.
Pillar 2: De-Dollarisation and Central Bank Reallocation
The March 2022 freezing of Russian foreign exchange reserves by Western governments fundamentally changed how sovereign wealth managers assess the risk profile of dollar-denominated assets. The message delivered to every non-Western central bank was that reserve assets held in the US financial system are subject to political risk in ways that were not previously priced into portfolio construction.
The portfolio response has been measurable and sustained:
- China has grown its gold holdings by approximately 20% in ounce terms since March 2022.
- China simultaneously reduced its US Treasury holdings from approximately $1 trillion to roughly $683 billion as of late 2025 — a reduction of approximately 30% (US Treasury TIC Data).
- This reallocation has not been a tactical trade. It is a multi-year strategic repositioning that has broadened across multiple sovereign balance sheets.
Central bank gold demand behaves differently from retail or speculative demand. Sovereign buyers are acquiring gold as a reserve diversification mechanism, and short-term price corrections do not reverse that strategic calculus.
In addition, central bank gold demand has been joined by a new category of structurally price-insensitive buyer since Q2 2025. Tether, the operator of the USDT stablecoin, has been acquiring physical gold at a pace exceeding almost every central bank on earth in recent quarters. Gold-backed stablecoins require physical metal as collateral by design, making their buying functionally non-discretionary and indifferent to short-term price movements — a demand dynamic that did not exist in prior gold bull cycles.
Pillar 3: Federal Reserve Credibility and the Policy Error Legacy
The 2021 monetary policy error inflicted institutional damage that does not resolve in a single cycle. The Federal Reserve maintained $120 billion per month in quantitative easing while GDP expanded at approximately 6%, CPI climbed toward 7%, and unemployment had already fallen sharply. Reconstructing central bank credibility after a miscalibration of that scale is a multi-year process, not a quarterly adjustment.
Erosion of central bank credibility is one of gold's most durable and historically validated long-term tailwinds. The mechanism is straightforward: when markets lose confidence in a central bank's ability to preserve purchasing power, the demand for non-sovereign stores of value increases. Analysts at BlackRock have noted that gold and silver price volatility reflects precisely these deeper structural anxieties around monetary policy.
What the Warsh Fed Means for Rate Hike Expectations
Current market pricing incorporates the possibility of multiple Federal Reserve rate hikes in 2026, with some Wall Street models projecting three increases. Understanding why those expectations may be overpriced requires examining the new Fed chair's documented policy philosophy.
Kevin Warsh, as a Fed governor under Ben Bernanke, resigned seven years before his term concluded specifically to protest QE2, which he viewed as a material policy miscalculation. His framework differs from his predecessors in two analytically significant ways:
- He has been critical of what he characterises as the neo-Keynesian approach of prioritising inflation expectation anchoring over real economy assessment.
- He has explicitly criticised the practice of heavy forward guidance, which he argues allows markets to anticipate policy decisions so precisely that the transmission mechanism of monetary policy itself is compromised.
The geopolitical transmission chain that has weighed on gold in 2026 runs as follows: Iran-related tension pushes oil prices higher, elevated CPI triggers Fed tightening, and Fed tightening suppresses gold. This reasoning chain depends critically on its final step. A Fed chair philosophically opposed to mechanical responses to input-driven inflation readings is materially less likely to tighten in response to oil-driven CPI movements than the market's current pricing implies. Consequently, if rate hike expectations are structurally overpriced, one of the primary headwinds holding gold down in 2026 weakens considerably.
What Gold Sentiment Extremes Have Historically Signalled
On June 24, 2026, the Bernstein Daily Sentiment Index (DSI) for gold registered 10% bullish, meaning 90% of retail traders on the CME held bearish positions on the metal.
| DSI Reading | Market Interpretation | Historical Frequency (25-Year Dataset, ~6,800 Days) |
|---|---|---|
| 10% bullish | Extreme pessimism | Occurred on approximately 1.9% of trading days |
| Historical outcome | Price bottom formation | Every recorded occurrence in the dataset |
This is a statistically rare reading. Over approximately 6,800 trading days in the past 25 years, the DSI recorded a more bearish reading on only 1.9% of occasions. Analysts who have tracked this indicator across four decades have described the mid-2026 reading as the most extreme bearish sentiment observed in precious metals over that entire period.
The mechanism behind this signal is worth understanding precisely:
- Extreme bearish sentiment readings indicate that the pool of motivated sellers has been largely exhausted.
- When 90% of traders are already positioned short or bearish, the incremental supply of new selling pressure is structurally limited.
- This does not independently generate a price recovery — it removes the primary obstacle to recovery when catalysts emerge.
Sentiment extremes are most analytically powerful when they coincide with intact structural fundamentals. The combination of near-40-year bearish sentiment extremes with unchanged macro drivers creates a historically rare convergence.
Furthermore, reports from the AFR suggest that experienced gold traders remain broadly confident the rally will extend, even acknowledging near-term consolidation.
The next major ASX story will hit our subscribers first
How the 2026 Correction Compares to Prior Bull Market Drawdowns
Historical context is the most effective antidote to peak-anchoring bias. Gold's approximately 27% drawdown from its January 2026 high is consistent with mid-cycle corrections, not terminal reversals. The recession impact on gold across prior downturns further illustrates how gold has historically absorbed macro shocks without reversing its secular trend.
| Historical Correction | Drawdown Magnitude | Subsequent Trajectory |
|---|---|---|
| 1970s mid-cycle correction | ~47% | ~8x rally to January 1980 peak |
| 2008 GFC correction | ~30% | Recovery to significant new highs |
| 2020 COVID correction | ~12-15% | New all-time highs within months |
| 2026 correction from Jan peak | ~27% | Structural fundamentals intact |
The 1970s precedent deserves particular attention. Gold fell approximately 47% at the midpoint of that secular bull market. The overwhelming majority of investors who sold during that correction missed a subsequent rally of nearly eight times from the correction low to the January 1980 peak. Investors who confused a mid-cycle drawdown with a secular top paid for that error with the most profitable phase of the entire bull market.
What Would Actually Signal the End of the Bull Market?
Asking whether is the gold bull market over requires defining what a genuine reversal of the structural thesis would look like. Price action alone is insufficient. The relevant signals are macro and fundamental:
- Fiscal consolidation: A credible and sustained reduction in the US annual deficit trajectory toward levels that stabilise rather than compound the debt burden.
- De-dollarisation reversal: China and other major sovereign holders rebuilding US Treasury positions at scale while simultaneously reducing gold reserve allocations.
- Fed credibility restoration: Demonstrated, multi-year track record of accurate policy calibration that rebuilds institutional trust in the central bank's purchasing power mandate.
None of these conditions has materialised. The forces that created the structural case for gold built over decades and are unlikely to reverse within a single economic cycle. However, the gold-silver ratio provides an additional dimension worth monitoring — shifts in the gold-silver ratio have historically flagged turning points in precious metals cycles before they become visible in gold price action alone.
A technical bear phase — meaning price below key moving averages with negative momentum — can coexist with an intact secular bull thesis. The structural drivers that have propelled gold through a 110% compounded two-year return have not changed. The speculative excess that sat on top of them has been corrected. Those are different things, and treating them as the same is the most expensive mistake available in the current market.
This article is for informational and educational purposes only and does not constitute investment advice. Past performance is not indicative of future results. Precious metals investing involves risk, including the potential loss of principal. Always consult a qualified financial professional before making investment decisions. Figures cited reflect data available as of the article's publication date.
Want to Capitalise on the Next Major Precious Metals Discovery Before the Broader Market?
Discovery Alert's proprietary Discovery IQ model delivers real-time alerts on significant ASX mineral discoveries, transforming complex data across 30+ commodities into clear, actionable insights for both short-term traders and long-term investors — explore historic discoveries and their returns to understand the scale of opportunity, then begin your 14-day free trial at Discovery Alert to position yourself ahead of the market.