July 29, 2026
The Structural Paradox Driving Gold Markets in 2026
Precious metals markets have historically operated within a well-understood framework: when central banks tighten monetary policy, gold suffers. Rising real yields increase the opportunity cost of holding a non-yielding asset, a stronger dollar compresses gold's purchasing power across global markets, and institutional capital rotates toward fixed income. The textbook says gold goes down when rates go up.
Yet the first half of 2026 has produced something that challenges that framework in a meaningful way. Institutional gold buying and Fed expectations are diverging in historically significant ways: central banks globally are accumulating bullion at near-record pace, and Asian ETF inflows are hitting all-time highs even as Western funds bleed capital. Understanding why this divergence is happening, and whether it signals a durable structural shift, is the most important question facing gold market participants right now.
When big ASX news breaks, our subscribers know first
Understanding the Macro Framework: What Actually Moves Gold Prices?
The Three Transmission Channels Between Fed Policy and Gold
To understand why institutional gold buying has continued despite tightening financial conditions, it helps to first map how Fed policy actually transmits into gold prices. There are three primary channels, and they do not always point in the same direction.
Channel 1: Real Yields. The most direct relationship between Fed policy and gold runs through real Treasury yields, specifically the yield on inflation-protected securities (TIPS). When the Fed raises rates or signals sustained restrictiveness, nominal yields rise. If inflation expectations do not rise proportionally, real yields increase, raising the opportunity cost of holding gold relative to interest-bearing alternatives. This dynamic drove much of gold's underperformance during the 2022 to 2023 tightening cycle.
Channel 2: U.S. Dollar Strength. Gold is priced globally in U.S. dollars, meaning a stronger dollar mechanically reduces the purchasing power of gold for buyers operating in other currencies. Dollar strength also tends to suppress commodity demand broadly, as it raises the effective cost of dollar-denominated assets for international buyers. The U.S. Dollar Index's behaviour around Fed decision windows is therefore a critical leading indicator for short-term gold price direction.
Channel 3: Inflation Expectations. This channel is the most complex and often the most misunderstood. Gold's traditional role as an inflation hedge means that rising inflation expectations can support prices even when nominal rates are climbing. When geopolitical shocks, energy price spikes, or supply disruptions inject fresh inflation risk into the system, they can create a competing upward force that partially offsets the headwind from higher real yields. The net effect depends on which force is larger, and that calculation shifts constantly. Furthermore, the gold safe-haven dynamics at play during such periods often reinforce these inflation-driven price moves.
Snapshot: Key Gold Market Metrics at a Glance (H1 2026)
| Metric | Value | Significance |
|---|---|---|
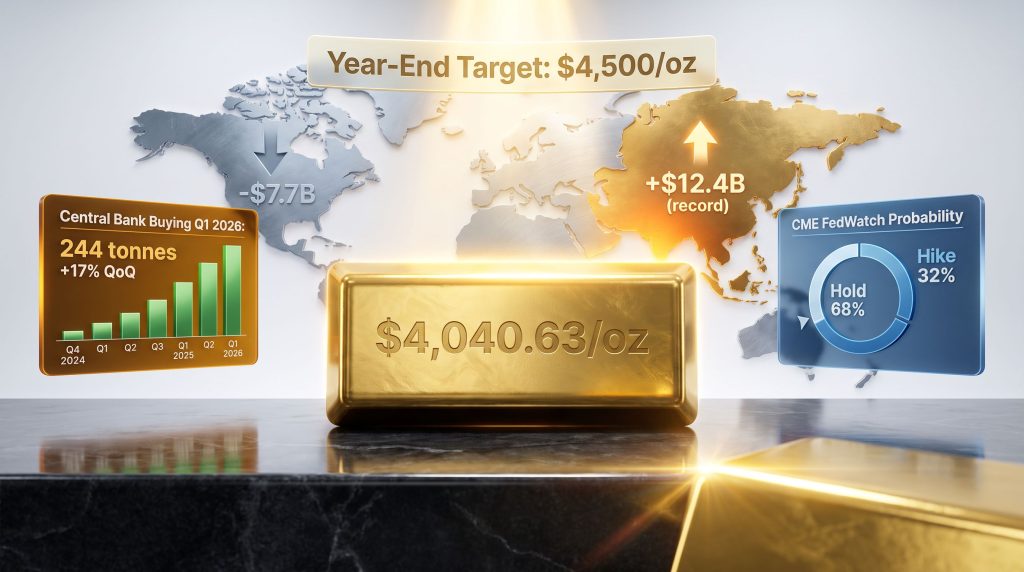
| Spot Gold Price (July 29, 2026) | $4,040.63/oz | Holding above $4,000 psychological floor |
| COMEX Net Long Positions (June 2026) | 538 tonnes | Highest since January 2026 |
| Month-over-Month Change in Net Longs | +16% | Institutional accumulation signal |
| North American ETF Outflows (H1 2026) | -$7.7 billion | Retail and fund-level disengagement |
| Asian ETF Inflows (H1 2026) | +$12.4 billion (record) | Structural demand shift eastward |
| India ETF Inflows (H1 2026) | +$3.9 billion | Largest single-country contributor |
| Global Gold ETF AUM (June 2026) | $526 billion | Down 13% from prior period |
| Commerzbank Year-End Target | $4,500/oz | ~11% upside from current levels |
| Silver Year-End Target (Commerzbank) | $67/oz | Correlated precious metals outlook |
| CME FedWatch: Hold Probability | 68% | Dominant base-case scenario |
| CME FedWatch: 25bp Hike Probability | 32% | Non-trivial tail risk |
| Central Bank Buying (Q1 2026) | 244 tonnes | +17% quarter-on-quarter |
| Central Bank Buying (Q3 2025) | 220 tonnes | Above five-year quarterly average |
| Central Bank Share of Global Demand (2024) | >20% | Record official-sector participation |
How Significant Is Central Bank Demand to the Gold Market Right Now?
Official-Sector Buying Has Become a Structural Floor, Not a Cyclical Signal
Key Insight: Central bank net purchases exceeded 20% of total global gold demand in 2024, a threshold not reached in modern monetary history. This structural shift fundamentally alters how institutional investors should interpret short-term price weakness, as official-sector buyers are demonstrably not price-sensitive in the same way that retail or fund-level participants are.
The volume of central bank gold demand has been consistently underappreciated as a market stabiliser. Most conventional gold analysis focuses on ETF flows, COMEX positioning, and dollar dynamics, all of which are visible and frequently reported. Central bank demand, by contrast, is disclosed on a lag and often in aggregated form, meaning its full weight is rarely incorporated into real-time price models.
The Reserve Manager Confidence Indicator: What Survey Data Reveals
World Gold Council survey data from reserve managers paints a clear picture of institutional intent. According to World Gold Council demand trends, official-sector participation has reached historically significant levels:
- 89% of surveyed reserve managers expect global central bank gold reserves to increase over the next 12 months
- 45% anticipate increasing their own institution's gold holdings within that same timeframe
- Q1 2026 central bank purchases reached 244 tonnes, a 17% quarter-on-quarter increase
- Q3 2025 net buying of 220 tonnes exceeded the five-year quarterly average, confirming this is sustained structural behaviour rather than a temporary allocation spike
Why Central Banks Are Buying Into a High-Rate Environment
The persistence of central bank buying during a period of elevated real yields is itself a signal worth examining carefully. Several forces are driving this behaviour:
- De-dollarisation pressures are accelerating reserve diversification strategies across emerging market central banks, with gold offering a dollar-independent store of value that carries no counterparty credit risk
- Geopolitical fragmentation is increasing the attractiveness of assets that cannot be frozen, sanctioned, or devalued through foreign policy decisions, a lesson reinforced by the 2022 freezing of Russian foreign exchange reserves
- Historical precedent supports the pattern: official-sector accumulation has consistently intensified during periods of elevated monetary and geopolitical uncertainty, as reserve managers prioritise stability over yield optimisation
What Is the Fed Actually Deciding, and Why Does It Matter for Institutional Gold Buying?
Decoding the 68/32 Probability Split: A Market Tension Analysis
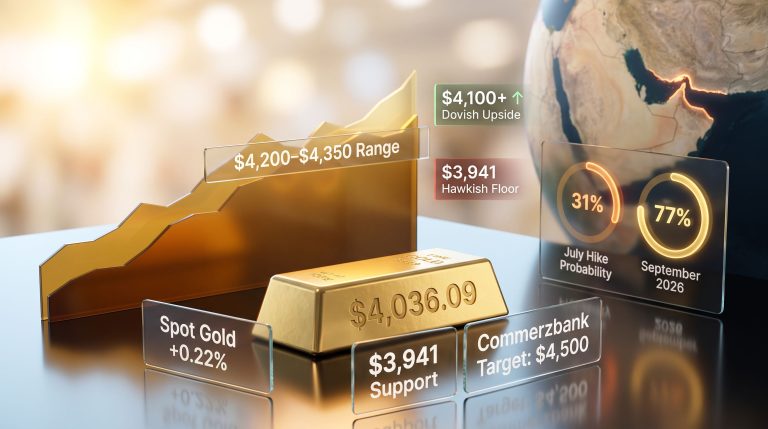
Featured Snippet: When CME FedWatch assigns a 68% probability to a rate hold and a 32% probability to a 25 basis point hike, markets are operating in a zone of genuine uncertainty. This probability distribution is unusually wide for a Fed decision window, meaning the range of possible gold price outcomes is correspondingly broad. A dovish surprise carries significant upside potential; a hawkish surprise carries meaningful downside risk.
The U.S. Dollar Index fell 0.08% to 101.33 ahead of the decision, having reached its highest level since June 25 in the prior session. That modest retreat reflects hesitation rather than conviction, and it is exactly the kind of low-conviction environment where a surprise policy signal, in either direction, can produce outsized price moves. In addition, the interplay between gold and bond dynamics during such windows further complicates the outlook for institutional allocators.
The Warsh Factor: How Central Bank Communication Shapes Precious Metals Positioning
The rate decision itself is only half the equation. Chair Kevin Warsh's press conference, scheduled for 1830 GMT, carries equivalent market weight because forward guidance shapes real yield expectations more durably than any single rate adjustment.
- Hawkish guidance, even without an actual rate change, can reinforce dollar strength and suppress gold's near-term trajectory by signalling that the rate peak remains distant
- Neutral or dovish guidance could accelerate a relief rally, particularly if it triggers an unwinding of the bearish positioning that has built up among retail-proxy COMEX traders
- OANDA senior analyst Kelvin Wong has noted that a combination of a rate hold and softer forward guidance from Warsh could catalyse a meaningful rebound from current levels, as current bearish positioning has left room for a sharp repricing if hawkish expectations are not confirmed
Scenario Modelling: Three Fed Outcomes and Their Gold Price Implications
| Fed Outcome | Probability (CME FedWatch) | Expected Gold Price Direction | Key Risk Factor |
|---|---|---|---|
| Rate Hold + Neutral Guidance | ~50% (estimated) | Rally toward $4,200-$4,500 | Inflation re-acceleration |
| Rate Hold + Hawkish Guidance | ~18% (estimated) | Sideways to mild decline | Dollar strength persistence |
| 25bp Rate Hike | 32% | Downside test below $4,000 | Real yield spike |
Is the East-West ETF Divergence a Temporary Anomaly or a Structural Realignment?
North American Outflows vs. Asian Inflows: Reading the Capital Flow Divergence
The most striking data point from H1 2026 is not a single price level or a positioning figure. It is the $20.1 billion directional divergence between North American and Asian gold ETF flows occurring simultaneously.
- North American gold ETFs shed $7.7 billion in H1 2026, reflecting rate-sensitive institutional selling as real yields climbed and dollar strength compressed returns
- Asian gold ETFs attracted a record $12.4 billion over the same period, with India's $3.9 billion in net inflows representing the largest single-country contribution
- Indian gold funds continued attracting capital, including $388.5 million in a single month, even during periods of lower spot prices, pointing to price-insensitive accumulation behaviour characteristic of long-term reserve building rather than tactical trading
This divergence carries important analytical implications. Western gold ETF flows tend to be driven by rate expectations and dollar dynamics, making them highly responsive to Fed communication. Asian flows, particularly from India, appear to reflect a structurally different investment thesis: gold as a long-term savings vehicle and currency hedge rather than a short-duration tactical trade.
What the COMEX Positioning Data Reveals About Institutional Conviction
The COMEX net long positioning data adds another dimension to this picture. In June 2026, large non-managed-money traders increased net long positions by 16% month-over-month to 538 tonnes, the highest reading since January.
Critically, this increase was not driven by retail-proxy participants, who actually reduced exposure over the same period. The bifurcation between sophisticated large-trader accumulation and retail-level retreat is a historically significant contrarian signal.
When institutional capital moves in the opposite direction to retail sentiment during a period of headline uncertainty, it often reflects longer-duration conviction rather than short-term momentum trading. The question is always whether the data confirms that divergence before price action closes the gap.
How Do Geopolitical Pressures Compound the Rate-Risk Equation for Gold?
The Oil-Inflation-Gold Feedback Loop
Monetary policy is not operating in isolation. U.S. and Saudi military strikes on Iran-backed forces in Iraq pushed oil prices higher in July 2026, introducing a secondary inflation channel that complicates the Fed's rate path calculation.
The transmission mechanism works as follows:
- Geopolitical disruption raises energy prices through supply risk premiums
- Higher energy prices feed into cost-push inflation across goods and services
- Elevated inflation extends the period during which the Fed must maintain restrictive monetary policy
- Extended restrictiveness maintains pressure on gold through the real yield and dollar channels
- But simultaneously, elevated inflation also reinforces gold's safe-haven and inflation-hedge appeal, creating a competing upward price force
The European Central Bank and the Bank of Japan both tightened policy in parallel during this period, expanding the global rate headwind facing gold across all major investment markets. When rate headwinds are geographically coordinated, the negative pressure on gold is amplified because there is no major currency bloc offering a lower-rate environment into which gold allocations can rotate.
Why Gold Is Holding Above $4,000 Despite Multiple Headwinds
Gold's persistence above the $4,000 per ounce psychological floor in the face of dollar strength, rising real yields, and coordinated global tightening is itself analytically significant. It suggests one of two things, or more likely a combination of both:
- Much of the negative rate outlook has already been embedded in current prices, meaning the marginal impact of further tightening is diminishing
- Structural demand from central banks and Asian institutional buyers is providing a demand absorption mechanism that limits the depth of any technically-driven selloff
The next major ASX story will hit our subscribers first
What Are the Key Upside and Downside Scenarios for Gold Through Year-End 2026?
The Bull Case: $4,500 and the Conditions Required to Get There
Commerzbank's year-end target of $4,500 per troy ounce, approximately 11% above July 2026 levels, represents a credible but conditional outcome. These gold price forecasts are closely watched by institutional allocators seeking to model their exposure. The conditions required include:
- A Fed rate hold sustained through the remainder of 2026, preventing further real yield appreciation
- Softening forward guidance from Chair Warsh that reduces dollar demand and allows a repricing of rate expectations
- Sustained central bank purchasing above the five-year quarterly average, maintaining the structural demand floor
- Continued Asian ETF inflows that offset any residual Western fund-level outflows
Commerzbank's parallel $67 per troy ounce year-end target for silver reflects a correlated precious metals outlook. However, monitoring the gold-silver ratio remains essential, as silver tends to amplify gold's directional moves with higher volatility.
The Bear Case: Sub-$4,000 and What Could Trigger It
The downside scenario is more precisely defined by the 32% probability currently assigned to a 25 basis point rate hike. If enacted, the transmission mechanism would be rapid:
- Real yields spike as nominal rates rise faster than inflation expectations adjust
- The U.S. dollar strengthens, compressing gold's dollar-denominated price
- ETF outflows accelerate beyond the $7.7 billion already recorded in H1 2026
- Global gold ETF AUM, already contracted 13% to $526 billion, faces further redemption pressure
SMBC Chief FX Strategist Hirofumi Suzuki has flagged that a hawkish Fed outcome could push USD/JPY toward 164, raising the probability of Japanese currency intervention. A yen intervention would introduce additional cross-asset volatility that could temporarily suppress gold alongside broader risk assets.
The Data Lag Problem: Why Positioning Signals Are Always Backward-Looking
One of the least-discussed structural challenges in gold market analysis is the reporting lag inherent in the most important institutional data sources. COMEX net long reports and World Gold Council ETF flow data are both released on a monthly lag, meaning significant price action can occur and resolve before the underlying institutional positioning is confirmed.
This lag creates an asymmetric opportunity for investors who can identify structural demand signals early. According to J.P. Morgan's commodities research, the next World Gold Council ETF flow release will be the critical validation point for whether institutional gold buying and Fed expectations remain aligned through the decision window, or whether the observed COMEX positioning divergence was a false signal that preceded a broader institutional retreat.
Strategic Takeaways: What Institutional Gold Positioning Signals for Investors
Key Monitoring Signals for the Remainder of 2026
| Signal | What to Watch | Bullish Threshold | Bearish Threshold |
|---|---|---|---|
| Fed Forward Guidance | Warsh press conference tone | Neutral or dovish pivot | Explicit hawkish bias |
| COMEX Net Longs | Monthly WGC positioning report | Sustained above 500 tonnes | Decline below 450 tonnes |
| Asian ETF Flows | Monthly WGC ETF flow report | Continued positive inflows | Reversal to net outflows |
| U.S. Dollar Index | Weekly DXY trend | Sustained below 101 | Break above 103 |
| Real 10-Year Treasury Yield | Daily TIPS market | Decline below 2.0% | Rise above 2.5% |
| Central Bank Purchases | Quarterly WGC demand report | Above 200 tonnes/quarter | Below 150 tonnes/quarter |
The Contrarian Framework: Accumulation During Uncertainty as a Long-Term Strategy
The pattern visible across central bank behaviour, large-trader COMEX positioning, and Indian ETF inflows in H1 2026 reflects a consistent investment philosophy: countercyclical accumulation during periods of headline-driven sentiment weakness.
Central banks and sophisticated large-scale traders have repeatedly used price weakness and sentiment deterioration as entry windows rather than exit signals. The $388.5 million monthly inflow into Indian gold funds during a period of lower spot prices is a textbook illustration of this approach, where the investment decision is anchored to long-term reserve function rather than short-term price momentum.
For investors seeking to apply a similar framework, the key discipline is distinguishing between price weakness driven by genuine structural deterioration in gold's demand fundamentals versus weakness driven by temporary macro noise, such as a single Fed decision or a short-duration dollar rally. The weight of current evidence, particularly the 244 tonnes of central bank buying in Q1 2026 alone and the record Asian ETF inflows, suggests the latter is the more accurate characterisation of institutional gold buying and Fed expectations at this juncture.
Disclaimer: This article is intended for informational purposes only and does not constitute financial advice. Gold price forecasts, including Commerzbank's $4,500 year-end target, are analyst projections based on specific assumptions that may not materialise. Probability estimates from CME FedWatch reflect real-time market pricing and are subject to rapid change. Past patterns of institutional accumulation do not guarantee future price outcomes. Investors should conduct independent research and consult a qualified financial adviser before making investment decisions.
Want to Stay Ahead of the Next Major Mineral Discovery Before the Market Moves?
While institutional gold buying and Fed policy divergence dominate precious metals headlines, Discovery Alert's proprietary Discovery IQ model scans ASX announcements in real time — instantly identifying significant mineral discoveries across 30-plus commodities and translating complex data into actionable investment intelligence. Explore how historic discoveries have generated substantial returns on Discovery Alert's dedicated discoveries page, and begin your 14-day free trial today to position yourself at the forefront of the next major ASX find.