July 29, 2026
Why Gold's Biggest Corrections Have Always Been the Worst Time to Sell
Secular bull markets in any asset class share one uncomfortable feature: they do not travel in straight lines. The path from a generational low to a generational high is almost always interrupted by drawdowns severe enough to convince the majority of participants that the trend has permanently reversed. In gold markets specifically, this psychological trap has repeated itself with remarkable consistency across every major cycle since the early 1970s. Understanding why it happens, and more importantly when it matters, requires separating the price signal from the mechanism signal — a distinction that most market commentary never bothers to make.
The gold 1970s correction compared to today is not simply a chart-pattern exercise. It is a structural question about whether the forces that originally set a bull market in motion have genuinely reversed, or whether what looks like a trend ending is actually a mid-cycle shakeout clearing the path for the next major advance.
When big ASX news breaks, our subscribers know first
The Two Timescales That Govern Gold's Price Behaviour
Gold operates on two entirely different clocks, and conflating them is the root cause of most analytical errors made during corrections.
The fast clock governs short-duration price movements and is driven by variables that can shift within weeks or months:
- Central bank policy signals and interest rate expectations
- Real yield fluctuations across major sovereign bond markets
- U.S. dollar index movements and relative currency strength
- Speculative positioning and momentum-driven capital flows
- Geopolitical event risk and short-term safe-haven demand
The slow clock operates across years and decades, driven by structural forces that are far less responsive to policy interventions:
- The long-term erosion of fiat currency purchasing power
- Expansion of sovereign debt-to-GDP ratios across major economies
- Central bank reserve diversification strategies
- The structural inelasticity of physical gold supply
Core Analytical Principle: Corrections in gold almost exclusively occur on the fast clock. Bull markets are built, sustained, and ultimately ended on the slow clock. Investors who mistake fast-clock volatility for slow-clock trend reversals consistently exit positions at precisely the wrong moment.
This framework is not abstract. It has direct historical precedent in the most dramatic mid-cycle correction gold has ever experienced.
What the 1970s Gold Market Actually Looked Like From the Inside
From Government Ceiling to Free Market Price
For nearly three decades before August 1971, gold was not a market asset in any meaningful sense. The Bretton Woods agreement, established in 1944 among 44 nations, fixed the U.S. dollar to gold at $35 per ounce and tied global currencies to the dollar. Gold had a price, but it was an administered one — a government-enforced ceiling rather than a reflection of supply and demand.
When President Nixon suspended dollar convertibility to gold in August 1971, that ceiling disappeared overnight. The end of the gold standard marked the first time in a generation that gold was free to find its own market price — and it moved immediately. (Source: Federal Reserve History)
The trajectory over the following years was extraordinary:
- Late 1971: Gold trades near approximately $43 per ounce, up from the fixed $35 rate
- 1973: Price climbs above $120 per ounce as dollar weakness accelerates
- December 1974: Gold reaches roughly $195 per ounce — a gain exceeding 400% from the Bretton Woods ceiling in approximately three years (Source: LBMA Historical Data)
The Mechanism Behind the 1970s Bull Market
The foundational driver of gold's 1970s advance was monetary debasement — a government spending more than it taxed, financing the difference through mechanisms that reduced the purchasing power of the currency. Supporting that foundation were several compounding forces:
- Persistent federal deficit spending throughout the decade
- Inflation running consistently above any level the Federal Reserve was willing to address aggressively
- The 1973 Arab oil embargo, which delivered a supply shock that translated directly into broader price pressures
- A second oil shock in 1979, following the Iranian Revolution
- Geopolitical acceleration events in 1979 including the Iranian hostage crisis and Soviet intervention in Afghanistan (Source: Federal Reserve History)
None of these drivers disappeared during what happened next.
The 1974 to 1976 Correction: Numbers, Causes, and What Was Missed
The Numbers Behind the Mid-Cycle Collapse
| Metric | Data Point | Source |
|---|---|---|
| 1974 peak price | ~$195 per ounce | LBMA Historical Data |
| 1976 trough price | ~$100–$112 per ounce | LBMA Historical Data / World Gold Council |
| Correction magnitude | ~45–47% | LBMA / World Gold Council |
| Correction duration | ~2 years (1974–1976) | LBMA Historical Data |
| Recovery to 1980 peak | ~$850 per ounce | LBMA Historical Data |
| Gain from 1976 trough to 1980 peak | >650% | LBMA Historical Data |
| Total 1971–1980 bull market return | >2,000% (20x+) | LBMA / Federal Reserve History |
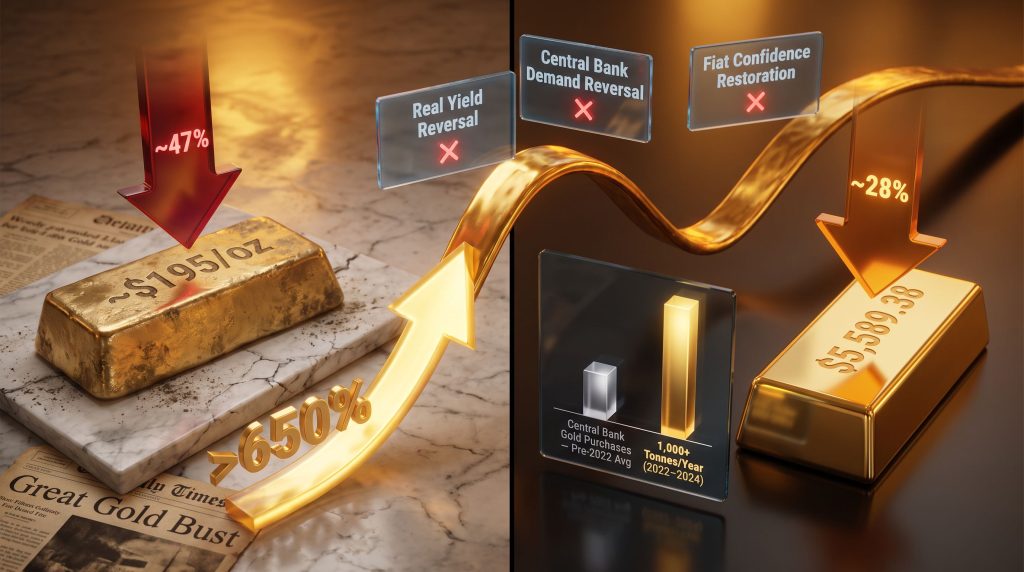
A nearly 47% drawdown over approximately two years represented, in price terms, the apparent destruction of the gold thesis. Financial media responded accordingly. In August 1976, a prominent newsweekly ran a cover story treating the entire gold experiment as a concluded chapter — a consensus position that would prove to be one of the most consequential analytical misjudgments of the decade. Furthermore, the historical gold price data from this era illustrates just how dramatically sentiment diverged from the underlying structural reality.
What Actually Caused the Correction
Two distinct forces converged to produce the 1974 to 1976 decline:
1. Speculative capital rotation: The first leg of the bull market had attracted significant momentum-driven capital. Speculative positioning at extremes requires an eventual exit, and that exit created selling pressure that bore no relationship to the underlying monetary thesis.
2. Active institutional suppression: This is the lesser-known component of the 1974 to 1976 story. The U.S. government was not a passive observer during this correction. Washington actively lobbied the International Monetary Fund to conduct gold reserve auctions and pursued an international campaign to structurally remove gold from the global monetary system. (Source: IMF Historical Archives / Federal Reserve History) These auctions increased the visible supply of gold in the market at a time when speculative positioning was already unwinding — a coordinated headwind that the price could not easily absorb.
Key Historical Insight: What the 1976 consensus missed was not a sentiment misread. It was a mechanism misread. Analysts evaluated the price and concluded the thesis had failed. But the dollar was still losing purchasing power. Deficits were still expanding. Inflation had not been addressed. The mechanism was completely intact.
The investors who held through that correction and ignored the prevailing consensus then watched gold advance from approximately $112 to $850 per ounce by January 1980 — a gain exceeding 650% from the trough. (Source: LBMA Historical Data)
Three Gold Corrections Compared: A Structural Framework
| Scenario | Peak Price | Trough Price | Drawdown % | Duration | Bull Market Intact? | Cycle-Ending Mechanism |
|---|---|---|---|---|---|---|
| 1974–1976 Mid-Cycle | ~$195 | ~$100–$112 | ~45–47% | ~2 years | Yes | Volcker rate shock (1980) ended the cycle |
| 2011–2015 Bear Correction | ~$1,920 | ~$1,050 | ~45% | ~4 years | Debated | Real yield normalisation + USD strengthening |
| Current Cycle (2026) | $5,589.38 (Jan 28, 2026) | ~$4,000 (July 2026) | ~28% | Months | Under analysis | Mechanism not yet reversed |
Sources: LBMA Historical Data; World Gold Council; Federal Reserve History
The table above reveals a pattern that price-only analysis consistently obscures. Drawdowns of 25% to 50% have appeared across multiple distinct gold bull markets without signalling their end. The variable that actually determines whether a cycle has terminated is not the depth of the decline but whether the structural driver has reversed. Consequently, understanding gold and bond dynamics across economic cycles adds further context to why these corrections are so frequently misread.
What Is Driving Gold in the Current Cycle — And How Does It Differ From the 1970s?
The Central Bank Accumulation Shift
The current gold bull contains one structural element that has no equivalent in the 1970s: the systematic accumulation of physical gold by the same sovereign institutions that issue fiat currency. Central bank gold buying crossed 1,000 tonnes per year in 2022, 2023, and 2024 — approaching double the average annual acquisition pace of the preceding decade. (Source: World Gold Council Gold Demand Trends)
The catalyst for this shift was specific and identifiable. When Western governments froze Russia's dollar-denominated foreign exchange reserves in 2022, sovereign institutions around the world drew a direct conclusion: assets held in a foreign currency can be seized through political decision. Physical gold, held within a nation's own borders, carries no such counterparty risk. The institutions most responsible for creating fiat currency were quietly signalling their own assessment of its long-term reliability.
Key Structural Differences Between the 1970s and Today
| Factor | 1970s Gold Bull | Current Cycle |
|---|---|---|
| Primary driver | Dollar decoupling + inflation | Reserve diversification + debasement |
| Central bank behaviour | Net sellers / suppression campaigns | Net buyers at record pace (1,000+ t/year) |
| Geopolitical catalyst | Oil shocks, Cold War escalation | Dollar weaponisation, multipolar reserve shift |
| Gold supply growth | Moderate | Less than 1% per year (World Gold Council) |
| Real yield environment | Deeply negative through most of cycle | Contested; not yet decisively positive |
| Inflation vs. target | Persistently above Fed comfort range | Above 2% Fed target as of 2026 |
Sources: World Gold Council; Federal Reserve History; LBMA
The Supply Constraint That Amplifies Every Demand Surge
Annual gold mine supply grows at less than 1% per year — a structural ceiling that responds extremely slowly, if at all, to price signals. (Source: World Gold Council) New mine development from discovery to first production typically spans seven to fifteen years. Unlike fiat currency, gold supply cannot be expanded through a policy decision or a central bank balance sheet operation.
This asymmetry between elastic demand and structurally inelastic supply creates the conditions for outsized price responses when large institutional buyers enter the market. Furthermore, central banks influencing gold prices in this manner represents a structural shift with no historical parallel in prior cycles. When sovereign wealth funds, central banks, and new demand categories such as gold-backed financial instruments all compete for a supply base growing at sub-1% annually, the mathematics of price discovery become increasingly one-sided.
The next major ASX story will hit our subscribers first
What Would Actually End the Current Gold Bull Market?
The Volcker Template
History provides one clear example of a successfully executed cycle termination. Federal Reserve Chair Paul Volcker raised the federal funds rate to approximately 20% between 1979 and 1981, deliberately engineering a recession to break the back of inflation. (Source: Federal Reserve History) For the first time in a decade, cash yielded more than inflation in real terms. The core mechanism driving gold — negative real yields and persistent purchasing power erosion — reversed completely.
Gold then entered a bear market lasting approximately twenty years. Inflation-adjusted gold prices did not recover to their 1980 peak levels until 2024. However, it is worth noting that gold in recessions does not always behave predictably, and the path through economic downturns has historically varied depending on the prevailing monetary environment.
Three Conditions That Would Signal Cycle Termination
Based on the historical evidence, three specific developments would constitute credible signals that the structural bull market in gold has ended:
- Real yield reversal at scale: Federal funds rate rising sufficiently above the prevailing inflation rate to make cash genuinely attractive in purchasing-power-adjusted terms, reproducing the conditions Volcker created in 1980
- Central bank demand reversal: Sovereign institutions abandoning their gold accumulation programmes and returning net flows into dollar-denominated reserve assets at scale
- Structural fiat confidence restoration: A credible and sustained reduction in sovereign debt-to-GDP trajectories across major economies, removing the long-term debasement pressure that underpins gold's structural bid
Analytical Note: As of mid-2026, none of these three conditions are in evidence. The absence of a cycle-ending mechanism does not guarantee continued price appreciation, but it does mean the analytically rigorous question is not whether the price has fallen — it is whether the mechanism has changed.
Contextualising the Current ~28% Drawdown
Gold reached an all-time high of $5,589.38 per ounce on January 28, 2026. (Source: World Gold Council) As of late July 2026, prices trade near approximately $4,000, representing a drawdown of roughly 28% from that peak. (Source: LBMA / live market data)
Placed against the historical comparison set, this drawdown sits well within the range of mid-cycle corrections observed in prior intact gold bull markets. The 1974 to 1976 correction reached approximately 47%. The 2011 to 2015 correction reached approximately 45%. Both occurred within broader structural uptrends and were followed by significant subsequent advances.
The questions worth applying to the current environment are concrete:
- Has the structural driver of the current bull — reserve diversification and dollar debasement — reversed? (Evidence to date: No)
- Have real yields risen sufficiently to make cash attractive against inflation? (Evidence: Contested, no definitive reversal)
- Has central bank demand for gold declined materially? (Evidence: No — 1,000+ tonnes per year maintained through 2024)
- Is gold supply growing fast enough to absorb structural demand pressure? (Evidence: No — sub-1% annual supply growth)
The investors who held through 1976 and dismissed the prevailing consensus that declared the gold experiment finished ultimately captured the largest single price advance of the entire decade. The investors who read the headlines and sold did not.
Frequently Asked Questions: Gold 1970s Correction Compared to Today
How deep was the gold correction in the 1970s?
Gold declined approximately 45 to 47% from its December 1974 peak of roughly $195 per ounce to its August 1976 trough of approximately $100 to $112 per ounce. The correction lasted approximately two years. Following that trough, gold advanced more than 650% to reach $850 per ounce by January 1980. (Source: LBMA Historical Data / World Gold Council)
What caused gold to fall so sharply in the mid-1970s?
Two primary forces drove the 1974 to 1976 correction: the exit of speculative capital that had entered during the initial post-Bretton Woods surge, and an active U.S. government campaign to suppress gold prices through IMF reserve auctions and international lobbying to remove gold from the monetary system. The underlying bull market thesis — dollar purchasing power erosion — remained intact throughout. (Source: IMF Historical Archives / Federal Reserve History)
How does the current gold correction compare to the 1970s?
The gold 1970s correction compared to today shows a current drawdown from the January 2026 all-time high of $5,589.38 of approximately 28% as of mid-2026 — shallower than the 1974 to 1976 correction but occurring within a structurally similar macro environment. The key analytical question is whether the mechanism driving the current bull has reversed — which the available evidence does not support. (Source: World Gold Council / LBMA)
What finally ended the 1970s gold bull market?
Federal Reserve Chair Paul Volcker ended the cycle by raising the federal funds rate to approximately 20%, creating genuinely positive real yields for the first time in a decade. This reversed the core mechanism driving gold. Gold subsequently entered a twenty-year bear market. (Source: Federal Reserve History)
Is a 25% to 50% drawdown normal in a gold bull market?
Historical evidence across multiple gold bull cycles confirms that drawdowns of 25% to 50% can occur within intact secular uptrends. The 1974 to 1976 correction of approximately 47% and the 2011 to 2015 correction of approximately 45% both occurred within broader structural bull phases. Drawdown magnitude alone is an insufficient signal for determining whether a bull market has ended. For broader context, gold price history spanning these cycles illustrates how frequently such corrections have been misinterpreted as permanent trend reversals.
Why are central banks buying so much gold today?
The acceleration in sovereign gold acquisition — crossing 1,000 tonnes per year from 2022 onward — was catalysed by the freezing of Russia's dollar-denominated foreign exchange reserves, which demonstrated to sovereign institutions that dollar assets carry political risk that physical gold does not. This structural shift in reserve management behaviour represents a demand dynamic that was entirely absent from the 1970s cycle. (Source: World Gold Council Gold Demand Trends)
Key Takeaways: What the Historical Record Actually Says
- A ~47% mid-cycle correction in the 1970s did not end the gold bull market — it preceded the largest single advance of the entire decade, with gold rising more than 650% from the 1976 trough to the 1980 peak
- Bull markets in gold end when the underlying mechanism reverses — not when the price falls or when consensus turns negative
- The 1970s cycle ended specifically because Volcker created genuinely positive real yields at approximately 20% federal funds rate — a condition not present in the current environment
- Central bank gold demand has structurally shifted since 2022, adding an institutional accumulation layer that was entirely absent from the 1970s cycle
- The current ~28% drawdown from the January 2026 all-time high of $5,589.38 sits within the historical range of mid-cycle corrections observed in prior intact gold bull markets
- The critical analytical variable is not the price — it is whether the mechanism driving the bull has reversed
Disclaimer: This article is for informational and educational purposes only and does not constitute financial or investment advice. Past performance is not indicative of future results. Gold and other precious metals involve risk and may result in partial or total loss of capital. Always consult a qualified financial adviser before making investment decisions.
Want to Track the Next Major Gold or Mineral Discovery Before the Broader Market Does?
Discovery Alert's proprietary Discovery IQ model delivers real-time alerts on significant ASX mineral discoveries, instantly translating complex data into actionable insights for both short-term traders and long-term investors — explore the historic returns major discoveries have generated and begin your 14-day free trial at Discovery Alert to position yourself ahead of the market.