June 12, 2026
The Monetary Policy Transmission Nobody Talks About: How Rate Probability Repricing Moves Gold Before the Fed Does
Most investors understand that Federal Reserve interest rate decisions affect gold prices. Far fewer appreciate that the anticipation of those decisions, specifically the probability-weighted expectations embedded in futures markets weeks or months before any official announcement, can be far more powerful than the decisions themselves. This forward-pricing dynamic sits at the core of gold falls on December Fed rate hike odds, and understanding it is essential for anyone trying to navigate the precious metals market in the second half of 2026.
When big ASX news breaks, our subscribers know first
Why Gold Falls When December Fed Rate Hike Odds Rise
Gold's structural sensitivity to rate expectations is rooted in one unavoidable reality: gold produces no income. It pays no coupon, issues no dividend, and generates no cash flow. This characteristic, unremarkable in a zero-rate environment, becomes a meaningful liability when interest-bearing alternatives offer compelling real returns.
The opportunity cost framework operates through three reinforcing channels:
- Real yield expansion: When rate hike expectations lift nominal Treasury yields, real yields (nominal yields adjusted for inflation) rise in parallel. Gold, offering a real yield of precisely zero, becomes comparatively less attractive as that gap widens.
- Dollar strength: Higher expected returns on USD-denominated assets draw capital flows into the dollar, lifting the dollar index. Because gold is priced globally in US dollars, a stronger greenback reduces purchasing power for international buyers and compresses demand.
- Futures market repositioning: Institutional traders holding net long gold positions in COMEX futures respond to shifting CME FedWatch probability data by reducing exposure, amplifying spot price moves beyond what the underlying macro shift might ordinarily justify.
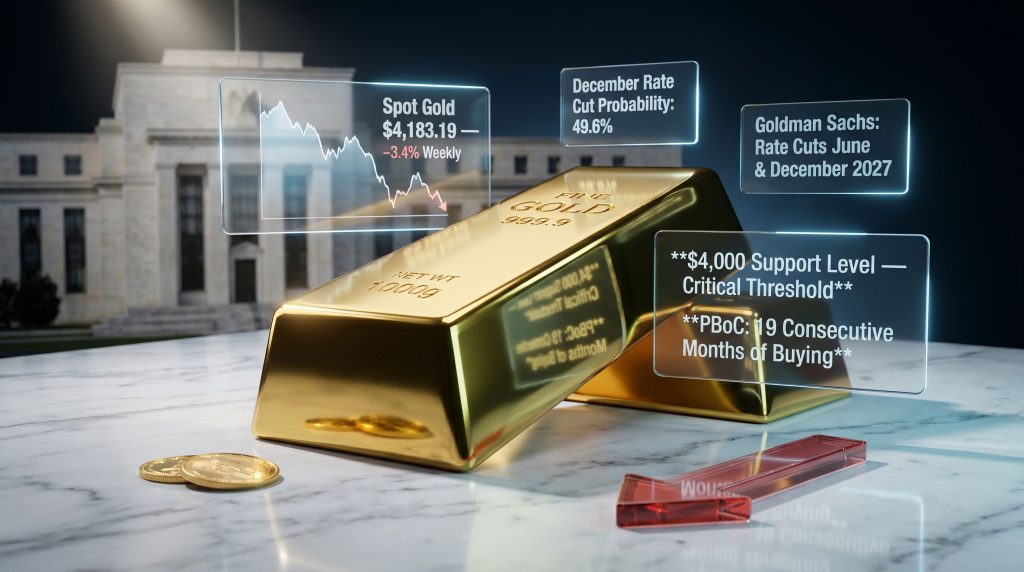
What makes the current episode particularly instructive is the speed at which these channels activated simultaneously. The CME FedWatch tool showed December rate hike probability moving from approximately 67% implied cut probability to just 49.6%, effectively flipping the market's base case from easing to genuine uncertainty. That probabilistic shift alone was sufficient to drive gold into a multi-week corrective trend.
The CME FedWatch Transmission: Probability Shifts and Market Repricing
| Fed Rate Probability Indicator | Earlier Reading | Recent Reading | Directional Shift |
|---|---|---|---|
| December rate cut probability | ~67% | ~49.6% | Hawkish repricing |
| December rate hike/hold odds | ~33% | ~60% | Rising sharply |
| 10-year Treasury yield | Below 4.0% | 4.453% | Higher |
| Gold spot price | Near cycle highs | ~$4,183 | Declining |
A critical and underappreciated nuance here is that markets do not wait for the Fed to act. They price the expected future environment continuously. This means gold can suffer sustained losses even while current macro conditions, a weaker dollar, lower yields, and strong physical demand, remain nominally supportive. The forward-pricing mechanism disconnects gold from its contemporaneous correlations when rate probability shifts are large enough.
Energy-Driven Inflation and Its Complicated Relationship With Fed Policy
The inflation catalyst behind the current rate hike repricing is not the garden-variety demand-pull inflation that the Fed's standard toolkit is designed to address. May US Producer Price Index data recorded its largest annual increase in 3.5 years, driven predominantly by energy costs tied to geopolitical conflict in the Middle East.
This distinction matters enormously for policy analysis. Supply-side, energy-driven inflation creates a genuine dilemma for the Federal Reserve because:
- It cannot be resolved through monetary tightening alone – raising rates does not produce more oil or reopen shipping lanes.
- It transmits rapidly through the broader cost structure – energy is an input for transportation, manufacturing, chemicals, and agriculture, meaning its price pressures bleed into core inflation over time.
- It complicates the dual mandate – the Fed must weigh price stability against employment stability, and supply shocks force that trade-off into sharp relief.
Even if the geopolitical conditions contributing to the energy price spike were to ease relatively quickly, inflation data already embedded in official indices would continue to support the case for a hawkish Fed posture through the December meeting. Markets price forward expectations built on existing data, not on hypothetical resolutions.
This lag effect is a lesser-known dynamic in gold markets. Traders and commentators often assume that a ceasefire or peace agreement would immediately reverse gold's downward pressure. However, the reality is more complex: inflation prints take months to normalise even after the underlying supply shock abates, and the Fed's response function is calibrated to observed data, not anticipated improvements. The relationship between gold and bonds further complicates this picture, particularly when yield dynamics shift rapidly.
Goldman Sachs Revises Its Rate Cut Timeline
Goldman Sachs materially shifted its Federal Reserve forecast, pushing projected rate cuts out to June and December 2027, a significant revision from earlier 2026 expectations. This repositioning signals that the bank's economists believe the terminal rate environment will remain elevated for considerably longer than the market previously anticipated.
The practical implications of a prolonged high-rate environment for gold investors are substantial:
- The opportunity cost drag on gold extends across a longer time horizon, compressing the discounted value of holding the metal.
- Institutional price targets are revised downward as the expected return advantage of alternatives persists.
- ANZ Bank reduced its year-end gold price target by $400 to $5,200, a downward revision that reflects the more cautious monetary policy timeline now embedded in institutional consensus.
Gold Falls 3.4% Despite a Weaker Dollar and Lower Treasury Yields
Perhaps the most analytically revealing feature of gold's recent price action is that it posted a 3.4% weekly loss while two of its most reliable macro support factors moved in its favour. The US dollar index declined 0.41% to 99.64, and the 10-year Treasury yield fell 8.7 basis points to 4.453%. Under conventional macro logic, both of these moves should have provided gold with meaningful upside support.
The fact that gold declined despite this combination reveals the dominant force at work: forward-looking rate hike probability is overriding contemporaneous macro conditions. This is not unusual historically, but the magnitude of the divergence is notable. Furthermore, understanding gold safe-haven dynamics becomes especially relevant when conventional correlations break down in this way.
| Gold Instrument | Price Level | Weekly Move |
|---|---|---|
| Spot gold | $4,183.19 | -3.4% (weekly) |
| August gold futures | $4,204.40 | +2.2% (session rebound) |
| Six-month low (intraday) | $4,022.29 | Tested during the week |
| Session close (geopolitical catalyst) | $4,219.69 | Post-headline recovery |
The divergence between spot and futures pricing reflects the short-term volatility introduced by geopolitical headlines. Gold briefly recovered to $4,219.69 after news that planned military strikes on Iran were cancelled, though Iranian officials noted no final agreement had been reached.
This headline-driven bounce illustrates a secondary dynamic worth understanding: geopolitical risk premiums can temporarily overwhelm rate-driven selling pressure, but they are inherently unstable and tend to fade rapidly.
When gold falls on December Fed rate hike odds rising sharply, the forward-looking repricing of monetary policy can outweigh short-term dollar weakness or yield movements. Markets are pricing the expected future environment, not the current one. This distinction separates investors who understand the mechanism from those who are confused by the price action.
The $4,000 Gold Support Level: Technical Anchor and Fundamental Threshold
The $4,000 per ounce level functions simultaneously as a psychological price anchor, a technical reference point, and a fundamental cost benchmark for the gold industry. Market analysts including Edward Meir and Peter Fung have both identified this level as the critical threshold separating a corrective pullback from a structurally more damaging trend change.
Why $4,000 carries such analytical weight:
- It represents approximately a 20% decline from recent cycle highs, consistent with the conventional technical definition of a bear market threshold.
- Producer all-in sustaining costs (AISC) for mid-tier gold miners are approaching this range, meaning further price weakness would compress operating margins materially and potentially trigger production curtailments.
- Institutional stop-loss clusters and options market positioning tend to concentrate near round-number psychological levels, creating self-reinforcing dynamics when those levels are tested.
A less commonly discussed aspect of the $4,000 level is its relevance to gold producer hedging behaviour. When gold prices approach the AISC threshold for a meaningful portion of the industry, producers face increasing pressure to lock in forward sales through hedging programmes. This additional selling can amplify downward price moves, creating a feedback loop that accelerates the break below key support levels. It is a dynamic that contributed to gold's prolonged weakness during the 2013–2015 corrective cycle.
Two Scenarios for Gold's Next Directional Move
Scenario A: Base Case Stabilisation Above $4,000
- Geopolitical de-escalation reduces energy price pressure over the following 60–90 days.
- May PPI is treated by the Fed as a cyclical spike rather than a persistent trend.
- December rate hike odds retreat from 60% back below 50%.
- Gold stabilises in the $4,100–$4,400 range as institutional outflows moderate.
- ANZ's revised $5,200 year-end target remains achievable on a 6-month view.
Scenario B: Bear Case Break Below $4,000
- December rate hike probability rises above 70% before a formal geopolitical resolution materialises.
- Energy costs remain elevated through June and July, sustaining PPI pressure into the next two inflation prints.
- Institutional ETF outflows accelerate beyond the current 0.3% weekly decline in SPDR Gold Trust holdings.
- Gold breaks below $4,000, triggering margin calls, producer hedging, and a self-reinforcing downside cascade.
- Producer equity valuations face compounding pressure from lower gold prices simultaneously with higher energy-driven operating costs.
The key quantitative trigger to monitor is a move in December rate hike odds from the current 60% to above 70%. Analysts have identified this corridor as the inflection point that would shift the probability balance decisively toward Scenario B.
Physical Demand From India and China: The Structural Price Floor
While institutional and speculative positioning has exerted sustained downward pressure on gold, physical demand signals from the world's two largest gold-consuming nations are providing a meaningful, if partial, counterweight.
India's demand recovery:
- Dealer discounts in India narrowed dramatically from $87 per ounce to $35 per ounce, a compression that signals local buyers are re-entering the market as prices approach more accessible levels.
- The narrowing discount spread is a forward-looking demand indicator: as discounts shrink toward zero and eventually flip to premiums, it signals that import demand is accelerating.
- However, India's elevated gold import duties continue to impose a structural ceiling on demand growth, limiting the degree to which Indian physical buying can absorb global institutional selling pressure.
China's sovereign accumulation:
- The People's Bank of China increased its official gold reserves for a 19th consecutive month, demonstrating a sustained, strategic commitment to gold as a reserve diversification asset.
- Central bank gold buying of this nature is fundamentally different from institutional or retail demand because it is largely price-insensitive, driven by long-term reserve management objectives rather than short-term return optimisation.
- This sovereign accumulation trend, not just from China but from a broader cohort of emerging market central banks, has been a structurally important factor preventing more severe gold price declines during periods of institutional outflows.
| Demand Category | Recent Signal | Price Sensitivity | Duration |
|---|---|---|---|
| India physical buying | Discounts narrowed: $87 to $35/oz | High (price-elastic) | Short-term |
| PBoC reserve accumulation | 19 consecutive months of buying | Low (strategic) | Long-term structural |
| SPDR Gold Trust (ETF) | Holdings fell 0.3% to 923.89 metric tons | High (rate-sensitive) | Medium-term |
| Futures speculative positioning | Net long reduction | Very high (momentum-driven) | Short-term |
The contrast between these demand categories is instructive for portfolio positioning. Central bank buying provides a durable floor because it is driven by reserve management mandates that operate on multi-year timeframes. ETF flows, conversely, respond rapidly to rate expectations and can reverse in weeks. Understanding which type of demand is setting the marginal price at any given moment is one of the more sophisticated frameworks available to gold investors.
The next major ASX story will hit our subscribers first
How Fed Communication Is Displacing Geopolitics as Gold's Primary Driver
A notable shift is underway in the hierarchy of factors driving gold prices. Historically, geopolitical risk premiums have been powerful short-term drivers of gold demand. The metal's role as a safe-haven asset in times of conflict is deeply embedded in investor psychology and institutional practice.
However, Federal Reserve communication has emerged as a more durable and predictable driver than geopolitical developments in the current cycle. Fed officials Christopher Waller and Mary Daly have both signalled that rate cuts would only be appropriate if labour market conditions deteriorated meaningfully. Given that recent employment data has remained resilient, their guidance effectively raises the bar for near-term easing.
Key Fed communication signals and their implications for gold:
- Resilient labour market data signals reduced urgency for rate cuts, increasing opportunity cost and creating bearish gold conditions.
- Conditional easing language from Fed officials reinforces the view that the policy bar for cuts is high, sustaining hawkish repricing.
- Goldman Sachs terminal rate revision to a 2027 timeline introduces an extended period of opportunity cost drag that institutional gold price forecasts must reflect.
- Any surprise deterioration in employment would immediately increase cut probability, potentially triggering rapid gold recovery.
Edward Meir has noted that Fed guidance may become a more important price driver than geopolitical developments for gold, suggesting that even a formal resolution of Middle East tensions may prove insufficient to restore gold's upward trajectory if the Fed's December posture remains hawkish. This is a significant analytical reframing for investors who have been using geopolitical de-escalation as their primary bullish catalyst.
Precious Metals Divergence: Not All That Glitters Falls Equally
The rate-driven correction in gold has not transmitted equally across the precious metals complex, and the divergences are revealing about the different demand structures underlying each metal.
| Metal | Spot Price | Weekly Performance | Primary Driver |
|---|---|---|---|
| Gold | $4,183.19 | -3.4% | Monetary/rate sensitivity dominant |
| Silver | $66.13 | -1.8% (session) | Hybrid: monetary + industrial demand |
| Platinum | $1,715.44 | -0.3% (session) | Industrial demand (auto/hydrogen) |
| Palladium | $1,289.75 | +1.6% session, ~+5% weekly | Auto sector supply dynamics |
Silver's more contained decline relative to gold reflects its dual identity as both a monetary metal and a critical industrial input, particularly in photovoltaic solar panel manufacturing and electronics. Palladium's outperformance during the same period illustrates the point most sharply: its price action was driven by automotive sector supply constraints that have no relationship to Fed policy expectations whatsoever.
This divergence carries a practical implication for portfolio construction. Investors seeking precious metals exposure during a period of rising rate expectations may find that industrially-oriented metals like platinum and palladium offer a more insulated return profile than monetary metals like gold and silver, which carry heavier exposure to the opportunity cost mechanism. In addition, gold equities sensitivity to rate shifts can amplify these dynamics further for investors with equity exposure in the sector.
Key Indicators to Monitor for Gold's Next Move
Primary indicators:
- CME FedWatch December rate hike probability – the single most important real-time indicator; a move above 70% represents the critical risk threshold.
- Monthly CPI and PPI releases – further upside surprises would reinforce the hawkish case and extend gold's corrective phase.
- Fed officials' speeches – any shift from conditional to unconditional easing language would be a powerful positive catalyst.
- 10-year real Treasury yield – sustained moves above 2% would extend opportunity cost pressure materially.
Secondary indicators:
- SPDR Gold Trust weekly holdings – continued outflows from the current 923.89 metric ton level signal ongoing institutional de-risking.
- India dealer premium/discount spread – a move from discounts toward premiums would confirm physical demand recovery is accelerating.
- PBoC monthly reserve data – any pause in the 19-month buying streak would remove a key structural support element.
- Goldman Sachs and ANZ gold price target revisions – institutional forecast changes often precede broader market repositioning by weeks.
Geopolitical overlay:
- Energy price trajectory – the transmission channel from conflict risk to inflation to rate expectations makes energy prices a leading indicator for gold.
- Strait of Hormuz shipping status – a confirmed resumption of normal shipping flows would reduce energy cost pressure and, by extension, rate hike probability.
The Structural Bull Case Has Not Disappeared
It is worth distinguishing between cyclical pressure and structural change. The forces currently weighing on gold, rising rate expectations, ETF outflows, and inflation-driven opportunity cost widening, are cyclical in nature. The structural forces that drove gold's extended rally to recent cycle highs remain largely intact. Consequently, the gold price forecast over a longer horizon still reflects meaningful upside potential once these cyclical headwinds abate.
- Central bank diversification away from USD-denominated reserves continues on a multi-year trajectory that is largely independent of short-term rate dynamics.
- Physical demand from emerging market consumers is growing as a proportion of global income, supporting a secular demand floor.
- The long-term real yield environment remains deeply uncertain, particularly given the structural fiscal dynamics facing major Western economies.
- Geopolitical risk premiums, while currently being discounted by markets anticipating resolution, have not permanently dissipated.
The current environment does not invalidate gold's long-term investment case. It does, however, require investors to exercise patience and to focus on the correct analytical framework. Rate expectations are the dominant variable right now, not geopolitics, not dollar movements, and not short-term Treasury yield fluctuations.
Furthermore, analysts tracking gold price easing against firmer yield data continue to emphasise that the data dependency of Fed policy means any shift in economic conditions could rapidly alter the current trajectory.
The $4,000 level remains the line between a painful but manageable correction and a more structurally damaging decline. For investors positioned in gold or gold equities, the 60% to 70% December rate hike probability corridor is not just a number to monitor. It is the clearest available signal of which scenario is unfolding in real time, and the distinction between gold falls on December Fed rate hike odds versus a sustained structural reversal may ultimately depend on how quickly that corridor resolves.
Disclaimer: This article is for informational purposes only and does not constitute financial advice. All forecasts, price targets, and probability estimates referenced are those of third-party analysts and institutions and should not be taken as investment recommendations. Past performance of gold or any asset class is not indicative of future results. Investors should conduct their own due diligence and consult a qualified financial adviser before making investment decisions.
Want to Stay Ahead of the Next Major Mineral Discovery Before the Market Moves?
While gold price dynamics are shaped by rate expectations and macro forces, the real asymmetric opportunity often lies in significant new mineral discoveries on the ASX — and timing is everything. Discovery Alert's proprietary Discovery IQ model delivers real-time alerts the moment a significant ASX mineral discovery is announced, turning complex data across 30+ commodities into a single, actionable insight — explore historic discovery returns on Discovery Alert's dedicated discoveries page to see what early positioning has looked like, then begin your 14-day free trial at Discovery Alert to ensure you're never the last to know.