June 11, 2026
When Physical Gold Overtakes Paper: Understanding the Forces Behind a Historic Quarter
Across the long arc of commodity market history, there have been periodic moments when the nature of demand for a particular asset shifts in ways that fundamentally alter its market structure. Gold has entered one of those moments, and bar and coin demand drove global gold demand to a record in the first quarter of 2026, marking a decisive structural turning point.
The distinction matters enormously. When institutional capital drives a commodity market, price behaviour tends to follow momentum, sentiment cycles, and liquidity conditions. When retail and high-net-worth physical investors become the dominant force, the demand base becomes stickier, less reactive to short-term sentiment shifts, and more deeply anchored in macroeconomic fundamentals.
The World Gold Council's Q1 2026 Gold Demand Trends report, published in late April 2026, provides compelling evidence that this kind of structural transition may already be underway.
When big ASX news breaks, our subscribers know first
The New Demand Hierarchy: Investment Overtakes Fabrication
For most of gold's modern trading history, jewellery fabrication served as the largest and most stable component of global demand. Consumer markets across Asia and the Middle East provided a relatively predictable annual floor beneath gold consumption, insulating the market from purely speculative swings.
That foundation is now being challenged by a structural rebalancing that has been building across multiple years. According to the World Gold Council's analysis, investment demand has now moved to a position of clear dominance over fabrication demand, driven by a confluence of weaker jewellery consumption and rapidly expanding investor interest in gold as a financial instrument and store of wealth.
This shift carries meaningful implications for price dynamics:
- Investment-led demand is typically more sensitive to macro variables such as real interest rates, currency stability, and geopolitical risk
- Physical investment buyers, particularly in Asian markets, tend to hold positions for longer durations than momentum-driven institutional traders
- The entry of more retail-oriented physical buyers into the market creates price support during periods of institutional selling or ETF outflows
The result is a market where the traditional demand floor has not disappeared but has been supplemented by a new and potentially more durable source of demand at structurally higher price levels.
Q1 2025 vs Q1 2026: Two Very Different Investment Stories
Placing the Q1 2026 data in context requires understanding how radically the composition of demand has shifted from the same period one year prior. Both quarters recorded elevated total demand, but the drivers behind those figures were almost entirely different.
Q1 2025: The ETF-Dominated Quarter
| Demand Category | Q1 2025 Volume | Year-on-Year Change |
|---|---|---|
| Total Demand | ~1,206 MT | +1% |
| Total Investment Demand | ~552 MT | +170% |
| ETF Inflows | ~226.5 MT | Surge vs prior period |
| Bar and Coin Demand | ~325 MT | +3% |
| Central Bank Purchases | ~244 MT | Stable |
| Jewellery Demand | ~434 MT | -19% |
Q1 2025 was an institutionally driven story. Gold ETF inflows of approximately 226.5 MT dominated the investment narrative, reflecting momentum-based capital flows from professional and semi-institutional investors. Physical bar and coin demand was present but grew modestly, at just 3% year-on-year.
Q1 2026: Physical Investment Takes Command
| Demand Category | Q1 2026 Volume | Year-on-Year Change |
|---|---|---|
| Total Demand (incl. OTC) | 1,231 MT | +2% |
| Bar and Coin Demand | 474 MT | +42% |
| ETF Inflows | 62 MT | Slowed sharply |
| Central Bank Purchases | 244 MT | +3% |
| Jewellery Demand | Declined | -23% by volume |
| Technology Demand | 82 MT | +1% |
| Mine Production | 885 MT | +2% |
| Recycling Volumes | 366 MT | +5% |
| Total Supply | 1,231 MT | +2% |
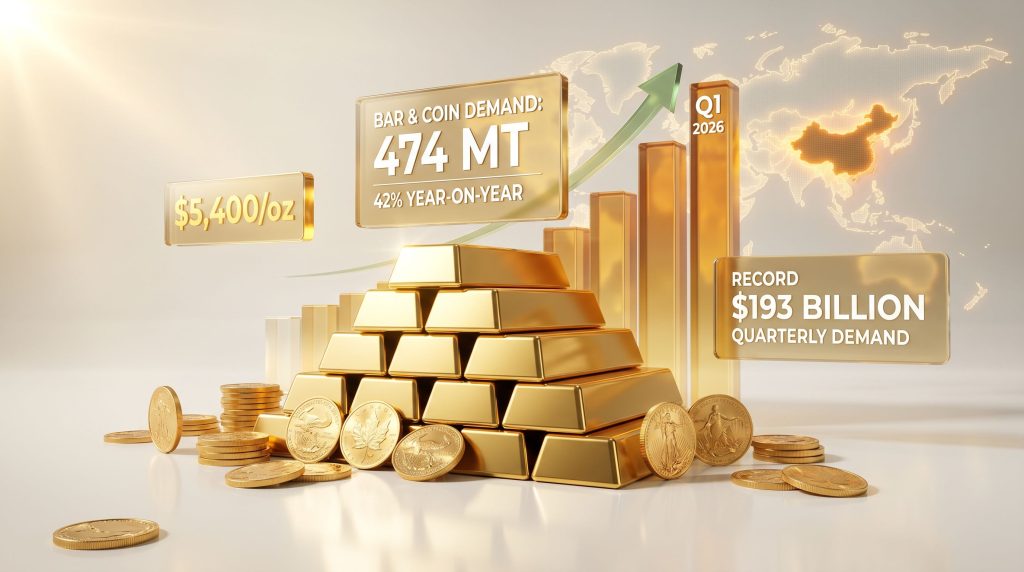
In Q1 2026, the storyline reversed almost completely. ETF inflows slowed dramatically to just 62 MT, a fraction of the prior year's institutional surge. In their place, bar and coin demand drove global gold demand to a record in the first quarter, surging 42% year-on-year to reach 474 MT, representing the second-highest quarterly level ever recorded for that demand category.
"The total value of quarterly gold demand reached $193 billion in Q1 2026, a 74% year-on-year increase driven by both volume expansion and gold's exceptional price performance during the period. World Gold Council Senior Markets Analyst Louise Street noted that this combination of modest volume growth and extraordinary price appreciation produced the record headline figure." (World Gold Council, Gold Demand Trends Q1 2026, via Mining Weekly, April 29, 2026)
This divergence between the two quarters tells a story of market rotation: institutional participants who entered through ETFs in 2025 partially exited or moderated their positions in early 2026, while retail and high-net-worth physical buyers accelerated their accumulation. This is not a random coincidence. It reflects a well-documented behavioural pattern in precious metals markets, where paper instrument demand and physical demand often move in opposing cycles across different investor cohorts.
China's Record Quarter: The Geographic Engine of Physical Gold Demand
No single market factor in Q1 2026 was more consequential than China. China's gold demand in bar and coin terms reached 207 MT during the quarter, surpassing the country's previous record of 155 MT set in Q2 2013 and representing the strongest single-quarter performance ever recorded for Chinese physical gold investment. (World Gold Council, Gold Demand Trends Q1 2026)
Chinese demand alone accounted for approximately 43.7% of global bar and coin demand during the quarter, an extraordinary concentration that underscores the outsized influence of Asian investor behaviour on global gold dynamics.
Why Chinese Investors Are Choosing Physical Gold
The structural drivers behind this surge reflect a complex set of domestic conditions unique to the Chinese investment environment:
- Currency depreciation concerns: Ongoing yuan volatility has reduced confidence in holding domestic currency-denominated savings instruments, making gold an attractive cross-border store of value that is difficult to restrict through capital controls
- Limited alternative investment channels: Regulatory tightening in Chinese equity markets, combined with the prolonged correction in domestic real estate values, has narrowed the range of credible alternative asset classes available to retail investors
- Geopolitical uncertainty: Heightened regional tensions and the broader global geopolitical risk environment have reinforced gold's traditional role as a safe-haven gold asset among Chinese households
- Cultural affinity for physical assets: Unlike Western investors who are comfortable holding gold through paper instruments, Chinese retail investors historically demonstrate a strong preference for physically settled, tangible assets
The 2026 surge also differs meaningfully from the 2013 record it surpassed. The Q2 2013 Chinese gold rush was partly driven by a sharp price correction that made gold appear temporarily cheap to opportunistic buyers. The Q1 2026 episode occurred against a backdrop of record-high gold prices, suggesting that this wave of Chinese demand was not price-opportunistic but rather structurally motivated.
Gold Prices, Volatility, and the $193 Billion Demand Value Record
Gold reached an all-time high of $5,400 per troy ounce in January 2026 before undergoing a correction of approximately 6% by the end of the quarter. (World Gold Council, Gold Demand Trends Q1 2026, via Mining Weekly, April 29, 2026)
This intra-quarter movement is worth examining carefully. A 6% correction from $5,400/oz implies an end-of-quarter price of approximately $5,076/oz. The fact that prices stabilised at this elevated level rather than continuing to fall suggests the market found support, consistent with the record bar and coin demand absorbing available supply throughout the period.
The relationship between the volume data and the value data reveals something important about the current market structure:
- Total demand volumes increased just 2% year-on-year
- Yet total demand value surged 74% year-on-year to a record $193 billion
- This disparity implies that price appreciation, not volume expansion, was the primary driver of headline demand value growth
For investors interpreting these figures, this distinction matters. A market where prices are rising dramatically while volumes grow only modestly is a market where supply tightness and risk premium expansion are doing more work than organic demand growth.
The ETF Slowdown: Rotation or Warning Signal?
The deceleration in ETF inflows from 226.5 MT in Q1 2025 to just 62 MT in Q1 2026 has attracted considerable attention. US-listed gold funds recorded notable outflows specifically in March 2026, a pattern that could reflect several distinct dynamics. Furthermore, when considering the choice between physical gold vs ETFs, this rotation offers telling insights into evolving investor preferences.
Possible Explanations for the ETF Deceleration
- Profit-taking after a sustained rally: Institutional investors who entered through ETFs during the 2025 momentum phase may have rotated capital to realise gains at elevated price levels
- Risk rebalancing: Portfolio managers adjusting allocations in response to price appreciation may have trimmed gold ETF exposure as a mechanical rebalancing exercise
- Rotation from paper to physical: A subset of investors may have deliberately shifted from ETF exposure to direct physical holdings, viewing tangible ownership as more secure during periods of heightened geopolitical stress
"A discernible behavioural pattern in precious metals markets suggests that when institutional ETF inflows decelerate, retail and high-net-worth physical demand tends to accelerate. The Q1 2026 data is entirely consistent with this historical pattern, and may reflect a deeper shift in investor preference toward tangible asset ownership during sustained geopolitical uncertainty."
The fact that bar and coin demand surged 42% in the same quarter that ETF inflows fell sharply is not coincidental. It suggests a deliberate migration of capital from paper instruments to physical metal, driven by a preference for direct ownership and physical settlement certainty.
The next major ASX story will hit our subscribers first
Central Bank Demand: A Structural Pillar That Won't Move
Central bank gold demand reached 244 MT in Q1 2026, representing a 3% year-on-year increase and maintaining the strong pace of official sector accumulation that has characterised the market since 2022. (World Gold Council, Gold Demand Trends Q1 2026)
What makes this figure particularly notable is that it was achieved despite a clearly observable rise in selling activity during the same period. Gross selling by some central banks increased, yet net purchases remained at elevated levels because gross buying from other institutions expanded to compensate.
This bidirectional dynamic reflects the heterogeneous nature of central bank gold strategy: some institutions are taking profits or rebalancing, while others are accelerating reserve diversification. The longer-term significance of sustained central bank buying cannot be overstated. Since 2022, official sector purchasing has functioned as a structural demand floor beneath the gold market, absorbing supply that might otherwise have moderated price appreciation.
Jewellery Demand: Volume Collapse, Spending Resilience
The jewellery segment produced one of the most analytically interesting results in the Q1 2026 data. Jewellery demand volumes declined 23% year-on-year, a direct consequence of record-high gold prices reducing affordability and purchase frequency among consumers. Yet total jewellery spending rose 31% over the same period. (World Gold Council, Gold Demand Trends Q1 2026, via Mining Weekly, April 29, 2026)
World Gold Council EMEA Senior Analyst Krishan Gopaul observed that despite the volume contraction, the increase in total spending indicated that underlying positive sentiment toward gold jewellery as both a luxury and store-of-value asset remained intact.
This divergence reveals a sophisticated price elasticity dynamic:
- Consumers are buying fewer pieces of gold jewellery as prices rise
- But they are spending more per transaction, suggesting that the decision to purchase gold jewellery reflects a considered commitment rather than an impulse decision
- The resilience of spending levels indicates that demand for gold as a wearable store of value has not collapsed, even as volume metrics suggest price sensitivity
For market structure purposes, this means jewellery demand is unlikely to disappear as a meaningful demand category, but its contribution to overall gold consumption will continue to decline as a percentage of total demand relative to investment flows.
Technology Demand and the AI Infrastructure Connection
Technology demand edged 1% higher to 82 MT in Q1 2026, with the World Gold Council specifically attributing part of this growth to the continued expansion of artificial intelligence infrastructure. (World Gold Council, Gold Demand Trends Q1 2026, via Mining Weekly, April 29, 2026)
Gold's role in technology applications deserves more attention than it typically receives in mainstream market commentary. The metal's exceptional electrical conductivity, resistance to corrosion, and reliability in high-performance electronic applications make it irreplaceable in certain semiconductor and connector applications. As AI data centre buildouts accelerate globally, the demand for reliable, high-performance bonding wire and connector materials in advanced chips creates a quiet but consistent industrial bid for gold.
Technology demand functions less as a growth catalyst and more as a stable demand floor. At approximately 82 MT per quarter, it provides a baseline of non-discretionary consumption that is not subject to investor sentiment cycles or jewellery price elasticity.
Supply and Demand in Perfect Equilibrium
One of the more striking features of the Q1 2026 data is the near-perfect balance between supply and demand. Both sides of the market registered 1,231 MT for the quarter, indicating no structural imbalance in volume terms. (World Gold Council, Gold Demand Trends Q1 2026, via Mining Weekly, April 29, 2026)
On the supply side:
- Mine production grew 2% year-on-year to 885 MT, suggesting modest but consistent output expansion
- Recycling volumes increased 5% year-on-year to 366 MT, as elevated prices incentivised secondary supply from scrap metal and recycled jewellery
The 5% increase in recycling is a rational market response to high prices, as holders of existing gold seek to monetise holdings at elevated levels. This secondary supply acts as a partial price moderator, introducing additional metal into the market when prices are sufficiently high to incentivise liquidation. The equilibrium between supply and demand at 1,231 MT each suggests that the elevated gold price is not being driven by a physical shortage in volume terms.
Geopolitical Risk and the Outlook for the Remainder of 2026
The World Gold Council has placed geopolitical risk at the centre of its demand outlook for the remainder of 2026. Government bond yields are expected to remain elevated as central banks contend with supply-side inflation shocks arising from the US-Israel-Iran conflict, creating a policy environment where the traditional inverse relationship between yields and gold is complicated by simultaneous inflationary and safe-haven pressures. (World Gold Council, Gold Demand Trends Q1 2026, via Mining Weekly, April 29, 2026)
The council's view is that the geopolitical risk premium embedded in gold pricing is not only likely to persist but may expand as the year progresses. This has significant implications for demand trajectory:
- Investment demand is expected to remain supported by ongoing risk aversion and safe-haven positioning
- Central bank purchasing should continue at elevated levels as reserve managers diversify away from concentrated dollar-denominated holdings
- Jewellery demand will likely remain under volume pressure, though spending resilience suggests the consumer segment will not exit the market entirely
- Bar and coin demand may moderate from the extraordinary Q1 2026 peak but is unlikely to revert to pre-2024 levels given the structural factors driving Asian physical accumulation
Disclaimer: The forward-looking statements and market outlook references contained in this article reflect the published views of the World Gold Council as reported by Mining Weekly on April 29, 2026. These statements involve forecasts and assumptions that may not materialise. Gold market conditions are subject to rapid change based on geopolitical, macroeconomic, and policy developments. This article does not constitute financial advice. Readers should seek independent professional advice before making investment decisions.
Frequently Asked Questions: Global Gold Demand and Bar and Coin Investment
What drove bar and coin demand to a record in Q1 2026?
Bar and coin demand drove global gold demand to a record in the first quarter, surging 42% year-on-year to 474 MT, primarily driven by Chinese physical gold investment reaching an all-time record of 207 MT. Combined with steady central bank purchases of 244 MT and ETF inflows of 62 MT, total demand including OTC transactions reached 1,231 MT for the quarter.
What was the total value of global gold demand in Q1 2026?
Total quarterly gold demand reached a record $193 billion in value terms, representing a 74% year-on-year increase, reflecting both volume growth and gold's exceptional price performance, including a January 2026 peak of $5,400/oz.
How did Q1 2026 bar and coin demand compare to previous records?
At 474 MT, Q1 2026 bar and coin demand represented the second-highest quarterly level ever recorded. Chinese demand alone at 207 MT surpassed the country's previous record of 155 MT set in Q2 2013.
Why did jewellery demand fall despite strong overall gold demand?
Jewellery volumes declined 23% year-on-year in Q1 2026 due to record-high gold prices reducing affordability. However, total jewellery spending rose 31%, indicating sustained consumer commitment to gold ownership at higher price points.
How does Q1 2025 differ from Q1 2026 in what drove demand?
In Q1 2025, ETF inflows of approximately 226.5 MT dominated the investment story, reflecting institutional momentum flows. In Q1 2026, ETF inflows slowed to just 62 MT while bar and coin demand surged 42%, driven by Asian retail and high-net-worth investors pivoting decisively toward physical gold ownership.
What is the outlook for gold demand through the rest of 2026?
The World Gold Council anticipates continued support for investment and central bank demand from geopolitical risk, elevated inflation, and sustained high prices. Jewellery demand is expected to remain under volume pressure while spending levels stay resilient.
Want To Know Which ASX Gold Discoveries Could Benefit From This Historic Shift Toward Physical Gold?
Discovery Alert's proprietary Discovery IQ model delivers real-time alerts the moment significant ASX mineral discoveries are announced, transforming complex geological data into clear, actionable investment insights for both short-term traders and long-term investors. Explore how historic discoveries have generated exceptional returns and begin your 14-day free trial today to ensure you're positioned ahead of the market when the next major gold discovery is made.